Tuesday, May 1, 2012

Additional thoughts

Well my first board meeting was a lo longer than anticipated, what did I get myself in to?

After getting home at 10 p.m. from an incredibly tedious board meeting (these people really do have nothing better to do) and having a late dinner, it only took about 10 minutes of looking around to see the end of day trade was stronger than I previously thought.

Since it's so late, I'm not going to organize these charts as thoroughly as usual, but you'll get the gist of the late day improvement.

First the averages...

 DIA 2 min saw a huge intraday positive divergence starting early, but around the 2:30 break below the SPX's "bearish" continuation triangle (remember bears were expecting the triangle to continue the second leg down today), where I suspect some early bears got trapped shorting the break. The leading positive divergence since then is unmistakably bullish for the near term (next day or so).

 Even the recently weak underlying 3C trade in the IWM saw a big positive divergence, despite the end of day collapse.

 The QQQ's positive divergence just got stronger at the 2:30-ish move below the triangle.

 Here's the actual SPY triangle, since it is symmetrical it is considered a continuation patter, the yellow area is a small head fake, but that is all that was needed. It looks like the early break of regional support was accumulated early to halt the damage.

The SPY intraday chart-that's good confirmation among the 4 major averages.

As for our risk indicators...
 Commodities defied the $USD and rallied with excellent relative strength, GLD and Energy were definitely a big part of this move.

 High Yield Credit is a leading indicator, where credit goes, equities eventually follow, HY Credit was not supportive of the market Friday, today it stayed in the same range as Friday even though equity/SPX prices were lower, this is some support from credit.

 The Euro showed late day strength, meaning the %USD lost some late day ground, giving the market some breathing room, note that the break below the SPX's triangle was a total head fake as they already knew that the $USD arbitrage was bullish for stocks when it broke below the apex. That was thinly veiled!

 And 3C on the Euro showing some accumulation, looks like the Euro should be higher which is good for market risk appetite.

Here's the big shocker, HY Corp. Credit didn't break down today (credit leads), instead it closed green and at the highs of the day in afternoon trade, also as the market staged the head fake move below the triangle.

As for AAPL...

 AAPL is in a support area, both at the trendline and the 50-day ma, which holds no magic other than what traders give it.

 AAPL with a strong 5 min positive divergence, that should be enough to prime AAPL for a move higher.


 Here's GLD vs the Euro (proxy for the dollar), note that gold moved up in to the green today, despite the $USD correlation that would suggest otherwise, since GLD is the primary beneficiary of more QE, which I must at this point mention, Paul Krugman has been everywhere in the last 4 days calling for more QE, I think as I suspected early today, the QE-hopeful crowd seems to have spun the bad economic reports in to good news thinking Bernie has to ease with the economy faltering. I mentioned last week after the F_O_M_C announcement that GLD would be the barometer of QE hopeful sentiment; in their eyes, the weak economic data is QE positive, therefore gold and market positive.

It doesn't matter if the F_E_D actually announces it, they just need their mouthpieces like Krugman to suggest it, then they have plausible deniability. As I said yesterday, the number of F_E_D speakers will give Wall Street what it needs to get the job done.

 TLT-Treasuries, rallied early today because it is a natural flight to safety trade, but look at what happened at the end of day, TLT gave up all of its gains. The flight to safety trade was abandoned.

 Sunday I showed very positive short and long term divergences in the VXX short term SPX volatility index, it seems the short term chart were correct as VXX rallied.

 Here's  the leading positive divergence in the mid term or over the next several days, this accumulation suggests the market takes a dive, but today specifically, there was an intraday negative divergence in to VXX strength, SELL STRENGTH, even if it is only short term.

VXX longer term 15 min chart is very positive, suggesting VXX moves significantly higher, the inverse relationship with the market means the market goes lower, just as we expect, but not before a blow off top rally.

 Sector rotation over the last 2 days shows a few interesting thins, Discretionary in rotation is a risk on signal, Financials are moving out of rotation as we suspected, but they may be so far out that they roll back in for a brief period. Utilities moved as they should being a defensive sector, Energy though was the standout among the 3 pillars (Tech, Financials, Energy) and this with $USD head winds.

 Take a look at Energy's momentum (red) vs the SPX, the $USD correlation can't account for this move, this is where they held the market up today.

 XLE vs the $USD suggests Energy had no business being this strong, it looks like manipulation in Energy to support the market, but I suspect Energy trolls out in the next day or so as Financials and Tech roll in.

 The XLE 15 min chart would seem to agree with recent distribution.

 Financials couldn't get any momentum going until the EOD trade.

 Take a look at today's late day 5 min positive divergence in financials, so far we have the market averages and many industry groups showing strong late day positive divergences.

 Tech tried earlier, but just couldn't get the momentum going.

However the underlying 3C trade shows accumulation intraday in tech, why else would it be there?

As for tonight,

 Based on ES's positive divergences today, I said keep an eye on ES tonight, this far it has recouped all of today's market hour losses.

Remember the positive divergence in the Euro? Since the close look what the Euro has done, this is the risk on currency.

How if Europe can hold up overnight, but even if it can't, I see no reason to throw extra support/$$$ in to the market and not force it to finish it's cycle which should look something like this...


I suspected very strongly we were back on track, but I had no idea so many assets from treasuries, to credit were supportive of further gains in the market and were getting out of the way or in to the game for the move.
I know several of you have sent emails, I want to give them the attention they deserve and it's hard to do this late at night, but I will respond tomorrow when  I can do them justice.

I'm glad to see we almost certainly still have some upside to short in to as this market has seen the ledge break.

Monday, April 30, 2012

Bottom line

The main take away from the market today was that economic weakness in the US is NOT transitory as the F_E_D would have us believe. I think Bernie is caught between a rock and a hard place as to easing, is there's QE3 gas and food prices which the F_E_D considers to be volatile and doesn't consider in inflation projections, would go through the roof with a bunch of money sloshing around in the market heading to all speculative assets, this isn't good in an election year. On the other side, QE is they seem to know and other than lifting the market, it has done nothing for the economy, the same is true of easing in Europe through the 2 LTRO programs, as of today there is a record amount of money from banks in the ECB's deposit facility, that money didn't make it in to the economy, it didn't support bond yields, it went to fill huge bank capital shortfalls.

In the meantime, this trend will progress in the US.

Citigroup Economic Surprise Index has moved down with economic reports surprising to the downside since we moved out of the seasonal adjustment period earlier in the year.

Egan Jones also, like the S&P last week, cut Spain's credit rating today for the second time this year (same as the S&P) from BBB- to BB+, nearly JUNK status and part of the headwinds pressuring the market today. As I have been warning, Spain is the domino that could topple the Euro-zone, but recently Portugal has stepped up as the next country that will likely follow in Greek footsteps with an additional bailout and likely needing the same debt restructuring, I'll talk later about the huge mistake the ECB made with Greece and how that will effect every probable sovereign default in the future.

It was touchy in the market today and for the 4th time in a week, it looks like Wall Street stepped in with some additional support, this is small change compared to what they will distribute on a market move higher. I have expected and continue to expect 1 move higher to trap bull for reason I have mentioned numerous times, it's all about the snow-ball effect.

As for ES toward the close and thus far after the close... the support appears to have paid off.
 ES with a positive divergence all day was enough to halt the early morning slide, again, note how the divergence grew stronger on the dip below the SPX's intraday triangle, which short sellers saw as a continuation pattern, expecting the market to make a second leg down today. Those shorts are now trapped ad as momentum/short term traders, they will likely cover, which is probably what gave ES the momentum it needed to make it back to the VWAP.

WS from being down to recovering its VWAP, this may not look like much on the chart, but it is a victory for Wall Street's short term plans, in fact ES has crossed above the typical resistance found at the VWAP where sellers should be thick.

The ES CONTEXT model below has improved all day with the model showing that the underlying credit, currency, etc conditions are supportive of further gains in ES as the model is higher than ES, this is further evidence that this market volatility bounce is not just quite done, but the market (looking beyond a week or so, is done and in very big trouble, ironically a lot of that trouble is due to the manipulation of prices higher via QE1/2 as stocks are not fairly priced and much higher than they should be, that mean they have a lot of potential downside.


I have my first board meeting since being elected last month to our association's board so I need to get ready for that, but I will follow up with more information on the internals of the market, some tactical ideas for our longer term strategic views and perhaps a few stock ideas as well as covering any changes in the Futures.

If you have email questions, I should be back by 8 pm EDT.

I think today was an excellent day to pick up on several market trends, concepts in trading, and an inside view to what was really going on today as most traders who look at price and not the underlying trade would have been expecting an afternoon sell-off based on the continuation triangle that was in effect all day today. We try to follow in the footsteps of Elephants, always aware that Elephants love eating peanuts.

Enjoy your night, see you soon.


And Here it comes

Around 3:30 day traders (what's left of them) start exiting the market, the trade around that time has traditionally been misleading due to their exiting positions. The 3:30 to 4 p.m. is where institutional money is most active with regard to trade that counts as far as analysis, the a.m. trade is usually very manipulative and deceptive, either taking out limit orders/stops or setting up a head fake move that can be used later.

The support Wall Street has thrown behind the market has kept it afloat as we haven't lost much ground since the open, but we have had some bad fundamental news pressuring the market, as I mentioned many times, "Once Wall Street invests in a cycle, they rarely let it fail", this cycle started April 10th and is a volatility shakeout of the shorts and a bull trap for the longs before they take the market down. The shorts being squeezed on the break at SPX initial support lent momentum to the SPX $1400 move, now they'll be trying to get the bulls trapped to lend momentum to a downside move that has been long in the making.

Unless you are a VERY short term and very nimble trader who is willing to risk a long position in a market that can crack at any moment (I'm pretty aggressive and I wouldn't take that trade), today was not a day to trade, but to be patient which is your biggest edge over Wall Street, you can pick and choose your battles on terms that you define.


 ES continued support is starting to pay off. Watch ES overnight for a possible Gap up tomorrow.

 The intraday triangle... As I said early on today, a 'u' shaped reversal is not likely, but rather a longer 'w" type pattern, the point being, they need time to get large positions in place, even if they are meant to be very short term in nature. I also warned, watch out for the shakeout/head fake move, that happened on the break below today's triangle's apex, the apex is approximately at the red trendline. Since this capture, we are well above that area. This is a lesson that we have learned thousands of times, no matter what timeframe, daily, weekly or 1 minute, the head fake move is there about 80+% of the time before the reversal, it is needed for momentum on the reversal and you'll see what they did with the head fake move below.


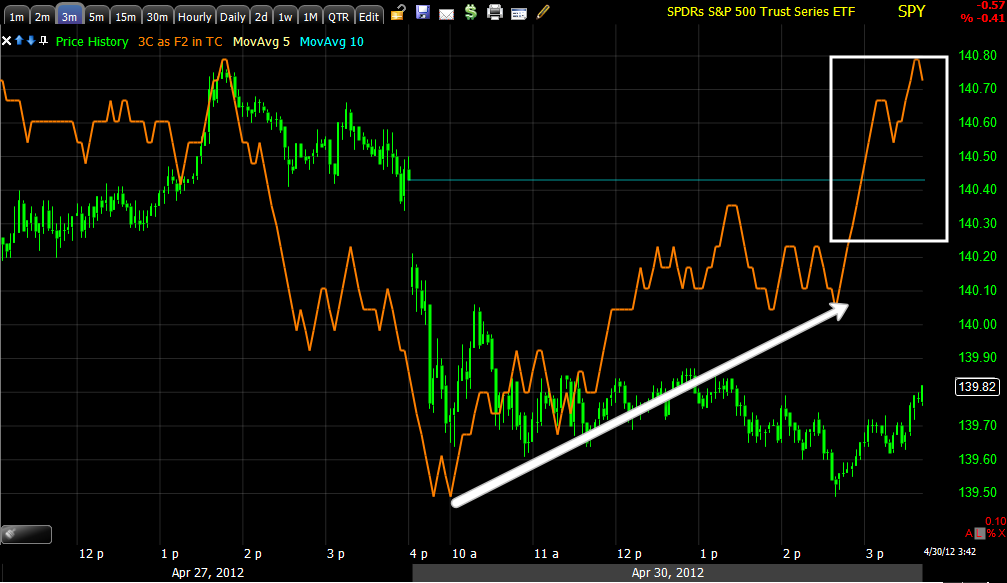
 SPY 2 min intraday positive divergence, look at the relative 3C level at the head fake break below the triangle, price is at the intraday lows, 3C is making a new higher low, increased accumulation as they pick up shares on the cheap that were stopped out. The leading positive since looks good for what I have been expecting, although today was a tough nerve racking day, I trust the charts.

Look at where 3C is at the head fake move below the triangle compared to earlier levels, the stops were accumulated as well as the short sales.

We are on track.

Speaking of Energy-Update

I do think Energy will rotate out, it is not well supported by FX/$USD here. I have a position started in XOM, I'd like to give it another day before adding, but quick coverage can be grabbed with a leveraged Ultrashort like ERY.


 Energy was trending down, we saw what I think was a head fake move out of the triangle and then out of the downtrend.

 Today's 3C chart in Energy showing distribution on strength, there needs to be strength to distribute in to the same way we want to short strength.

 2 min chart shows the same today, in yellow a big distribution point on a head fake move.

 The 3 min chart confirming distribution today

 The 5 min chart's trend is horrible, this is a deep leading negative divergence.

 The 15 min chart is bad enough that I would consider Energy/XLE a short here, I would leave some room on the stop though.

 The 60 min has a great negative divergence, the pop above the downtrend sen to the far right in negatively divergent.

We can look at XOM closer tomorrow as the market would need dollar weakness which would help energy in the very short term, this could be the chance to initiate or add, but as I mentioned above, for the longer term, I have no problem being short energy right here.

Bounce is still very much a possibility

In fact I'd say it is a probability. I haven't caught up with the rest of the news today, but the earlier Chicago PMI was disastrous and the Dallas F_E_D manufacturing index, other than having 1 sub index on employment that looked decent, was pretty bad. Considering, the market has held up well today, of Wall Street were not running a cycle (volatility shakeout) off the April 10th lows, these reports would have sent the market much lower and when the market break, the continuing trend of these reports is likely to do so in the near future. Remember the market is emotional above all else, FEAR and GREED and if you look at any market cycle, you'll see Fear is much stronger than Greed, take the 2002-2007 bull market and it all being taken back and then some in less than 18 months with the majority of that in 8 months.

Looking at ES however (this is short term only), they continue to add support, as I have believed all along (and we've had an excellent track record with these bounces), AAPL will be the stock to watch and I believe the market has one last upside push.

ES seems to verify that as they keep throwing more support behind it on an intraday basis (meaning the amount of support pales in comparison to how much they distribute on the moves up).

3C is nearly parabolic on ES 1 min.

I still have positions to add in AAPL, BIDU and a few other, I still feel pretty confident that patience here is the best tactic from the charts that have formed late last week and today.

Energy is one we'll have to take a close look at as it is the only real support among the 3 major sectors today. It should rotate out on an AAPL driven move and that's where we'll want to be looking to add/initiate Energy shorts in select area.


BIDU Update

BIDU is an example of patience and letting the trade come to you rather than chasing it, as well as the power of phasing in to a trade, which MUST be distinguished between the horrible idea of dollar cost averaging. The difference is all in your trade plan, I purposefully phased in to BIDU with a large stop and smaller position size so I could add to BIDU, it was part of my trading plan before I ever executed a position. Dollar cost averaging, whether long or short i an emotional reaction to a position that is going against you and that i already outside of your risk management plan.

My BIDU position averaged is at a 9+% gain as of now, but if you have been following the trade idea, I expect a lot more. This is one to keep an eye on as it is still in long term good position and we may not get another chance to add on strength.


 The long term picture is that of a large triangle after an extended uptrend, these are almost never consolidations, but rather tops (or bottoms if the preceding trend was down). The daily 3C chart shows the long term distribution going on in BIDU previous to the triangle appearing.


 The trade plan was the same as usual, BIDU is in a top that should break down, wait for the head fake move to short in to strength, 3C confirmed we would see a head fake move breakout above the triangle and that it would be sold in to, the yellow area is where BIDU made the head fake move above the triangle-this is where we wanted to start shorting BIDU on strength-let the trade come to you.

 Near term BIDU has a gap and a short term positive divergence like the market, AAPL, ES nd a number of other risk assets, it wants to make a move higher although I very much doubt we will see the head fake area and probably more likely a gap fill and maybe some.

BIDU hourly shows the distribution in to the head fake move. I have room to add about 40% in BIDU and being I started the position higher, my last phase in is usually as the trade is confirmed to be moving in my direction on some short term strength, so if you have been following or phasing in to BIDU, any strength over the next day or so should be looked at as an opportunity to consider shorting or adding to BIDU. The larger trend's price pattern target implication is around the $70 area conservatively speaking, this can be leveraged up, here' an example from an article I wrote at Trade-Guild.net that is linked on the left side under "Resources and Concepts", you can make more than 100% in a short trade.

Keep BIDU on your radar.

Still working to push the market higher

 We are coming in to the last hour of trade which is the most important, They seem to still be throwing short term support behind AAPL which at this point is a proxy for the entire market.

The same is true of ES.

Context

Last night the CONTEXT model was DEEP in the red, recently the underlying conditions that make up the model have improved slightly and the model is now higher than ES, not by a lot as there are some significant head winds, currencies are not supportive, but for the most part they aren't hurting too bad either, they are pretty much in line. I would think this is why we are seeing some external support on the charts, for example ES-still positive.

Recently the leading positive in ES has grown even more. There's a bit of a fight going on here between the macro data and the cycle set up, but it looks like there's increased support as the day wears on, I'm still in the camp Wall Street is going to run this higher one last time.


Pretty close to make or break time...

 The Bollinger Bands (10 min) are ver tight, indicative of a highly directional move (considering the timeframe).

 Here's the Apex of the triangle, as I have warned in nearly all of the updates, "Watch for a head fake move first" and it looks like we have that move as price moved just below the triangle and volume ticked up as stops were hit/shorts entered (it's all the same-selling).

 SPY intraday positive divergence.

 The volume surge wasn't HUGE on the break below the triangle's apex, but the NYSE TICK chart shows that move to have the lowest TICK reading of the day, a lot of stocks moved down right there and there' a positive TICK divergence since.

ES remains in an intraday positive divergence which is not too common lately during these overall distribution periods in to strength, but in my opinion the market stepped in again to support it from falling too much on the economic data misses as I suspect they still want that final blow-off move above $1403 or greater.

Quick Market Update

 AAPL which never confirmed the downside move, continues to hold up on the short term chart, it's now moving intraday to a leading positive divergence. I don't think the AAPL chapter is quite finished yet.


 DIA 2 min is now leading positive above Friday's highs as it remains in a flat range like area, which is a typical accumulation area, remember though these are short term chart for short term trends, the longer term trend as you know is in shambles.

 The IWM 3 min is continuing to move higher even though this has been one of the worst as far as underlying trade goes, I don't see the IWM as setting any break out precedents that will encourage the bulls like the SPX could do.

 QQQ 5 min is improving and leading positive here.

 The triangle has grown much larger, I warned about an intraday head fake move below the triangle, it looks close to making that move, so pay attention we could see a fast move shortly.

The SPY 2 min is also looking much better in the area here.