Tuesday, June 12, 2012

Market Update

Something just changed fast, the IWM, QQQ 5 min charts just went nuts to the upside

Gold Miners Update

Since I've already fielded several emails about the gold miners today I thought I'd just address them in a post.

The basic answer I've given is that despite the nice move in NUGT today and miners in general (GDX), I personally wouldn't be chasing the miners long here and if I had to make a choice right now between DUST (3x short miners) or NUGT (3x long miners), I'd choose DUST, that is if I had to make a choice right now, the caveat being to me the trade looks like it is moving away from the miners, but the signals are not strong enough for me to consider a trade in them right now as they have given very strong signals in the past.

 The 5 day chart of GDX (Gold Miners), long term this isn't a pretty chart, volume looked good early in the uptrend, but since it looks like a large top that has already broken.


 As usual, if I can't short the stock near the highs of the top, I'm generally not interested in chasing the first break as there's almost always a shakeout move (unless it's a swing type trade) that usually offers a better entry.

 We almost always see a head fake move above some important level before a reversal, normally I'd say it would be above the red trendline, but the white trendline could serve equally as well, the reason I have a question mark is because of the normal behavior of moving above the major resistance area and there's a chart or two that seem like this is still a possibility, but I see the trade as having past the point of the easy money.

 Just locally the 1 min chart isn't keeping pace and is negatively divergent with the 6/8 highs.

 The 5 min chart shows a strong negative divergence on what is potentially the head fake move above with the "?" above it, the highs of the 8th and today's higher highs are negatively divergence here too.

 The 15 min chart went from pretty much in line to negative at that same spot that is a suspected head fake move, the reason for the question mark is the relative positive divergence to the right, however keep in mind that even though there's a relative divergence, 3C i lower than it should be for confirmation. If there's to be one more head fake move up above the major resistance, yes money can be made, does it look like a high probability, low risk trade? No.

 The 30 min chart gave a good long signal back in May, but that has deteriorated quite a bit.

 The 60 min chart has given excellent signals both short and long, this chart isn't there yet and that's why I'd personally hold off on going short miners, at the same time as mentioned above, any further upside doesn't look like a low risk/high probability trade, there are thousands of stocks to trade, I see no reason to take a trade that is sub par.

As for the leveraged ETF's, they are giving similar signals, DUST the 3x leveraged short on miners is positive on the 30 min, not quite there on the 60 min though like GDX above is not quite there on the 60 min.

NUGT the 3x leveraged long miners is negative on the 30 min just like GDX and the opposite of DUST, again it's not quite there on the 60 min. So all in all it looks like the gold miners trade is winding down, but I think it's a bit too early to enter  a short there, I think we'll get a better signal before too much longer.


FB Update

Thus far today FB held our target area pullback from yesterday and looks like yesterday's quick head fake episode is over as FB is working to move back in line on the short term/intraday chats and remains in a very positive position on the more important longer term charts.

 Yesterday our downside pullback target for FB was the 60 min 22 bar m.a. which is a typical pullback after a move has started and seen a pullback or two to the 10 bar m.a. The red arrow shows where FB closed in relation to our target, 8 cents off! Now FB is tentatively moving higher with a nearly 2% gain on the day, it needs to break to a new high to see momentum pick up.


 Although I'd prefer a larger channel, the furthest I can go out is the 60 min Trend Channel which is one of my proprietary indicators that self adjusts to each stocks recent volatility and allows for consolidations, the channel held yesterday as FB did not violate the lower channel on a closing basis.

 The 1 min intraday from yesterday shows the triangle we suspected would see a head fake upside breakout (yellow box), then a positive divergence stabilized FB at a .33% loss on the day, excellent relative performance. This a.m. FB is in line.

The 5 min showing the probability was pretty good we'd see a head fake move on yesterday's bullish continuation triangle, then the relative positive divergence at the lows and Fb is now back in line with trade from June 8th, it just needs to shows us a little better underlying trade, but thus far is off to a good start.

As I mentioned to a member yesterday, every time I look at FB's 60 min chart I smile, it is one of the stronger positive divergences on an important timeframe we've seen recently.

Risk Asset Layout

YEsterday's deterioration in the Risk Asset Layout had me saying, it needs to get back in line and soon, this morning true to CONTEXT and as you will see, 3C, there's improvement.

 High Yield Corp. Credit improved quite a bit on the open and around 10:30, HYC Credit is leading the SPX here, but note the time of the divergence in credit vs the SPX.

 Exactly the same time as we see it in 3C and the market averages, the point being, sophisticated investors are looking at much more than MACD and Stochastics.

 HYC Credit was in line on the 7th, it led on the 8th and part of yesterday early on before dropping, it is moving back toward a leading position and thus the asset is jumping back in line as I warned yesterday, we'd need to see fairly quickly.

 High Yield Credit is where the real damage was done yesterday, it went positively divergent vs the SPX at the same time this morning.

 As you can see, HY Credit still has work to do to get back in line or better, to a leading position, but at least it's moving in the right direction now. I think the lack of planning and the subordination threat from the European Finance Ministers yesterday really spooked the market.

 Yields are also seeing significant improvement today, leading the SPX intraday

 Yields on a bit longer timeframe improving, I added the white trendline so you could make relative comparisons between where yields are and the SPX, yields are looking a lot better and they tend to be an excellent leading indicator.

 Now we see yields moving back in line rather than the threatening posture they had yesterday.

 The $AUD is also leading the market this morning

 Bigger picture, the $AUD is pretty much in line with the SPX, things could have gone south from yesterday's close.

 The Euro and SPX are moving pretty much together this morning

As for sectors today vs yesterday, Financials are holding, the flight to safety sectors are falling off, healthcare, staples and utilities.  Energy is rotating in, Basic Materials where a lot of momentum stocks are, is also rotating in, industrials as well. Tech and Discretionary are lagging in relative momentum vs the SPX.


Overall, not a perfect picture, but much better than yesterday when it was starting to get a bit scary. I don't want to confuse new members by sounding like I'm bullish on the market, I'm only bullish for a near term (or sub-intermediate trend) up on a short squeeze, longer term positioning is quite bearish.


Context Model

This is the first time this week I've seen the CONTEXT model above ES, something must be changing in the underlying components that make up their model, I'm going to take a look at our own Risk Asset Layout, as you may remember, credit yesterday, especially High Yield was very ugly, but something has changed in CONTEXT so I assume there may be changes in our own indicators.

The model lags by 30 mins, but it has turned positive with the model above ES.

Market Update

Several of the averages are showing some early and fairly decent intraday positive divergences, what is also interesting is none of the averages show a negative divergence on even the fastest timeframes as the market gained downside momentum yesterday around 1:30 which is also around the time that news broke that CDS would not protect Spanish bond holders from being subordinated by the EU bank bailout loan, the implication being that smart money didn't have time to sell intraday positions as the news was not discounted and moved the market quickly.


 DIA 1 min, the red box is where we'd expect to see a negative divergence in to the afternoon decline, it's also the same time the ISDA made their determination that CDS would not be triggered in the case of Spanish bond holder subordination to the senior EU loan through the ESM. We also see a leading positive divergence in the DIA starting this a.m.

 The 2 min DIA chart confirms the same.

 As does the 3 min chart.

 The IWM shows the same thing as the DIA, both yesterday and this morning.

 The IWM 2 min chart isn't as strong as the DIA as of yet.


 The QQQ 1 min chart also confirms the DIA chart findings with no negative at 1:30 yesterday and a leading positive this a.m.

 Again the 2 min chart isn't quite as strong as the DIA as of yet.

 There's some action on the 3 min, not huge, but maybe the start of something.

 The SPY has a relative positive, but it is by far the weakest in underlying trade this a.m., although yesterday's findings are the same here.

Not much to see on the 2 min chart yet either.

What is GLD up to?

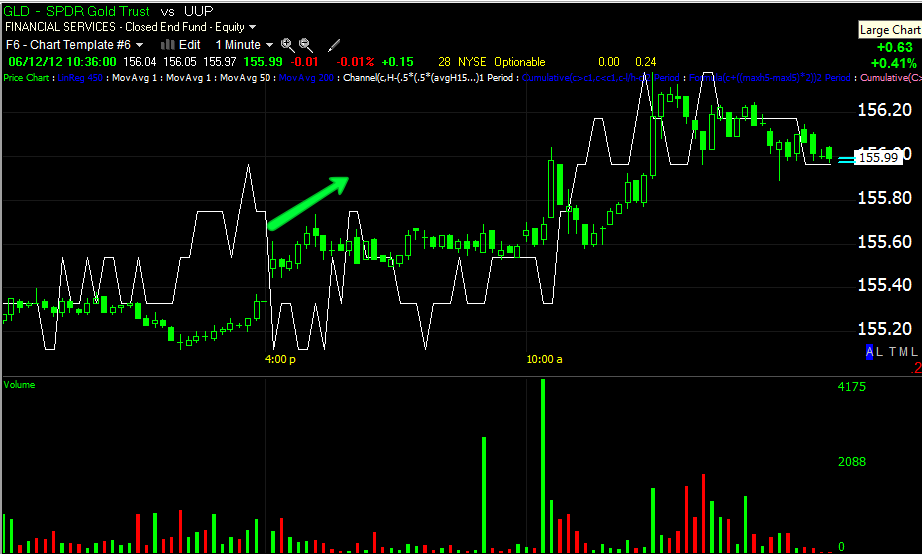
Again for the second day GLD is moving or was moving this morning, against it's FX correlation and up with the $USD. GLD is trapped between some longer term charts that still look bullish from that positive divergence at the May 30th lows that sent GLD soaring and between deteriorating mid term (5-15 min) charts. The short term charts have been pretty strong, thus the short term charts "if" they can keep up the strength, should effect mid term charts and all timeframes would be bullish, that is "if" the short term charts can keep it up and we are starting to see an intraday negative divergence on the short term charts. However the bigger question with gold acting as an easing expectations indicator and the F_O_M_C coming up in 9 days, what if anything is this telling us about the F_O_M_C?

 Again GLD in green is trading up this a.m. with the dollar (there's usually an inverse correlation), so this is strange.

 The 1 min trend has largely been in confirmation of the recent move with a negative divergence jut forming this a.m., but as you see it wouldn't be the first and the trend remained uninterrupted.

Intraday 2 min is also seeing  bit of a negative divergence, I'd say it's too early in the day to make much of these divergences, but I think we need to pay attention to gold and what if any message it is sending, perhaps about the upcoming F_O_M_C meeting.

Overnight and In to the open.

The next bailout coming in days?

According to the FT, Cyprus which hinted at this yesterday, is set to seek a bailout within days.

Also overnight...

UK Industrial /Manufacturing Production missed at -0.7 on expectations of -0.1 (previous +.9)

As explained yesterday the Euro Finance Ministers came up with a bailout number larger than what consensus sees Spanish banks as needing as a way to create a Bazooka effect, the problem was bond subordination that could force Spain from needing a bank bailout to a full blown sovereign bailout as their bonds were dumped en masse yesterday on news that the bond holders' rights were subordinated to the banking loan.

As such, Spain is in danger with rising yields of being locked out of the credit markets.

As expected, there is market talk the ECB has reactivated the SMP after nearly 4 months of no activity and was buying in the secondary bond markets; yet Spanish 10 years are still higher on the day. The Spanish 10 year last seen earlier this morning at 6.644% and Italian 10 year at 6.123%, but since then Spanish bonds have seen higher yields with these comments from Merkel regarding Euro-bonds which Germany opposes and is becoming a key argument in the North/South divide...


  • *MERKEL SAYS WRONG TIME TO DISCUSS POSSIBILITY OF EURO BONDS
  • *MERKEL SAYS STATES MUST GIVE UP SOME SOVEREIGNTY TO EU
  • *MERKEL SAYS JOINT LIABILITIES IN EUROPE REQUIRE JOINT CONTROLS
  • *MERKEL SAYS INVESTORS' INTEREST NOT IDENTICAL WITH EUROPE'S-
That last bullet point statement could easily be taken as the market took the news yesterday that the ESM loans are senior to any private creditors (bond holders), it may even expand the view beyond the ESM.

This sent Spanish 10 year yields to their 15 year highs at 6.67%.


The NYSE short interest data is out, May saw an increase of 800 million bringing the total to 14.3 bn, which is a bit higher than where the short interest was at November 30 of 2011.
The last time the NYSE short interest was at these levels in November 2011, the market fell 6% and that's when we saw the globally coordinated easing.

Aslo just as I have been explaining, the test of resistance brings in more shorts, look at the May activity as May short interest gained by 800 mn.


In the US, Import/Export Prices were released at 8:30


Released On 6/12/2012 8:30:00 AM For May, 2012
PriorConsensusConsensus RangeActual
Export Prices - M/M change0.4 %0.1 %-0.2 % to 0.1 %-0.4 %
Export Prices - Y/Y change0.7 %-0.1 %
Import Prices - M/M change-0.5 %-1.1 %-1.9 % to -0.4 %-1.0 %
Import Prices - Y/Y change0.5 %-0.3 %
Exports -month to month- missed consensus as did the year on year. Month to month Import prices saw the largest drop in 2 years, but actually coming in pretty close to consensus, although the prior of -.5% was revised to 0%. The year over year import prices saw the first drop in 32 months.

As for ES and the Euro/Dollar...

 Shortly after market last night I saw a 3C positive divergence developing, I chose not to post it as it didn't seem sufficiently large enough to be game changing, but it did lift ES, at least until the European open at the green arrow (chart continued below).

 Since the Euro open to the US open, lots of chop.

 The Euro/Dollar held up at the short term uptrend line overnight.

The larger view, the blue arrow is the May 1 downtrend, the green arrow is the short term uptrend, the red is major resistance and the yellow is the start to FX trade this week.

Market updates coming.

Monday, June 11, 2012

Risk Asset Close and Take on the Spanish BB

I was interested in how the risk asset layout would close, especially high yield credit. There's not much point in positing all of the charts as there's not much to see.

Commodities were in line with the SPX almost all day, they actually tracked the SPX much closer than the EUR or $USD as the Euro managed to close close to its 11:30 a.m. intraday lows, while commodities and the SPX closed at their lows.  Since the market outperformed the Euro substantially Friday and the market underperformed the Euro substantially today, it puts the two pretty close to reversion to the mean with the Euro just a tad lower since Friday's action.

High Yield Corporate credit which had held up better than High Yield Credit earlier in the day, saw downside action in the afternoon closing at it's lows for a -.58% loss on the day, both HY Crop Credit and the SPX have also reverted to their mean, meaning they are roughly in the same place.

High Yield Credit didn't improve at all, which is a bit scary, but it's also 1 day and it's impossible to know how the JPM unwind of the whale trade is effecting credit, but we can't deal in speculation, HY Credit was ugly today taking out the 6/7 lows while the SPX remains just above them.

Yields closed off their lows of the day, but also closed an hour earlier than the SPX.

Financials were hit harder on the day, but didn't have the same downside momentum as the SPX over the last two hours of the day. Energy gave up its relative burst of momentum vs the SPX from 11:30-1 p.m. and closed just a little worse than the SPX at -1.36% vs. -1.27 for the SPX. Tech also gave up its better relative performance seen in the morning and closed down -1.45%; APPL's last hour or so of trade had a direct impact on Tech as you would imagine (AAPL down -1.52%)

The Euro gave up a lot today...
 All of the opening gap gains were lost and then some.

The major resistance area which the Euro gapped above was lost, the short term uptrend (green) was just barely broken, while it remains above the May 1 downtrend (blue).

All in all, a schizophrenic market action from over-joyed to manic. I was happy to see the Euro up last night, but the reality of the incompetence of the EU Finance Ministers had me concerned with the lack of details. I suppose I'm a little surprised as well at how fast the details emerged, but to be fair that sword cuts both ways. The EU tried today to stick save some of the damage done in a not so well thought out plan.

I certainly have no illusions about the course of the EU and how things will end, but in the interim, right now they are brainstorming to find a way to undo some of the mess their Spanish Banking Bailout plan caused, THEY HAVE TO, otherwise the Spanish banking bailout will quickly turn in to a Spanish sovereign bailout. This is the law of the EU's unintended consequences. The consensus was Spanish banks may need $60-$80 bn Euros, the Fin Mins thought they'd blow the market away with their $100 bn Euro Bazooka, they apparently just didn't look at the details and in the process went from creating what they thought would be well received by the market to a bigger mess that could precipitate not only a Spanish Banking Bailout, but a sovereign one as the ESM senior debt scheme sends sovereign debt creditors heading for the exits en masse, which means Spain could be locked completely out of the debt markets and then the bailout will be much, much bigger.


So long story short, look for more announcements from the EU trying to remedy this mess, they actually took a bad situation and made it a lot worse, PAR FOR THE COURSE!

ISDA Unlikely to Trigger CDS in Spanish Debt Subordination

Last night my Week Ahead post was sarcastically titled,


Here are a few excerpts:

"Another thing to watch are Spanish bonds as the 3% loan is far lower than the 6+% Spain is paying on 10 year debt. There are some initial report that the banking bailout via the ESM (which ironically was never supposed to be used for a direct bank bailout) may not be without conditions and those conditions may subordinate Spanish debt holders. In short, there's a strong possibility that the seeds have been sown in Spain for a Greek like PSI debt restructuring in which none other than you know who gets stiffed, the Spanish debt bond holders."

"While I don't believe for a minute that anything is even closer to begin fixed in Europe and I don't believe this Spanish bailout will be nearly as smooth as initial Sunday opening trade indicates over the next few weeks, the market is about sentiment and headlines and this weekend provided them." 

 "ES seeing 3C confirm the uptrend all of Friday and a 22 point opening move Sunday night above Friday's already impressive move. Although we still have a long night which I'm sure more details on the Spanish bailout will emerge on the European open in a few hours"

"Just remember the market is not going to make this a cake walk, but when in doubt, go to the big picture."

Sure enough, the word "Subordination" was what all the hoopla in the market was about today. I won't go in to details as to why the temporary EFSF is not likely to fund a Spanish banking bailout and I won't go in to much detail about the permanent ESM mechanism that probably would be used, even though Germany is yet to ratify the mechanism. I will say that IMF funds which will not play a role in the bailout are not legally senior to other debt, although they are given preferential status. However, the ESM has in its treaty, law that subordinates all other debt, meaning the ESM gets paid back before any other creditors.

This is what has caused a lot of trouble for the not so well thought out Spanish Bank bailout announcement that committed $100 bn euros of money (that isn't actually reality yet as the ESM has not been ratified by Germany) over the course of a 2 and a half hour teleconference. How long did it take Greece to negotiate a bailout again? 

As mentioned last night and we saw early today, Spanish sovereign debt was being sold hand over fist as creditors realized they were being subordinated and may indeed face a Greek-like debt restructuring deal; their only protection in such a situation is CDS (Credit Default Swaps), a kind of insurance that pays out if the country (Spain) defaults on their payments to sovereign debt holders because the ESM debt has legal seniority.

The ISDA is the committee that determines whether an actual "Credit Event" has taken place and whether the CDS insurance policy pays out. Today in a Reuters article, the IFR weighed in and the consensus was, the CDS would not be triggered, thus stiffing Spanish Bond holders again for the second time in 24 hours.

 ESM loans unlikely to trigger Spain CDS


Just for good measure, the ISDA came to the same conclusion 

Spanish CDS Trigger Unlikely on Subordination, Says ISDA *Dow Jones

The market's reaction around that time...

Another brilliant meeting of the EU Finance Ministers, hoping to give the market a Bazooka and instead giving it a wedgie.