Tuesday, July 24, 2012

AAPL Update

Lots of emails as I'd expect on AAPL today. I opened a core short position in AAPL some time ago and decided to keep it open by hedging the core shorts, the question facing us immediately is AAPL earnings today after market.

First, the market may take AAPL earnings on a knee jerk reaction and celebrate them as AAPL is WELL KNOWN for guiding very low and then always coming up with a surprise beat, it's not so much a beat as it is them setting expectations very low to start with, so AAPL could very well see a knee jerk reaction to an earnings beat that is dissected Wednesday to show that the AAPL earnings really weren't all that hot.

Ever since AAPL declared a dividend, I have thought that it was most likely the end of the growth story for AAPL, the same thing happened after MsFT declared a dividend, yes MSFT was once a big momentum stock.

In any case, from what I see, (although I want to keep an eye on AAPL throughout the day and also check the Tech sector as that has been a "tell in the past ) I'm not going to be closing my short, but I also don't see any compelling reason to trade AAPL' earnings. Earnings are a wild card and unless we have a VERY strong signal that intimates a leak, they are like gambling (although with AAPL you can almost be assured they'll beat, but then be dissected in the days after and that reaction could be quite different).

In any case, here are the charts for AAPL as of now...

 First of all, AAPL has a VERY obvious bullish bull flag in place right now, for technical traders, this suggests AAPL is about to break out to the upside and put in the next leg higher which is usually about the same distance as the height of the flag pole (from about $565 to $618/$620). Volume is not perfect or really even close to correct for a bull flag, but you can bet AAPL longs are transfixed on this bull flag. We know from experience that if there were to be a downside reversal in AAPL, we'd expect a pattern like this to show up and about 80% of the time we'd have some variation of a head fake move, whether that be a quick break above the flag followed by a move below the flag or whether it be a longer break above the flag pulling in more longs and then a drop below the flag putting them at a loss, a new high even or just a total failure of the flag with a move below the flag tomorrow, we ALMOST ALWAYS see some head fake move; so needless to say I find the appearance of a bull flag in the most watched stock in the market, on the day of earnings to be a little suspicious and that bull flag was born from a bullish ascending triangle!


 Looking at the 1 min chart, especially today, I'm not impressed with what I see, this chart is leading negative which suggests there's distribution (although on a light scale) taking place; this isn't always bearish-if AAPL were going to beat and move higher, you'd want to knock price down and accumulate as cheap as possible, I just don't like the overall look of the chart, but again it's only a 1 min chart.


 The 2 min chart looks like 3C was lagging a bit as the flag-pole portion of the bull flag was formed, during the flag section I don't see any areas of really heavy accumulation/positive divergences, in fact, the chart looks like it's in a simple consolidation with no bias.

 The 5 min chart shows a positive divergence JUST BEFORE the flag pole was created, the positive was near the lows and as the flag pole played out and we moved in to the flag, you can see where it looks like there were negative divergences every time price reached the top of the flag and small positive divergences when prices reached the bottom of the flag. I don't see what I would call heavy accumulation or distribution activity, what I see almost looks like the intentional formation of a bull flag.


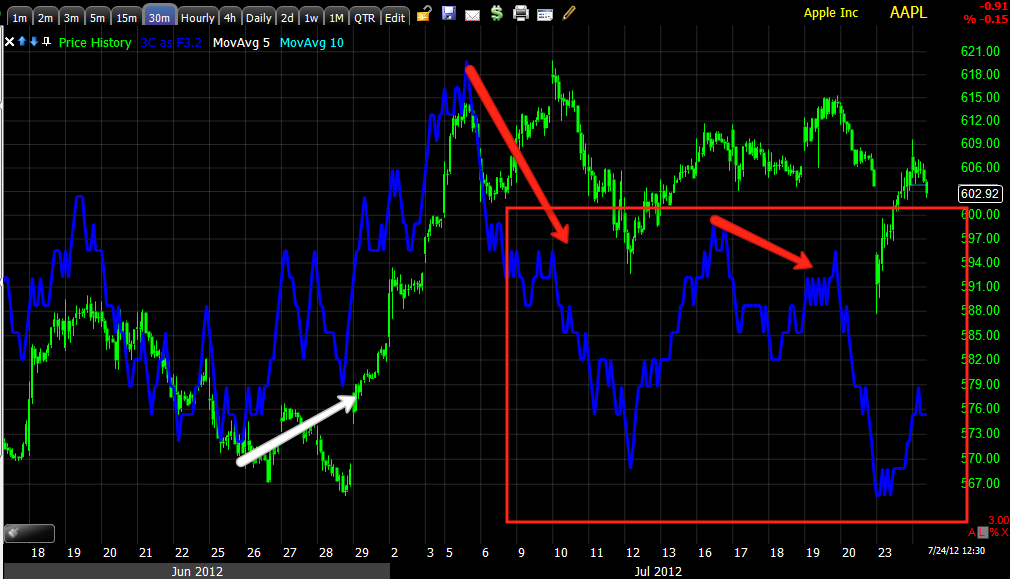
The 30 min chart which is a more important timeframe shows the positive divergence just before the flag pole was created, it also shows the negative divergences at the top of the resistance trend line of the flag, however it does not show any positive divergences at the lower support line of the flag, that's only seen on shorter term charts. In fact, the overall view I get of the flag on this chart is a leading negative position.

 You might remember way back when and I reminded you yesterday, I said I thought AAPL was having a 1 time large accumulation event and I wouldn't expect to see much in the way of big positive divergences, just the selling of the accumulated shares, well to the left is that large accumulation event and I believe that is what has been driving AAPL ever since, but other than just before the flag pole was formed, there are no other large positive divergences that stand out and I'd call the flag portion of the pattern leading negative on this 15 min chart.

 You can see the accumulation even on this 60 min chart and AAPL trading mostly in line, there's no positive divergence before the flag pole on this chart, the divergence wasn't strong enough to make it to this 60 min chart, however, the overall position of 3C in the flag is leading negative, even though it does have a positive divergence at yesterday's lows. This could be for a head fake move to the upside, I'll be keeping an eye on it today as we have seen some major tell signals on earnings just 15 minutes before earnings.

The long term trend in AAPL and the reason I keep the AAPL core short open can be seen on the trend of the 60 min chart, it went from up trend confirmation to a sharp and fast leading negative divergence at AAPL's highs and that 1 time large accumulation event (white) I mentioned, but overall the recent action is still within a leading negative position.

Personally I with what we see now, I wouldn't take any earnings trades in AAPL. To me it looks like the primary trend will reassert itself as bearish in time, but before we get major reversals we almost always get head fake moves and with AAPL it would likely be one of the biggest, there's just no way to tell what it might look like (go back and re-read all o the different scenarios I mentioned near the top)  and therefore I'd rather just sit it out, see if any opportunities open up and otherwise be patient with AAPL.

FB Update

As you may remember I started some FB Aug $27 and hoped to add to that position a I have been waiting for a pullback since we first entered FB near the bottom and saw some very nice profits. The current position is up about 21% right now and I'd love to add to it, but on the short term charts I just can't find the pullback or the short term signals giving me reason to add to the position. I do like the way the longer term 60 min chart is developing, this is the chart that got us in the trade long at the bottom, so I will hold the open position for now, but I just don't see the edge in adding here yet.

 Here's the FB head fake move we expected in the yellow box on a bullish ascending triangle right on long term support, the break below support wasn't surprising and now we have a bear's dream, a bear flag which according to technical Analysis should break to the downside for the next leg down, this would be the perfect bear trap for a counter trend move higher, such as what we have seen in BIDU today, although the patterns are different, the set up is the same.

 The 15 min BIDU and faster timeframes are just not giving me a pullback as deep as I'd like to see or the kind of signals I'd like to see to have an edge to add to the trade right now, it still remains just a bit smaller than a speculative position.

 The 30 min shows the pullback/negative divergence I had been waiting for and after that in a lateral area 3C actually went positive before the pullback, I'm still wondering what's going on with that, what the real purpose of this pullback is , "Is it in fact to set up a bear trap?".


In any case, to the far left was the original long signal on the 60 min chart which was much bigger back then, the negative divergence, but notice it's not a VERY strong negative divergence as well as that area of 3C strength before the pullback, currently the 60 min chart has a leading positive position which I like, but that' more strategic and adding to the position is more tactical and found on the shorter term charts, that's what I'm still missing. I'll stick with the position I have now, speculative unless/until something develops that opens up a nice edge.

UNG Update

UNG as you know is one of the only long term long positions I like and I believe the only one in the equities model portfolio (as a core position), this is a long term trade and I view and treat it as such.

As for the recent breakout above resistance, we were hoping to see UNG move from a stage 1 base to stage 2 mark up, but for stage 2 mark up we need retail to chase the stock and as mentioned yesterday, retail doesn't seem to be in a mood right now to chase much of anything on the upside. I still think UNG will hit stage 2 and see some nice gains from there, I have no intention of closing the long position there that is currently up 26% with no leverage. I do think UNG will pull back now though.

Here are the updated charts...

 Even though UNG is above the base's resistance, there's still local overhead resistance nearby from the bearish descending consolidation triangle.

 The 1 min trend confirmation in UNG has turned in to non-confirmation on today's gap up.

 The same is true of the 2 min chart, no confirmation of the gap up today.


 The 3 min chart looks more serious and looks as if UNG is definitely going to pullback in near term trade.

 The 5 min also went from upside confirmation of the breakout to a negative divergence.

 Overall the 60 min chart's trend is leading positive and this is why I like UNG long term, but if you look at price, it has broken above the last 2 resistance/reversal ares, the 60 min 3C chart has not done the same so once again we have non-confirmation of this move above resistance of the base area.

I'm hoping we only see a pullback near the base support area around $20, but Wall St. games would almost dictate a break below that support just to shakeout longs, in that case I'll be watching the $16.50 area and may consider adding to UNG if all still looks good in that area, but one day at a time.


Market Update Cont...

 DIA 1 min is showing one of the stronger intraday 1 min positive divergences as prices moved lower, it seems to have been showing short term, intraday accumulation which should be enough to at least turn us laterally for a bit, it will depend on whether the divergence strengthens and moves to the longer time frame charts.

 The 2 min shows the rot I was talking about last night as the DIA started out yesterday is a positive position and then went to a negative divergence at the highs of the day and most of the afternoon, right now the current position is about in line or trend confirmation. We'll see if the 1 min can gather strength and bleed over to the longer 2 min chart, then we have a more serious possible intraday reversal.

 The 3 min chart is a little worse than in line, it's a little leading negative right now, you can also see how it went from positive yesterday to negative through the entire afternoon.

 The IWM 1 min is also, like the DIA showing a positive divergence this morning, you can see how bad the 3C action was for the IWM 1 min yesterday.

 The 2 min shows the same afternoon negative action and this morning the 2 min chart is in line with price or trend confirmation.

 The 3 min chart is in the same position.

 The QQQ 1 min is also positive this a.m. with a leading positive 1 min divergence, again, we'll see if it can build on this very early start.


 The 2 min chart is not seeing any of that positive activity, it is leading negative from yesterday's afternoon damage.

 The 3 min chart saw damage yesterday, but overall is still in a leading positive position, this is why it is so important to see what these early 1, 2 and 3 min charts are going to do.


The SPY 1 min is leading positive, you can see how it has halted the downside, it will need to build on this divergence if it is to do more than just halt the downside.

 The SPY 2 min is in line, that's about it.

 The 3 min is in line after seeing some deep damage late yesterday.


Market Update

So far it looks like the 1 min charts are starting to see some positive divergences so I think we'll be losing downside momentum and probably move at least to a lateral consolidation, if strength keeps up, then we have a shot for an intraday reversal moving to the upside from here.

Charts to follow...

BIDU-Tempted to take profits

This is what we've been expecting and waiting for in BIDU...
 A counter trend move and a bear trap to get it started.

This is why we expected it...

Positive 3C divergences from 15 min to 4 hour charts.

Some members have already emailed me this morning that they've doubled their money in calls bought just yesterday, my own call position in the options model portfolio is up about 55% in $110 August calls, I probably should take some off the table here, but I'm expecting more of a counter trend move so I think I may just hold a bit longer and see how the position fares.

On the overnight doubles, I would have taken the profit too, congratulations.

Overnight and In to the Open

As speculated Monday, Commodities recent relative strength seemed to indicate that China may come out with a stronger than expected Flash PMI reading, last night they did exactly that with a 5 month high, still that's 9 months of contraction at 49.5, but the manufacturing output index was at a nine month high showing some strength within the index.

You may have also heard that yesterday Moody's didn't strip the Aaa rating of Germany, the Netherlands and Luxembourg, but did cut the outlook to negative which is about as close a you can come to a downgrade without actually downgrading the 3 Aaa rated countries.

Spain has also announced if the ECB doesn't return to their SMP bond buying program that has effectively been shut down for about 5 months and in effect, support Spanish yields as they climb higher in to the stratosphere, Spain may be forced to seek a full blown sovereign bailout just as we predicted when the banking bailout was first announced months ago. In light of that news, the meeting between the Spanish Economic Minister and the German finance minister today is being closely watched for any developments.

Further deepening the problems in Spain as Germany received warning from Moody'd yesterday that their Aaa status may be revoked if thy keep bailing out countries, Spain's region of Catalonia is now looking for bailout help from the government, this is a large region responsible for about 320% of the country's output. Almost overnight Spain seemingly went from "The weak state that holds all the chips" to "They're on their own".

As for the EUR/USD, it lost a little ground overnight.

Here's what ES looked like...fairly flat, but maintained in the area...

 From yesterday's 4 p.m. close to the European open at the green arrow.


From the European open to present...

We'll be watching the short term charts to see if they move their positive divergence dividing lines created yesterday. Thus far the market is on the same trajectory it started late yesterday afternoon after entering the large bear flag (just barely).

Updates on the way


3C Indications

Last week when I was talking about the next trend in the market being a pullback and a pullback that is more extreme than that we'd usually consider a pullback to be, I also mentioned that it wouldn't likely be a straight shot down, there would be volatility and noise in the trend to keep everyone on their toes (this isn't a market for chasing stocks).

XLK, Technology is a perfect example of where we are at with the averages...

First here's the SPY

Early today I mentioned I thought the most probable outcome to shakeout the most number of traders was to rally the market off the gap down lows and back in to the flag, that's exactly what happened, but as I pointed out earlier, in my original vision, I thought it would move higher and take another day, so there's a decent possibility that we see a little more upside, as I'll show you, for now, I want to sell or short in to price strength as the short term charts have some bullish signals that are teetering, but the longer term, more important charts are still solidly negative, so for this trend (short term pullback), the direction I want to trade in is short or to the down side and and price strength I want to use to help me get in position.

Now for XLK/Tech as our example...
 First we're going to look at the longest timeframe chart (from 1 min to 15 min) that the positive divergence made it to today, for XLK, the positive divergence reached the 15 min chart with a leading positive divergence, you can see last week's negative divergence sending us lower this morning.


 Next we're going to the next longest timeframe to see what the divergence may have done to that timeframe, in this instance that's the 30 min chart (pretty long timeframes for a single day's move) and there's nothing positive on this chart at all, this is what most of the averages are like, there's a stone wall dividing today's positive divergence from the trend's negative divergence.

The question that has to be answered as soon as possible tomorrow is whether the longest positive divergence can hold because in all cases, the shortest charts like the 1, 2, 3, or 5 min have gone negative and migrated as they should through the timeframes; if they continue, they'll take done the strongest divergence timeframe of the day (for XLK the strongest is 5 min).


On XLK the 1, 2, and 3 min timeframe above have all gone from early positive to very negative as the day progressed. The 5 min is in line, if the 1, 2,and 3 min continue negative, the 5 min will go negative followed likely by the 15 min and we'll have a good ida of near term trade to use for tactical entries.

The other 2 important industry groups, Financials and Energy...

 XLE 15 min went negative last week and that is still the dominant trend, but today there's a decent positive divergence on an important timeframe.


 The next timeframe is like a brick wall, the 30 min is leading negative, therefore, I want to trade from the short side, I just want to narrow down where we are going to be so I can plan entries.

 Financials 5 min shows the major trend being a negative divergence, that sent price lower, but today we saw a 5 min positive divergence, just remember the shorter term timeframes are already rotting away as seen in Tech.

On the other side of the 5 min and the faster timeframes rotting way we have the 15 min chart with a clear leading negative divergence and a large trend there, I don't want to trade against this for the time being.

As for the averages...

 The DIA's best trend is only on a 1 min chart, but it is leading positive at a new high, the 2, 3 and 5 min timeframes are already rotting away.


 The 15 min is solidly leading negative.

 IWM 5 min, the major trend is a leading negative divergence that sent the market lower, today's leading positive divergence is on the 5 min.

Here's an example of the earlier timeframes rotting out...
 IWM 1 min looks the worst, it should migrate to the next timeframe and it does...

 IWM 2 min looks almost as bad

The IWM 3 min is negative, but not as bad as the 1 min, this is normal. If the short term trends keep deteriorating, this 3 min will look worse and probably start to deteriorate the positive 5 min IWM chart at the top, if not, then the market has some support to move higher very short term, but this is noise in the trend, it can be used to our advantage, but we want to know how it develops to best use it.

 On the longer side of the 5 min positive IWM, the 15 min is leading negative, this is where the short term trend is.

 QQQ only made it to the 3 min and even there we can see some deterioration throughout the afternoon.

The 5 min never saw any of the positive intraday divergence from today and remained leading negative.

The SPY shows a nice 5 min leading positive and that may be because financials were looking pretty good today. 

 The 60 min is showing a strong, long leading negative trend. The 15 min which is the next longest timeframe is negative too, I just wanted to show you this 60 min trend.

The $USD trend may play a big part in the near term trade (the Euro too, although it doesn't have as consistent signals as the $USD), UUP a proxy for the $USD has negatives from 1 to 60 min, a lower $USD will generally support higher risk asset prices. My initial gut feeling is that we see some very volatile moves, but also very quick to change trend, but this is part and parcel of the noise within any trend for the last 4 months.

Watch the opening gap and trend, lately it has been reversing intraday.