I've mentioned that recently we've had some pretty extreme moves in everything, not just the averages, but I'll stick to those for now. If I wasn't aware of trend classification by price, I'd swear by the looks of the 3C charts, that we had entered the first stage of a real bear market at the May 1 top and the ride up from the June 4th lows was nothing more than a counter trend bear market rally, which is exactly what I suspected and still believe the BIDU move was. Obviously the market's price trend doesn't look like BIDU's, but the underlying trade looks exactly like a counter trend move just like BIDU.
From left to right, BIDU Primary Uptrend (actually part of a stage 3 top), the area we shorted BIDU for the core short position
ON A HEAD FAKE MOVE , Primary Downtrend starts, counter trend bear market rally, next: resumption of the Primary Bear trend.
While price in the averages makes it impossible to label them the same, the 3C underlying trade looks like that's exactly what is happening, this was our 3rd and final trend assumption; after a strong move up and head fake/bull traps were set, we'd move in to a primary downtrend or bear market.
I'll be showing you a lot of different timeframes, trends and activity (the actual flow of money in and out of an average during a head fake move-the mechanics of it) at highly probable bull-traps.
DIA 1 min saw 1 leading negative divergence from the 16th/17th, today's is at a higher price and a deeper 3C low, making this an extreme move in 3C and a bearish one at that.
2 min DIA Trend above a resistance level and at this morning's intraday highs, a sharp leading negative divergence in to price strength. This tells us what the move up was being used for by smart money.
DIA 3 min at the same area, this is an EXTREME move in 3C, you don't see these often.
DIA 5 min 3C leading negative today to a new low.
DIA 15 min chart with relative negative divergence at today's highs, followed by an almost uninterrupted, vertical leading negative divergence on a pretty long timeframe that doesn't naturally or typically move that fast.
DIA 4 hour, note resistance and the accumulation on Aug 2nd (this was seen everywhere we looked that day, it was market wide), the accumulation pushes price above resistance and from there 3C starts to go negative and then leads negative on a VERY long timeframe.
ES 5 min showing the persistent negative divergence since yesterday as well as one of the sharpest moves I've seen in ES today , leading negative and to new lows.
ES 30 min with a very clear leading negative trend and right where the break above resistance would be .
ES 60 min
ES 4 hour, shows the March-May negative divergence, the June lows positive divergence and the current negative divergence.
ES Daily-confirmation of the uptrend from 2011 in to early 2012, negative divergence at that top where we entered core shorts and the current negative divergence in a leading negative position.
IWM 1 min deeply leading negative, look at the 3C trend and the break above resistance.
IWM 2 min , again note the trend line (white) and the negative 3C trend, no where near confirmation, as price passes the resistance area.
IWM 3 min, confirmation with the Aug 2nd accumulation, a negative divergence in to the breakout above the IWM range/resistance.
IWM 3 dy is pretty far out, but besides the smaller divergences and the larger calling the 2007 top, the 2009 bottom, the 2011 top that lost -20% in a blink of an eye and the current leading negative position, it's lower than the 2009 bottom! That's an extreme chart.

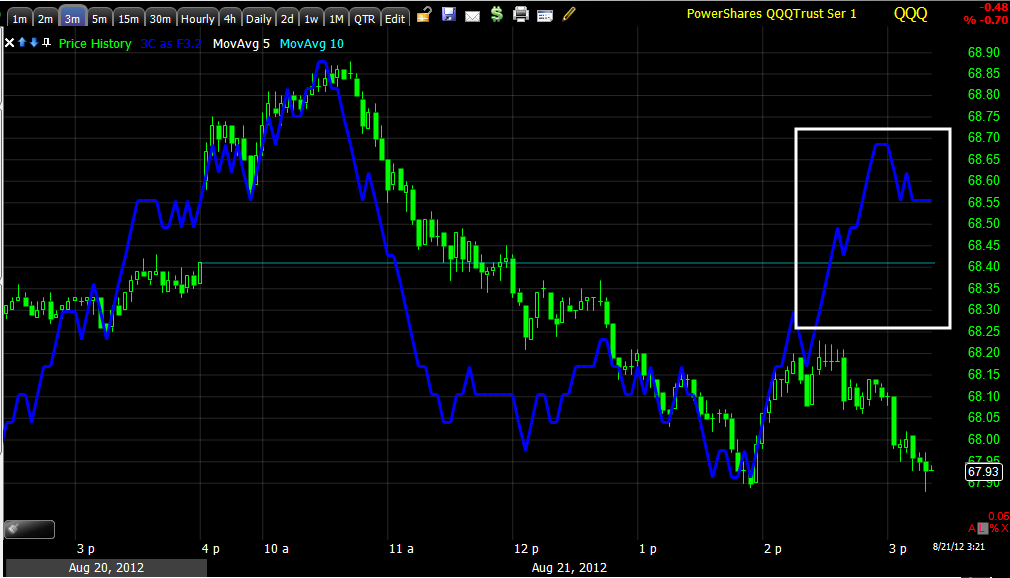
QQQ 2 min leading negative and deeply today
QQQ 5 min trend, note resistance again and the deep change in character, also remember how bad the NASDAQ Advance /Decline line has been in the same area from my breadth post.
QQQ 15 min, same concept above resistance. Today's 15 min move is very sharp as well
QQQ 60 min, downtrend confirmation, June low accumulation, uptrend confirmation and resistance broken with a leading negative divergence.
QQQ daily, I don't think this needs an explanation.
SPY 1 min with an extreme move the last several days.
SPY 10 min with an almost uninterrupted leading negative move today.
SPY 2 min also with a nasty trend and a deep leading neg. move today alone.
SPY 60 min , pretty self explanatory.






 | Theme by Thur


