Friday, September 21, 2012

Market Update- DIA, IWM & QQQ

There's a lot I still want to get to, AAPL, Risk Asset Layout, several stocks and industry groups and hopefully future and Currencies. AAPL is falling apart quickly, I'm not referring to price.

A quick look at the majors...
 DIA 1 min close up intraday note the series of tweaks that have kept the DIA right along the area of yesterday's close (seen as a thin light blue line). Again it looks like an op-ex peg.

 DIA 1 min trend for the last couple of days, there's a recurrent theme among the averages, Sept 17th -18th accumulation, in to Sept 19th distribution at the highs. The 1 min chart is in a leading negative divergence on the trend view and this is all post QE3 so it's all new data.

 2 min DIa from Wed. negative divergence at the close to what in effect is just in line movement yesterday and part of today, other than the neg. divergence late on the 19th, the current leading negative are the only 2 that stand out. Remember we don't want to torture the chart to find a signal, either it is obvious or not.

 DIA 3 min from QE3 shows the trend I mentioned among the averages, accumulation on the 17th, distribution late yesterday (19th) and this chart shows a clear leading negative divergence.

5 min distribution on 19th and in line, no significant divergences here although  recently it's starting to lead a bit negative.

 IWM 2 min shows the positive on 17/18th and is basically in line since, no divergence stands out.

 3 min from the 13th-QE3 with that same trend of accumulation on 17/18th, distribution Thursday afternoon and currently 3C is in a leading negative position.


 IWM 5 min shows the same trend mentioned on the 17th, then in to the 19th, in line most of yesterday and some subtle weakness here.

 Divergences can accrue on longer term timeframes, what doesn't appear obvious on a 1 min chart or 2, 3 min chart can accrue as the divergences take on a trend that you might not otherwise notice, especially if the underlying action is very secretive, meaning very quiet, remember there are a whole class of HFTs that do nothing but hunt for "Icebergs", big institutional orders being filled and then they front run them costing the institution a lot of money, sort of like when day traders use to try to scalp in front of a market maker, but much faster. In any case this 10 min leading negative is interesting when looking at the QQQ


 QQQ 1 min, we can find divergences, but overall, this is in line the last 2 days.

 2 min negative in to Thursday's close and a series of slight tweaks today keeping the Q's very close to the close yesterday.

 3 min QQQ , the same trend mentioned at the start of the post is evident here, 17th accumulation, 19th distribution, yesterday largely in line, today a leading negative position.

 5 min chart with the exact same as above

 QQQ 5 min close up, note small divergences keeping Q's close to yesterday's close, yesterday I thought an op-ex pin would be the theme and many traders are already closing or have closed out their option positions today.

Remember the IWM 10 min, take a look at the QQQ 10 min.

AAPL next

Market Update-SPY

The SPY posed an interesting question yesterday initially, later in the day I figured I might have a reason for an out of place divergence, but one that would be very influential in analysis. Today the idea I had about it seems to be on its way to being confirmed.

The other averages for the most part are still looking very much like a pin is in effect, but there's also deterioration and I'll show you that next.

There's also deterioration in AAPL, although I suspect it will close somewhere in the area on an options pin, I need to look at the chain.

Also the Risk Asset Layout is seeing deterioration today as well. There are  lot of things in motion with quadruple witching/S&P Index rebalancing and all of the derivative rebalancing that is associated, so lots of moving parts so everything has to be put in its context, but all in all there seems to be some good data.

Lets tale a look at the SPY and the question of the 15 min chart from the open yesterday.


 Since yesterday afternoon's intraday high, 1 min 3C has been negatively divergent. Currently on an intraday basis there's a relative positive divergence here (this is the weakest divergence) and to me suggests that the SPY is likely being modestly tweaked here and there to keep it within a range for an options expiration pin.

 The 2 min chart saw a negative divergence on the 19th as prices fell, the gap was filled, but by that time the 2 min chart was already negative and that was the top. The chart now is in leading negative position, a new low for 3C in the area with a slight relative positive divergence which is the same as the 1 min chart above.

 3 min chart also negative at the 19th, price down on the 20th, the same negative divergence at yesterday's highs and gap fill with a new leading negative divergence today like the 2 min chart, also a small relative positive intraday like the 1 and 2 min charts.

 Here's where the initial question was yesterday and pretty important too on this timeframe. The afternoon highs on the 19th were negative, price fell on the 20th and immediately created what looked like a strong 15 min positive divergence on the open, that would suggest there had been strong accumulation of the gap down, however I later posted (which was just common sense) that the 15 min chart between the 4 pm close of the 19th and the 10 am lows of the 20th had absolutely no time to move to any position that wouldn't have shown a positive divergence, In fact if you look at 3C on that morning, it had only 4 bars to move and it only can move a fixed amount per bar, each of the 4 bars moved down before the chart simply followed price. The divergence on the 18th was real, it did have the time to form and price did respond to it.

 I haven't been looking at much data pre-QE3 announcement as I want to see the specific reaction to the QE3 announcement, although it very well may be valid to include data before the announcement as QE3 very well could have been discounted and as such the data would be not only relevant, but very important. In that context, the question of the 15 min chart is easy to answer, it's leading negative.

However, staying with the post QE3 data, there's something interesting on the 15 min chart as it has had time to move today. If you draw an imaginary line from price point A to price point B you get an upward sloping trend line, however if you look at 3C it is below point 3C at point A yesterday, in fact for simple trend confirmation with no bullish or bearish bias, 3C would be where the first orange arrow is. if there were positive underlying action, then it might even be higher like the second orange arrow, perhaps leading to a new high on the price pullback, instead it's actually leading to a lower low as price is higher, the definition of a negative divergence.

I'll keep an eye out for development, I want to bring you the rest of the market and Risk Assets.

AMD Charts

I'm going to add a speculative position of about 5% to the equity model portfolio long holding for AMD. This way there's no pressure, no expiration dates and if this wants to become something bigger, there's nothing stopping me from letting it become what it wants. There's also plenty of room to add if that looks like something I might want to do.


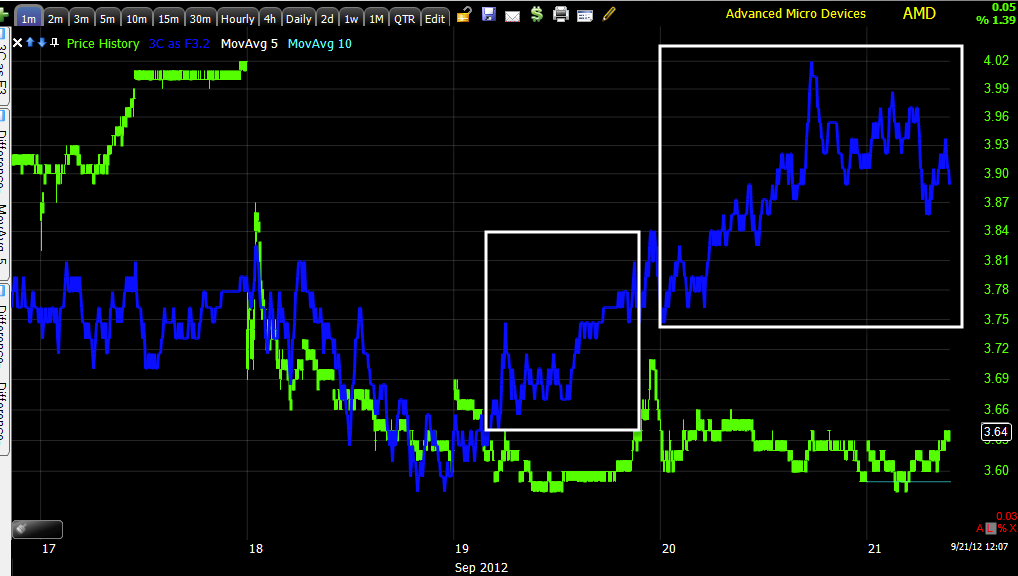
 AMD lost ground from the 19th' late day run, but held up well on a relative basis vs the market on the 20th. You may recall FB had an initial first run in August and some of you made money with leverage, but from the first sign of that initial small run in FB, it seemed very likely FB would go on to build a larger base, that appears to be what's happening in AMD, although I'm not very confident that the base will be anywhere near as large a what developed in FB.


 The 1 min chart looked very strong on the 19th, it has only added much more in a leading positive trend in the tell-tale flat price area.

 The 2 min chart shows what looks to be apparent accumulation at the white trend line.

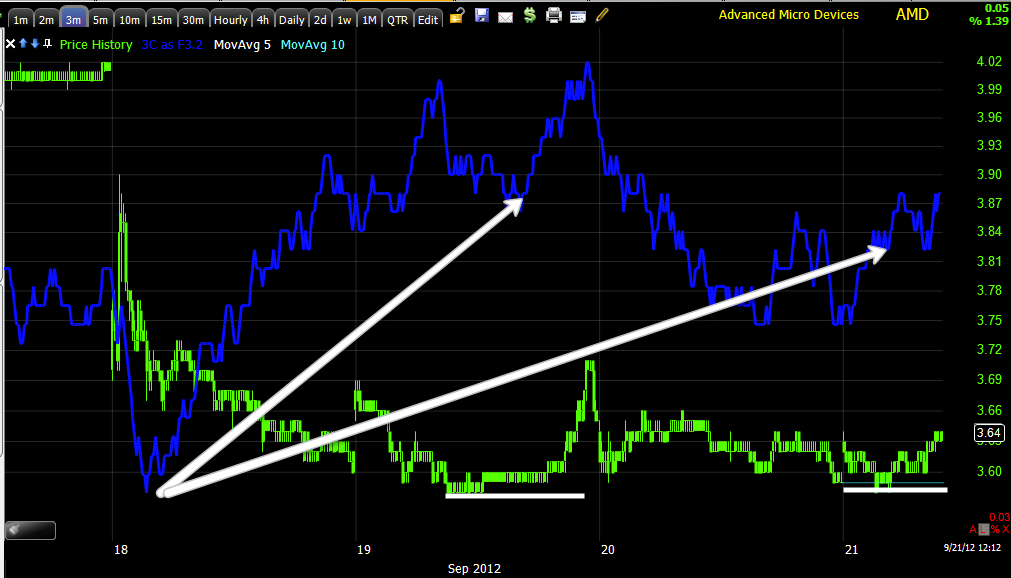
 The 3 min chart is also leading positive (thus far good migration through the timeframes) and again the support area at $3.58 seems key so far. If the support zone goes on for too long and becomes too obvious, a shakeout below it becomes increasingly likely.

 The 15 min chat has developed quite quickly as it fell apart quickly as well, but a nice leading positive there as well.

Now even the 30 min chart is picking up on the action in the timeframes that are below.

I'm not going to post it now, but there is a chance that there might be something even larger developing on the 4 hour chart, again right now I can't say that it has caught up and is relevant, but I'll be keeping an eye on it.


AMD Looking Interesting Again

Take a look at AMD (long), it has built a larger base and may in fact be preparing for a more sustained move. I wanted to get this out ASAP so you have a head's up, charts are to follow.

Gold and Miners

There was a time about a decade ago or so when gold miners actually led gold, after all they had the goods. That relationship flip-flopped.

Recently 3C has pointed out some signals in miners that appeared to be not so bullish for the group, apparently the South African Gold Miner Strike was to blame. That strike seemed to end when "A" (as in single) Lonmin Maricana mine  negotiated a 22% increase in wages for striking miners sending them back to work. The problem was that was 1 company and it didn't take other miners long to demand the same wages.

Perhaps this is the bigger problem with miners that smart money may have been anticipating, it seems pretty reasonable.

Gold just made a sharp move down along with miners, it's a small move for now, but the problem that caused it may not be so short in duration.

Here's Gold and the move...
 On a very short term 1 min basis, GLD seems to have decent confirmation...

 The same can be said of  the VERY recent 10 min chart as I'm trying to gather data post QE3 announcement, use a longer trend timeframe and the picture is not so bright.

 Here's GDX the gold miners since QE3, in a leading negative divergence on a 10 min chart-all post QE3.

 Here's GDX on a 1 min timeframe this morning, while it seems to follow gold in price action, the underlying action looks very different.

 Here's DUST since QE3 alone... 3x leveraged bear miners.

And 15 in NUGT since QE3 alone - 3x leveraged bull gold miners.

The catalyst for the move in both gold and miners just minutes ago... Bloomberg mentioned wage talks among South African gold miners. The issue has expanded as  was predictable.

Obviously there's a longer term issue here, a 20+% increase in mining companies costs which if you remember how the miners trading system was created, it was based mostly on subtle increases in fuel costs and some currency valuation changes.

Something was obviously not sitting well with the market with regard to miners and it wasn't over a violent strike at a single mine, it appears to be over what looks to be a strike that will engulf all of South Africa's gold miners and likely beyond their borders.

GDX needs to be watched very carefully moving forward as this may be bigger than a trade, this may be a complete trend change.


MCP Follow Up

As a reminder, MCP was a trade we looked at about a week ago; the idea was it looked like a possible long trade that would come to us (more favorable price, lower risk, hopefully higher probabilities). So far stage 1 of the analysis for the MCP long set up is in motion: halting the climb higher and pulling back toward the initial target of the 10-day moving average.

Yesterday after a -3.08% move down it wouldn't seem likely to get so far a -1% move today on account of a short term oversold basis, but MCP still had not reached our target, today that has started to change so perhaps the second stage of our expectations/plans is being fulfilled.

The last stage is to see the underlying trading action turn very bullish by demonstrating the negative divergences needed to take it down are transforming in to positive divergences suggesting accumulation of the pullback, the exact same way we want to enter the trade-by letting it come to us rather than chasing it higher, which if we had, we'd not only be down -3% or so, we'd also have wasted over a week in opportunity cost and unnecessary market risk.

MCP is not where I would call it a long trade right now, but it is in the area in which we would expect to see the signals needed to call it a long trade start to develop.

Here's the update...
 The X-Over Screen went from a short signal to a long signal, the pullback to the yellow 10-day moving average is the initial target area and we are there today.

 The 30 min chart shows the accumulation that got this leg up kicked off, then a negative divergence which was our signal to keep an eye on MCP as a pullback/long candidate.

 The 1 min chart showed some accumulation yesterday at the a.m. lows, price responded so it could be an intraday positive divergence only that has already been consummated, but I doubt it given the leading positive that followed. What we want to watch for now is improving positive divergences in the yellow area as price likely moves toward yesterday's lows.

 The 3 min chart shows something similar since the pullback divergence showed up, yesterday' lows saw a positive divergence and leading at that, again the area in yellow is where we want to see big improvement as prices pullback a bit more.

 The 5 min chart is no different than the others above, just not quite as strong being a longer timeframe and taking more to move it.

The 15 min chart "could" put in a positive if 3C turns up, this is a better situation than the SPY 15 min relative positive right off the open yesterday at the 15 min chart had no time to move, here we do have time to move. Ultimately we'll want to see the 15 min timeframe positive before making any commitment here, however that can happen quickly.

Opening Indications

Yesterday's last market update went like this:

"Going in to the close, NQ and ES short term futures are negative, SPY, QQQ and DIA are also, the IWM is not."

SPY/QQQ and DIA were short term negative in to the close, the IWM was not, this is pretty clearly reflected in performance of the 4 averages this morning.

Here are the opening indications out to 5 min., both ES and NQ futures (S&P/NASDAQ) on the 1 min timeframe are pretty much in line, there's nothing very interesting to see there.

 DIA 1 min negative in to the close yesterday and thus far negative in to the open and not trading in line, but slightly negative-probably reflected somewhat in its relative rice performance this a.m.

 2 min chart is pretty much in line with price including the open.

 3 min is definitely negative here, there's a slight intraday positive at the morning lows

 5 min is mostly in line with  slight negative on the open, but in line since. It's very early, but if these charts were similar toward the afternoon, I'd say the Dow is being set up for an op-ex price pin in the area.

 The IWM is the one that stood out yesterday as positive, it's leading positive near the close and in line on the open.

 2 min is leading positive all afternoon and in line on the open, although the rate of change in price is a lot stronger than the rate of change in 3C here.

 3 min leading positive near the close and in line on the open.

 5 min positive on the close and nearly perfectly in line on the open.

 QQQ 1 min relative negative near the close yesterday, a slightly deeper relative negative on the open today and in line since.

 2 min negative on the open and finding a small positive divergence at the morning lows

 3 min mostly in line yesterday, not confirming the open today as it is negative.

 5 min is the exact same as the 3 min

 SPY 1 min negative on the close yesterday and i line this morning.

 2 min negative yesterday afternoon, in line today

 SPY 3 min negative yesterday at the afternoon highs and starting to lead negative today.

5 min negative yesterday at the afternoon high and in line thus far.

This is a bit unusual for even an early update as morning trade is often noisy, but what is unusual is the number of charts that are in line, it seems to show very little strong underlying action or influence, it almost seems as if it is maintenance only to keep prices in an op-ex pin.

We'll see what else comes up, the deterioration early in risk assets other than commodities is also interesting.

Scattered Open

Along one of the themes I've mentioned since QE3, but really pointed out as being a strong possibility yesterday was this market turns in to a Stock picker's or even more accurately an Asset Picker's market.

While 40 minutes is not reasonable evidence to base any such claim on, especially on a day in which we have quadruple witching, Window Dressing, Hedge Fund redemptions coming and the rebalancing of the S&P along with every derivative product, there is something clearly unique about this morning's open.

The S&P is in the red, the Dow is barely in the green and the Russell 2k is up +.90%. At the same time, every risk asset we track from currencies (Euro and Australian Dollar) to Yields, to Credit (3 different forms of risk on credit) are all on the run except, Commodities which are performing with the R2k.

So an interesting start to the morning indeed.

USO short term strength was seen yesterday causing me to close the USO long, today it has gapped up +.55%, Gold has gapped up along the lines of the R2K, as have a number of non-precious metals, which make me wonder if yesterday's decent Philly F_E_D has a positive outlook on manufacturing this morning, however transports have not participated and I'd think they would especially after yesterday's performance.

I think I know what is going on with Greek yields as they sky-rocket, but I want to quickly double check the facts.

Opening indications up next.