Wednesday, October 10, 2012

Closing Out UCO For Now

I'm closing the UCO long oil trade for now, this is why I chose a leveraged ETF, it was a quick trade that I want to be able to trade around. On a pullback with positive divergences I'll add it back as I think it has more to go, but for a couple of days, a 9+% profit is decent and I don't want to lose that.


Futures

Futures look choppy as they have all night, however when that happens there's usually some underlying trade going on as HFT's scalping is hard to identify direction on short term charts, but as always, "When in doubt, go to the longer term charts" and there we see something interesting along the lines of that S&P bear flag head fake move that locks in the shorts and then lets their covering do the work.

We're in an area I'd consider a leveraged long market index like TQQQ or URTY as a short term trading vehicle to take advantage of the signals on the futures charts as well as other signals building or in place.

As a matter of fact, I'm going to be looking for a speculative entry in 2 parts in one of the leveraged market bull ETFs, maybe UPRO, URTY, something along those lines.  I'll post them when I find them, but the first will be soon.

Here are the futures charts for the S&P and NASDAQ minis

ES-SPX
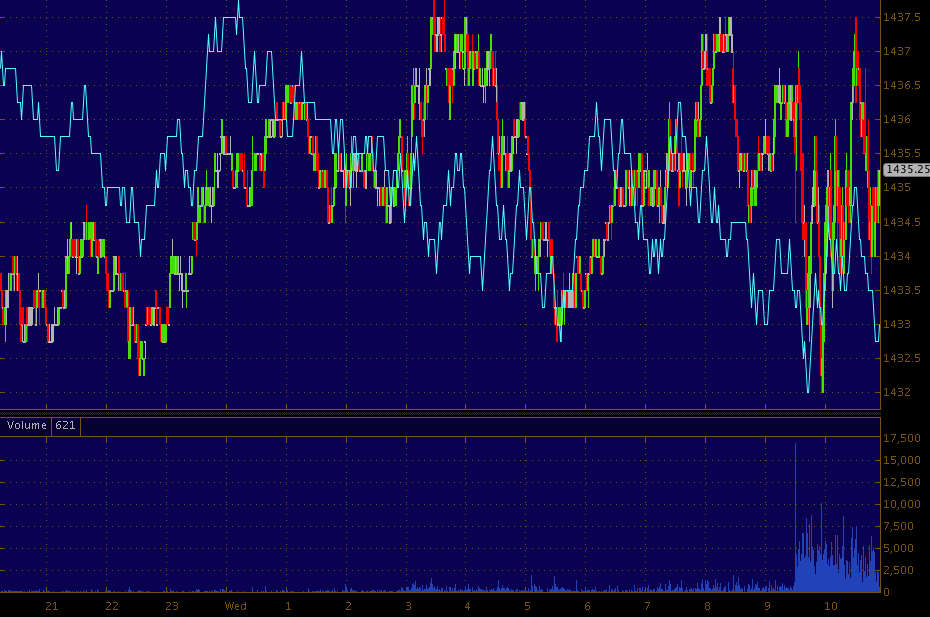
 Like I said, the 1 min charts are very choppy like trade, likely HFTs / algos muddying up the water, but go out longer...

 5 min ES leading positive right at the flat area where accumulation is most often seen.It's always the dull area of the market that is the most important.

 Check out the ES 15 min chart, leading positive at a new 3C higher high.

 And the 30 min ES, negative from 10/5 and now at a new leading positive high.

NASDAQ futures...
 Again the 1 min is very choppy, but the overnight range has also been narrow.

 However the NQ 5 min needs no annotation.

 The 15 min negative at the 5th of October and leading positive in a big way now.

NQ 30 min.

These are solid signals on important timeframes, to me, very much worth taking a long position and I don't think it matters too much which ETF is chosen as everything is so highly correlated, but I lean toward the S&P or NDX on a leveraged basis as this is for a shorter term trade of maybe several days.

Early Indications

It's no secret that the Dow/DIA has had the worst underlying trade all week, there have been days this week where not a single definitive positive divergence could be found, it's having a change in character.

The DIA's support from yesterday was the same as the close, the run below that this morning on the 1 min chart produced a leading positive divergence which for the DIA this week is different. However more importantly...

The DIA 10 min chart is showing migration of small divergences that have accrued on the 10 min chart, it's leading positive at today's open and has made its first higher high since it went negative last week.

The SPY 1 min positive divergence looks right for that range yesterday, that's where we most often see divergences, in flat ranges, but it is also leading positive on the open as the red trendlines represent the close and lower support from yesterday.

Scratch that last post

Because of the holiday for most government offices Monday on Columbus day, the EIA Petroleum status was moved forward to tomorrow at 11:00 a.m., the Natural Gas report from EIA will remain at the usual time at 10:30 tomorrow.

EIA Petroleum Report coming-Be Ready

If you are in the USO/UCO long trade, be ready for the EIA report at 10:30, if there's any bad reaction I'll take profits in UCO long and re-establish the position later, seeing its up another 2.15% today

+350% Return on ROI- just from a concept

If I could give you a winning trade or teach you what I know about concepts you can apply to your own trading style, while the guru thing is fun and often trade ideas make for great examples, I'd rather give you something you can apply for a lifetime. That's why I want to share this member's email with you from yesterday.

Tina has been with us for several years, she's learned the concepts about how the market uses Technical Analysis and your emotions against you, but especially Technical Analysis because technical traders are so predictable; it makes Wall Street's job easy and makes Wall Street more predictable if you understand what patterns they will manipulate.

As for the email from yesterday from Tina...

"SPY - Nailed It, Again!
So, about that SPY bear flag... great call and I profitted wildly  on an overnight weekly SPY put.

 I took it Friday after we failed to make a new high (weekly SPY 145 put)... I intended on selling EOD, but saw the bear flag and was expecting a break below as a shake out (learned that from you)... On Monday, we rode that lower trendline up, clinging to the line, so I was certain we'd break down on Tuesday, especially after your validating post stating the same... I waited it out and bingo!  ROI: 350%... Wow... stopped to calc it out... I use 3Cs to identify divergences, then I use RSI divergences for my entry/exits; I take the trade on the 10m.

Recognizing that bear flag and understanding it'd be used to trap shorts (I'm confident that's what happened today), the trade was nicely profitable."

This is what she was talking about...

The break below the bear flag of the SPY which locks in shorts, some will enter on the bear flag, but most because of what Technical Analysis teaches, will wait for confirmation or chase the trade.

The "Validating post", I believe was from Monday's Wrap (I believe or it may have been an intraday update) and referring to this chart and commentary...
This is from the post showing a 15 min SPY chart hugging the bottom of the bear flag and the commentary that followed this chart....

"it's always possible for a head fake move below the flag to get shorts to commit on confirmation of the flag as well as the channel."

I always love to hear about member's lessons or success stories, but I especially love to hear that member's are putting the concepts to work to profit in their own trading.

Congrats Tina and thanks for letting me share your trade.


Early Stop Run-AAPL > Friday's Close

After a 1% down day in the SPX, the early orders that are placed on limit/etc by retail that has a real job are bound to be sell/short orders, that's why early trade until about 10:00-10:30 has a lot of noise and manipulation.

It looks like the stops from yesterday's lows were run, but I'm not so sure this negative tone is going to keep up before the bounce, even if it smells like a dead cat, comes knocking (which I have a story to share with you coming up).

 AAPL's 10 min chart is in good position now for the volatility shakeout and AAPL is above Friday's close.

 QQQ stop runs this morning on a nice positive opening divergence

SPY also taken just below yesterday's close (first support) with a positive opening.


Tuesday, October 9, 2012

PCLN Follow Up / Trade / Add to / Risk Management

PCLN is one of the original 2012 core shorts (equity only, no leverage), others may have moved more including AAPL which saw a nice drop, BIDU was a great performer, but PCLN remains as a core short.

 PCLN was shorted at an average price of $761.79  putting it at a +18.89% profit. When PCLN dropped -17.28% in one day, I should have just closed the entire position and looked to reestablish it at higher levels like where we are now. In any case, there's room to add to PCLN (I don't recall, but I may have closed a partial position on that drop). I'm going to treat the PCLN add-to like a brand new position for risk management/position sizing.

The 4 day trend channel has in the past, held 1+ year trends in PCLN, it would have been stopped out of the long at the red arrow and the current short "Buy to Cover" using the same channel is $648.30.

I can add approximately $4k toPCLN so my risk including the profit already there is almost non-existient, but as a new position assuming a round $100k portfolio...

Typically I don't want to go over 15% of portfolio committed to any one trade, the days of Modern Portfolio Theory are long behind us. during the crash of 2000 in to 2001 you could have gone in to commodities and either hedged downside risk or you could have actually just been long commodities and made money while the rest of the market took a dive, these days however...

GONE!
 The market is more just "risk on" or "risk off" so I don't see a need for large diversity like the past if diversity serves no function.

The 15% general rule or about 6-7 positions, is really more for the one risk in the market that is difficult to account for, the gap.  Heck, take a look at the -17% gap down in PCLN in one day, with a 15% rule that would leave a loss of $2550 on portfolio value which is 2.5% of portfolio, a little more than the 2% rule I prefer, but still manageable.

I do have a tool for looking at gap risk, it's a custom screen in StockFinder specifically for gauging gap risk.

PCLN's biggest gap of the year up or down was 104.70 points, the day it fell it was 117 points, but that's as of the close, not the opening gap. It's pretty easy to figure out what the maximum reasonable risk is for PCLN, unfortunately pretty high at roughly 17% or about.

Looking at the Trend Channel as a stop the risk per share is $30.30 (stop at $648.30 and current price at $618= $30.30).

For a typical 2% rule, my risk money on a $100k portfolio would be $2000, divide that by the risk per share from the Trend Channel stop ($2000/$30.30=66 ) and you get 66 shares. However 66 shares of PCLN at the current price would be  $40,788 or nearly a 41% position size, way too much. A gap like we saw at that position size would have taken $7k or 7% in a single morning.

So the max risk is back at 15% of portfolio ($15,000/ $618=24.27 shares, you can round that to 24 or 25 obviously.

We still have the gap problem being bigger than 2% so in most cases my position size and risk would be figured out as above, but since we know PCLN is capable of these kinds of gaps, we'll use the $104.70 or roughly 17%. At $618 that's $105 per share, so $2000/$105 =19 shares which at $618 is $11,472 which is also below the 15% general rule, that's about the right position size for PCLN.

If we take out that extraordinary gap, most of the time the 2% rule is going to define risk so the closer you are to your stop, the more shares you can take on as long as you keep it at a reasonable level (for me that's 15%). This is one of the main advantages in being patient and letting the trade come to you, you get a better entry, you have lower risk and you can open  a position of optimal size.


Another Manufacturer Gets Hit & (Euro, USO, UCO)

AA beat but beat pretty low expectations, Cummings however did the worst thing possible and lowered guidance. Just like that song, "What have you done for me lately?", it's not about what you did, but what the market expects you will do and Cummings (CMI) said they expect to lay off 1500 people and lowers sales forecast by a billion dollars to $17 bn.

This is all part of a macro economic trend in the data if you just look past the headline number and read the bullet points of economic reports. Manufacturing has been in a slide for some time, at least since April and probably earlier, but seasonal adjustments masked the weakness.

CMI is down -4.23% in after hours. CAT is down -1.5% in sympathy.

Yet the Euro seems to be catching a little break from the downside.

The recent Euro intraday signals, the Euro has a positive correlation with the market including oil.

 It would be very interesting to see what USO (+2.83%) and UCO (+5.46%) could do on a weaker dollar as their performance today was nothing short os spectacular on a stronger dollar.

 Here you can see UCO's nearly 5.5% gain today came on dollar strength, which usually sends oil the opposite direction.

However the positive divergence in USO has been building all the way out to the 60 min chart as seen above, I'm not surprised it moved (That's why I opened the leveraged long UCO yesterday), I am surprised it moved so much with the $USD acting as strong headwinds.

AA Beats, the devil is still in the details

So after hours Alcoa kicked off earnings season with a top and bottom line beat above consensus. 

On the bright side, AA still stands behind their projection that aluminum demand will double between 2010 and 2020.

The company's CEO hit the nail on the head when he said to CNBC, 

"We see the aluminum market as fundamentally strong … but the market has forgotten the fundamentals and sentiment dominates the pricing" 

On the not so bright side,

2012 Global aluminum demand was cut by AA from 7% to 6%.

Excluding charges, shares earned $.03 vs a year ago at $.15.

Revenues were down 9% from a year ago.

As we have seen in one manufacturing report after another, the profit margins are disappearing, in many cases due to rising input costs of inflation; this was no different for A whose margin a year ago was 12.8%, this quarter, down to 4.8%.