Tuesday, October 16, 2012

MCP Update

MCP has been more of a patience position on the long side, not to the extreme of UNG or FB, but it does appear to be carving out a small base to move north from.

Here's the update, I still like what I see here.

 MCP's daily chart hasn't seen any damaging moves and has held up well recently in this tight triangle.

 Here's a dip below the triangle, but MCP pulls itself back up and seems to see accumulation in these areas.

The longer term 15 min chart in the base area

 The 3 min trend in the base area

 The 3 min chart showing positive divergences on dips below support.

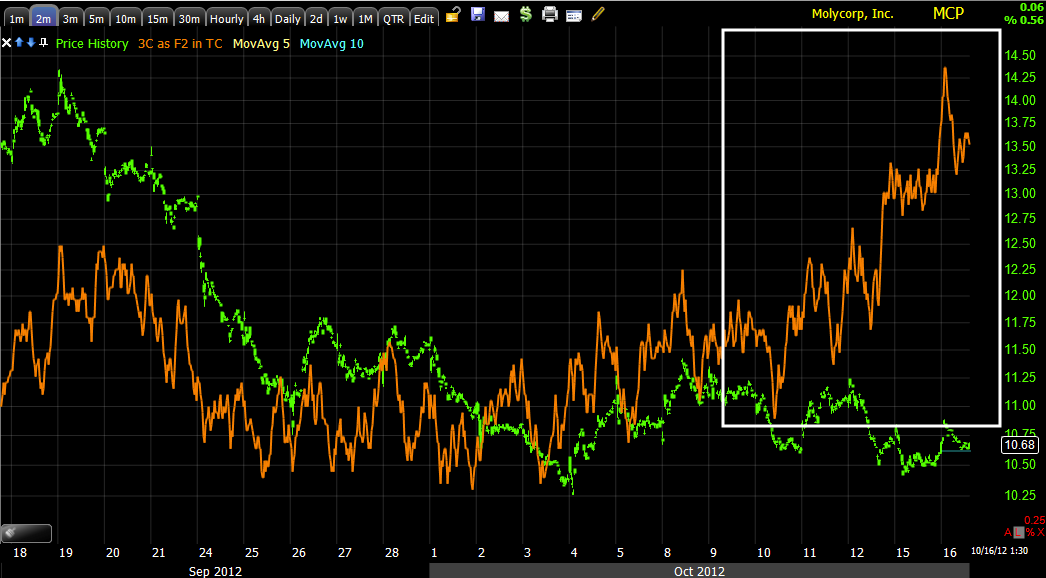
And the 2 min chart turning up recently, taken with the pinching triangle, I wouldn't be surprised to see a move or breakout soon. There is clear support so a head fake move before a breakout is always possible, but I don't know that MCP is attracting that much attention.

Selling AAPL $630's

I'm keeping the $645's for now, there is an intraday divergence in AAPL.


 AAPL 1 min negative divergence

The 30 min positive is very impressive.

I think in the very near term we get a pullback and I'll take some profits on that, I'll hold the $645 and see if this 30 min chart can get me there.

Market Update

That pullback that the market looks ready for is starting to manifest more in the charts, it could also be more of a consolidation. The QQQ by far looks the best, but that is also because AAPL looks very good right now as it is up over 2%.

 AAPL 3 min is perfectly in line and moving very well today.

 DIA 1 -3 min is negative intraday

 The IWM is also negative intraday

 QQQ 2 min looks much better, but there is some very small signs of a small relative negative divergence.

SPY 2 min is also showing the same negative divergence, although I would continue to stress these are intraday, small divergences, the bigger picture near term is more upside.

GLD Update

 GLD daily chart has seen breakouts above and below this narrow range which all have been head fake moves. From the charts, I believe GLD has greater downside probabilities than upside near term and would rather trade GLD short term using leverage when it is in good position for a short. All of the yellow boxes are head fake moves and the arrows are reversal signals both bullish and bearish.


 The GLD 10 min chart also shows the recent break above the range with a negative divergence sending it lower.

 The 15 min chart also shows the general deterioration as well as the negative divergences at the false breakouts. Note the divergence is getting worse in leading negative.


 The 4 hour chart shows a large positive divergence in 2011 that sent GLD higher, the divergence is now leading negative, it is not as big as the positive was, however it looks like GLD wants to pullback before making any serious attempts at moving higher, this is why I'd prefer to trade it nimbly.

 The 2 min chart shows the most recent breakout as well with the negative divergence, over the last several days a smaller positive divergence has developed with a bullish reversal candle from yesterday sending GLD higher today, this isn't a long I'd like to chase, but rather let it set up as a possible short.

On charts longer than 2 min, GLD is in line.


AAPL Update

I've had a lot of emails this morning for an AAPL update, AAPL is not so dissimilar from the other updates this a.m., approaching resistance, but still has longer term positive divergences that should drive it higher.

 AAPL's daily reversal signal...

 AAPL 5 min nearing resistance

 AAPL 1 min  is in line or actually even better with a leading positive divergence.

 AAPL 5 min is in a leading positive divergence, or in other words, it looks like AAPL is JUST getting started on this move higher.


 The 10 min chart is also leading positive as well as the 30 min below, there's a lot of strength there to move AAPL higher, in the VERY near term there's resistance coming up which may give us a little pullback or maybe just a consolidation, but AAPL definitely looks like it is just starting its run higher.


Euro and Australian Dollar

Very short term, more so in the Euro, 3C looks like it wants to pullback, this would be consistent with the market pulling back, although recently it (the market) has moved against the normal currency legacy arbitrage and the correlation hasn't been as strong.

The Australian Dollar /$AUD is more of a leading indicator, it too shows some near term or short timeframe signs of wanting to pullback, but still remains strong in the timeframes that would suggest the market moves higher as we have been seeing build over the last week.

Here are the charts...
EURO/FXE
 Very short term 2 min chart suggests a pullback from this move up.

 The 5 min chart suggests the same

 Longer term on a 30 min chart, which is about where we are seeing the positive divergences in the market, this is still in very good position for a move higher, likely to break above the recent range.

$AUD/FXA
 3 min $AUD also looks like it wants to pullback, perhaps intraday, but definitely short term, this isn't a serious trend.

 The 5 min chart is in better shape, it is in leading positive position, but still shows a small relative negative divergence for a pullback.

 The 10 min chart is in a very nice looking leading positive divergence which makes sense with what we see in the market averages and many stocks.

And the 15 min chart is also leading positive and should make a swing on the upside similar to the last swing we saw from the last positive divergence.

Looking at the currency pairs themselves, the above makes sense.


 EUR/USD is a little extended from the trendline, it did find support at $1.29

 The longer term view shows some resistance coming up, so a small pullback here would make sense.


The AUD is also approaching a resistance area so a short term pullback wold make some sense here, a breakout above would certainly help the market move higher.

Opening Indications

So far the opening indications are all strong, there's confirmation on all of the major averages. The only hint of an intraday pullback thus far is on the intraday futures charts, this shouldn't effect the bigger picture, but may give you a chance to add to some longs that you may like.

 DIA confirmation

 IWM confirmation

 QQQ Confirmation

SPY confirmation

 ES/SPX Futures with the European open at the far left (3 a.m.)

NASDAQ futures (1 min) with an intraday, small negative divergence, this is just normal a.m. and intraday trade action.

FAS/Financials

FAS (3x Financial Bull ETF) was mentioned as a trade yesterday and last Friday, this morning FAS is up 1.8% and off to a good looking start.

 FAS is more than confirming, it is still in a leading positive divergence even with the gap up this morning.

The Trend Channel has held decent swing moves in FAS before, if you want to consider that for a stop, the $110 level would be the current stop, but this will move up by the hour, feel free to email me for current stops

ERX Update

Energy and ERX were posted about yesterday under, "Holding ERX (long)" , this morning ERX is up +2.75% and XLE +.85%

There should be plenty more upside in ERX and XLE in the days ahead.

 We may see some gap filling, but this leading positive divergence on a short timeframe with longer timeframes positive is a signal that Energy is coming back in to rotation.

The 15 min leading positive divergence in ERX should pull ERX at least to the top of the range, I suspect even higher.

ES Futures

ES overnight didn't pullback, but at the European open, consolidated for a bit. There always seems to be a swing on the US open so we'll see how that develops, but those 30 min futures charts are very strong and should be the engine that drives more upside in the days ahead.

3 a.m., the European open right through the US open.