Thursday, January 31, 2013

Something Big Just Happened

I even turned on CNBC to see what it was, I don't know so if you know, email me.

The TICK chart went from +250 to -1100 in 3 minutes, a major move in stocks selling, it has remained very volatile.

I'll bring you more when I have it.

Movement?

The Q's just crossed the 50 bar 5 min chart, so this might be the momentum they need to get going. The intraday positives are still there.

Market Update:Leading Indicators

So far the QQQ weekly Call position that expires tomorrow is up over 10%, not a big gain for what the weeklies can do, but in such a low ATR environment and a fairly quiet day so far, if you have solid signals, why not make some money with them?

Leading Indicators for the most part seem to be taking a bit of a breather, there's no improvement in them, some are even worse, but as I showed you with the ES 5 min chart, a little bounce and some increased volatility is to be expected here after yesterday. I'm not calling out a bunch of short entries/add to positions right now because I think they can be had at better prices, but I am keeping an eye out for any that look ready to go now.

Here are the updated charts...
 The Euro vs the SPX hasn't seen any real momentum the last 2 days, that's a bit out of character for the FX pair so this may be close to a move/reversal.

 EUR/USD 5 min, still not much movement, if the market is going to see some upside then it would make sense that the EUR breaks above this most recent range before it reverses to the downside, volatility should start picking up.

 FCT which has been a goos leading indicator for us has put in more downside today vs the SPX.

 High Yield Corp. Credit is not looking any better, but seems to be taking a pause.

 The same is true of Junk Credit.

As for the trend in the market, it's kind of clear to see on the TICK chart, the early action was negative and the afternoon action is more positive so the BIDU calls and QQQ calls should make a little money which is good.

Other than that, I'll just be watching for anything sneaky cropping up or some opportunities.

The Danger and Profits of Biotechs

I get on average 50-75 emails a day from members, I try to work with individuals and many long term members I know pretty well so I know their habits, the kind of trades they like and it helps me help them.

One of my longest term members recently asked me about CLSN on January 22nd. This was my response...

"That recent top on 1/15 looks rally dangerous, that was real. Short term it looks to have a decent chance to add from here a bit, but I'd be really careful in the area of 1/15.

I might get some charts of it up."

Today CLSN announces...

" ThermoDox in combination with radiofrequency ablation (RFA) did not meet the primary endpoint of the Phase III HEAT Study in patients with hepatocellular carcinoma (HCC), also known as primary liver cancer."

These bio-techs are dangerous for more than 1 reason, I'll tell you more after the charts...
 If you have trouble believing there's hanky panky in the market still, take a look at this chart. 3C was confirming price action in green, running in to the 1/15 top, there was a fast change in character and it went from confirmation to distribution. The trials were announced today, but they likely didn't just end yesterday and those conducting them probably had a good idea of what was happening and how things were going.

I just published a story about a local man in my area giving out insider information on a bio-tech company for $35,000 and a new wood dock for his jet-skis, the recipients of the information made money, this guy is looking at 5 years in jail. Here's the price action today

A -80% 1-day drop.

Quickly let me just tell you one of my own experiences with a biotech. Back when all I did was trade full-time for a living, I had been doing some trading with my buddy DavidDT who many of you know. We were long some biotech that was due to get an FDA approval or denial letter the next morning, I can't recall the name, but it had closed around $10.

We were in the habit of posting sell orders higher than the close just to see if we could catch someone who wasn't paying attention and we could make a quick +10% in this case on another trader's mistake in after hours by not paying attention to the bid/ask and placing a market order when our ask was up.

David called me and had his ask set lower around $10.50, some people would set these at $.01 bid and $1000.00 ask which was crazy, we didn't go that far as a lot of those orders got cancelled if filled. David told me someone snapped up his shares and was flashing 5k share blocks on the bid in a smaller biotech in after hours, I lowered my ask to $10.75 or so on half the position and half my shares got hit  at that price, then I watched them take out a bunch of smaller 100 share blocks , I sold the other half a bit higher.

The trick here was the flashing of bigger buy blocks, but never filling them and hitting a bunch of smaller blocks so the after hours price jumped up by 10% or so which caught the attention of other traders who all thought there must be a leak out regarding the FDA letter that was positive so all these traders rush in and start buying like mad, volume shoots way up and the stock closes up for the session.

Th next morning the FDA letter is revealed, it wasn't an approval or a denial, but a letter saying they needed more tests/data and the stock was cut in half from the previous day's close.

What happened? That initial buyer who got our shares and was flashing big blocks on the ask and pulling them before they were filled was getting everyone's attention, everyone figured the fix was in, good news was coming and they were buying. The volume was huge so whoever bought our shares knew that night that the FDA letter would be a negative and they had to unload their position, so they created demand by buying some shares to get the price jacked up and traders thinking they had an inside line, those same traders who bought all the shares from this one big seller (initially the buyer) lost more than half their money the next morning.

AMZN Charts

I really like AMZN in the area as an add to short or as a new position, obviously in the near term I believe you can get AMZN as a short at better prices, but again it's myopic and semantics when put in to context of the bigger picture.

I know at least a few of you who already made +150% on weekly AMZN put options, they are usually a bit too risky for my taste, but I figured I'd see how they do as a day trade vehicle.

Personally for near term weekly puts, I'd be taking my profits as mentioned, here's why.


 The 1 min positive divergence which is leading should lead to a consolidation at the bare minimum and that kills volatility and profits in short term weeklies.

 However the 2 min is positive as well, AMZN should bounce at least today.

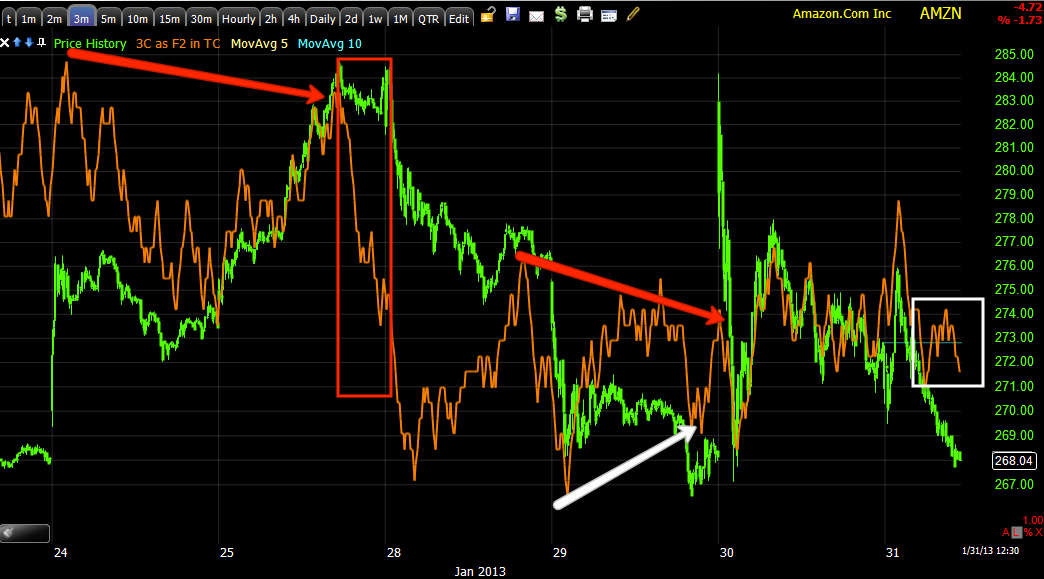
 The 3 min chart hasn't made up its mind, but I suspect it will turn positive.

 At 5 min there's nothing but trouble for AMZN, that's a really ugly leading negative divergence and one reason I think as an equity short, this is about the right area to enter AMZN.

 The 15 min chart as well

 And the 30 min chart with a sharp divergence at the local test of the highs.

On a 2 hour chart we have distribution around Aug/Sept. and then nearly a month of accumulation for the November 16th new up cycle, that has been being sold in to strength and now we have a serious leading negative divergence on a very long term chart, meaning very strong institutional activity.

For Those in AMZN Options

I know some of you are in weeklies and some monthlies, the weekly puts look to be in danger, personally I'd take the profit here. The monthly should be fine. I'll post charts for you next, I just wanted you to know ASAP.

QQQ Intraday Charts

Here are the charts for the intraday trade. There's no need for that kind of leverage, you could always use QLD or TQQQ long.

This is pretty much the opposite of everything I do with options, but I'm curious to see how it works out as a spec. trade.

 QQQ 1m

 QQQ 2m

QQQ 3m

I chose the Q's as they are the most developed so far

Trying Very Speculative Option Trade

QQQ long Feb 1 Calls @ $66, this is tomorrow's weekly expiration.

Day Trade +?

I now have enough momentum and positive 3C intraday signals that I would say a decent upside reversal is coming, it probably can be traded which would likely be an intraday trade, but maybe longer when considering the 5 min ES chart.

Consider it, there is an opportunity here right now.

About FB

Yesterday before earnings, I made clear two things, 1) I do like FB but at a certain price and it needs to have the support we have seen that have given us two great long trades while everyone else hated FB. The second was I would not be holding FB in to earnings. You may recall the earnings last night were not bad at all, but it's not about what you did, it's about what sentiment toward your future is.

Today FB is down around 3%. I'm trying to decide whether or not I would take FB on as a short position, I think it's not so much a matter of my opinion right now as it is the way the chart develops and whether or not it has a sufficiently high enough expectation of profits with low risk. At this moment I'd say no, that is not saying I think FB will be fine, that is saying there's a probability for lower prices, it just as of yet has not met my standard for a trade, but there's enough promise to keep an eye on it.

I'll show you where we are and where we need to be.

 This is a simple reason as to why I wouldn't hold FB in to earnings long.

 Here is the second base we found in FB, the first one we traded long was when EVERYONE hated FB soon after the IPO. I still believe this base offers more long term upside. Note the recent head fake move above resistance as well

 Here's the head fake move, this morning the stops were run so someone bought some FB cheap and will likely try to make a profit on the upside.

 I'd have a very hard time being short FB without the trend channel breaking, this is one of the main challenges. On the other hand if FB can consolidate, accumulate and hold the channel on a CLOSING basis, I might call this a new long.

 So far there seems to be distribution in to today's move higher in to the gap.

 This 5 min chart would also need to turn down significantly, hopefully with FB price higher (as a short trade).

 The 60 min chart has some work to do to recover, all longs should have been out by this first major divergence in red (around price), there's simply no reason to risk it with those odds against you.

Ultimately since there's so much damage on the 60 min chart, I'd be prepared most likely to call FB a short if the charts from 5 to 15 min can go clearly negative and hopefully in to higher prices.

We will also watch FB for any signs of improvement and as a long. I don't care which way we trade it, as long as we are on the right side of the trade. For those that made money on the long trade and I know there are quite a few as we went through that base accumulating at low levels, congratulations, you see that patience pays.