I really like AMZN in the area as an add to short or as a new position, obviously in the near term I believe you can get AMZN as a short at better prices, but again it's myopic and semantics when put in to context of the bigger picture.
I know at least a few of you who already made +150% on weekly AMZN put options, they are usually a bit too risky for my taste, but I figured I'd see how they do as a day trade vehicle.
Personally for near term weekly puts, I'd be taking my profits as mentioned, here's why.
The 1 min positive divergence which is leading should lead to a consolidation at the bare minimum and that kills volatility and profits in short term weeklies.
However the 2 min is positive as well, AMZN should bounce at least today.
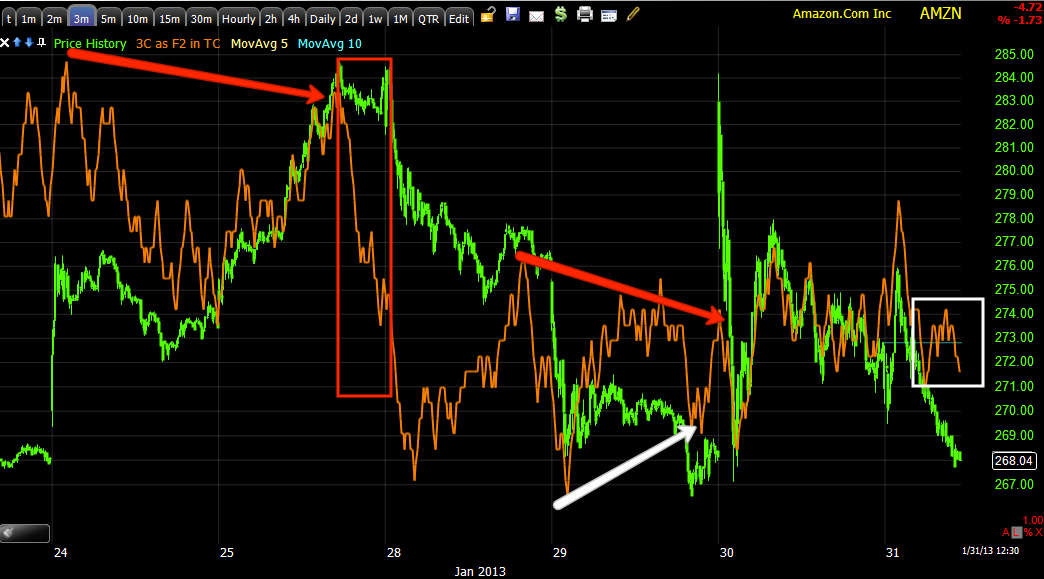
The 3 min chart hasn't made up its mind, but I suspect it will turn positive.
At 5 min there's nothing but trouble for AMZN, that's a really ugly leading negative divergence and one reason I think as an equity short, this is about the right area to enter AMZN.
The 15 min chart as well
And the 30 min chart with a sharp divergence at the local test of the highs.
On a 2 hour chart we have distribution around Aug/Sept. and then nearly a month of accumulation for the November 16th new up cycle, that has been being sold in to strength and now we have a serious leading negative divergence on a very long term chart, meaning very strong institutional activity.


No comments:
Post a Comment