Tuesday, April 2, 2013

Futures Update

While the 1 min charts are pretty shotout at this point, the 5 min charts are still within the area that is generally positive, the 5 min charts aren't really close at all at this point to the 5 min signals that we have used to go short using weekly options.

As for currencies, the USD/JPY carry cost that fell dramatically overnight to lift futures is now starting to turn the other way. The EUR/USD could offer some support to the market short term, it looks better, but still not quite there.

 USD/JPY headed higher all night and early morning lifting futures, around 11:30 the pair lost upside momentum and most market averages stalled out on the upside at the same time.

 The EUR/USD 1 min is still making moves toward more and more powerful positive divergences.

 ES 1 min has been largely negative, but is showing a faint positive divergence now.

 ES 5 min  is still in line

 NQ 1 min is clearly negative intraday

 The 5 min NQ chart is still in line

TF 1 min is now in line after being quite negative all day


TF 5 min is a little better than in line currently.

Market Update / QQQ and Especially IWM Looks Good / EUR/USD

The IWM hasn't made much of a move, considering it was yesterday's biggest loser and that it had the most bullish Price/Volume relationship among the component stocks.


Here's a look at the 3C charts for all the averages thus far, the IWM still looks very good short term, as if it could take off any minute, even today.

I promised a member I'd get a chart of the EUR/USD out, it could be supportive of the market if the positive divergences that are developing can take off to the upside. If I have time I'll look at the single currency EUr and $USD futures to see if they offer any more clues.


 DIA 1 min is intraday negative, yesterday's double bottom area near the close has nice accumulation as I pointed out yesterday.

 The 2 min chart is leading negative, it seems the DOW which has been the best relative performer the last few days in total, may be losing some of its shine.

 That leading negative 2 min chart is starting to migrate to the 3 min timeframe.

 The 10 min chart is roughly in line with a slight intraday negative divergence today .

 Longer term the 15 min doesn't look good.

 The 30 min doesn't look that good either-this is part of the longer term rot.

 IWM 1 min  looks good, it's in line.

 IWM 1 min longer term is leading positive.

 IWM 2 min has a very positive demeanor and none of it has been distributed yet.

 IWM 5 min also has a positive demeanor.

 Even the 15 min is leading positive today, compare to the DIA 15 min.

 The longer term "Rot" I've been talking about is very clear here on this 60 min chart, the most important of the timeframes here, a very nasty leading negative divergence.


 QQQ 1 min was showing some weakness in the intraday chart earlier, that is looking stronger now, similar to the IWM.

 QQQ 2 min is still looking bad as the 1 min chart's negative posture earlier migrated to longer intraday timeframes, but the 1 min positive divergence in place now is so new it hasn't migrated to longer timeframes yet.

 QQQ 3 min leading negative

 QQQ 5 min leading negative-not as bad as the 3 min though, I assume the 3 min migrated to the 5 min and that's why it doesn't look as bad as the 1 min has halted the negative movement.

 QQQ 10 min either positive as of last week or in line at the green arrows.

 QQQ 30 min is where the leading negative disposition is seen, this is the longer term rot under the thin shiny veneer or facade.

 The SPY 1 min intraday doesn't look very good as it is leading negative as price is range bound. If there's not improvement soon, the SPY stands a good chance of seeing a sudden, sharp intraday break to the down side.

 SPY 2 min leading negative-this doesn't help.

 SPY 5 min positive at the EOD yesterday and close to in line, but not quite there as it has a negative demeanor.

SPY 30 min is clearly negative.

Still the charts are along the lines of short term positive or at least a few of the averages look like they still are yet to take off-the SPY and DOW look like they have spent some fuel on the upside, the IWM looks like it's just waiting.


Quick Market Update

All of the futures as well as the averages have negative intraday divergences, they should all pullback from here.

GOOG $800 Weekly Call Position Closed Out


The remaining 5 contracts were closed at a fill of $14.50 for a  61% gain for a $2750 profit on this half with a 46+% gain on the first half with a $2150 profit for a $4900 profit on a $9,000 position for a 55% profit.


This puts the options tracking portfolio in 3rd place of 599  portfolios to put us in the top 0.5%or half of 1%. 


This is the reason for closing the GOOG position, I may consider adding a new position on a pullback if the longer term 15 min/30 min charts still look good, however the main trade here is on the short side and I'm just looking for the best positioning for that trade.

Closing out remaining GOOG $800 calls (expiration this Friday)

GOOG Update

Currently we have a longer term GOOG equity short, GOOG April (monthly) $810 Puts and GOOG weekly (this Friday) calls.

The calls are in the money, the Puts aren't that far off and should be fine. So you can probably tell by the positioning the analysis for GOOG expected a short term bounce and a longer term decline. Here's a full update.

 60 min chart, the yellow trendlines are head fake moves, the first below the first obvious support where  stops are bound to congregate as you can see by the volume spike they were hit, the second area is below support from mid-March, again stops were hit there, not as many. As price moved up on the failed breakdown (stop run) we see green volume pick up.

 On a daily chart here's a simpler view of the head fake move, which is something expected after many GOOG updates in MArch for both the long and short positions. Today's price action fulfills the head fake move or the failed break down which shorts will pick up on as a swing trade at minimum.

 Our longer term analysis using my custom DeMark inspired indicator (Can someone PLEASE come up with a name for this indicator?) shows the 2009 lows buy zone, 2010 sell at the highs, 2012 sell @ the highs (remember this is a 9-day chart, each bar= 9 days) and finally recent action is giving a sell signal as well.

 My cutom X-Over Screen to avoid false cross-over signals by using the typical price crossover, a custom indicator in the middle and RSI at the bottom, all 3 have to agree for a signal. We are VERY close to a short signal as the custom indicator in the middle is the only one that hasn't actually crossed under yet, but it's as close as can be without the X-over.

As for the call position, the 1 min intraday 3C chart is going negative in the area after a nice positive yesterday with the rest of the market on that double bottom move below support to hit the stops as discussed yesterday and last night.

The 2 min chart is still in line, but it's caught between a 1 and 3 min negative divergence intraday and you know how I don't want to stick around once momentum starts to fade.

Actually looking at GOOG right now, it looks like we got out at the perfect spot as momentum is fading.

The 5 min chart is leading positive, so half the position stayed open, but the expiration this Friday has me a bit nervous.

A closer look at the 5 min chart.

The 10 min is also leading positive

As well as the 15 min chart
And the 30 min is leading positive, this is the reason I left half the position open the 5, 10, 15 and 30 min all leading positive.

The longer term 60 min which is where the longer term probabilities are highest (thus the equity short) is leading negative


The Daily chart is also in a deep, long term leading negative divergence. The idea here was to play the short term bounce (initially I didn't want to, but then the charts improved) and ride it up and then add to the put position and the equity short if you like the trade, or if you already have a partial position started.

GOOG Call Fill

Here's the fill as well as the reasoning behind it...


 Closed half of this position, paid $9.00 and filled at $13.21 for a 46.7% gain.

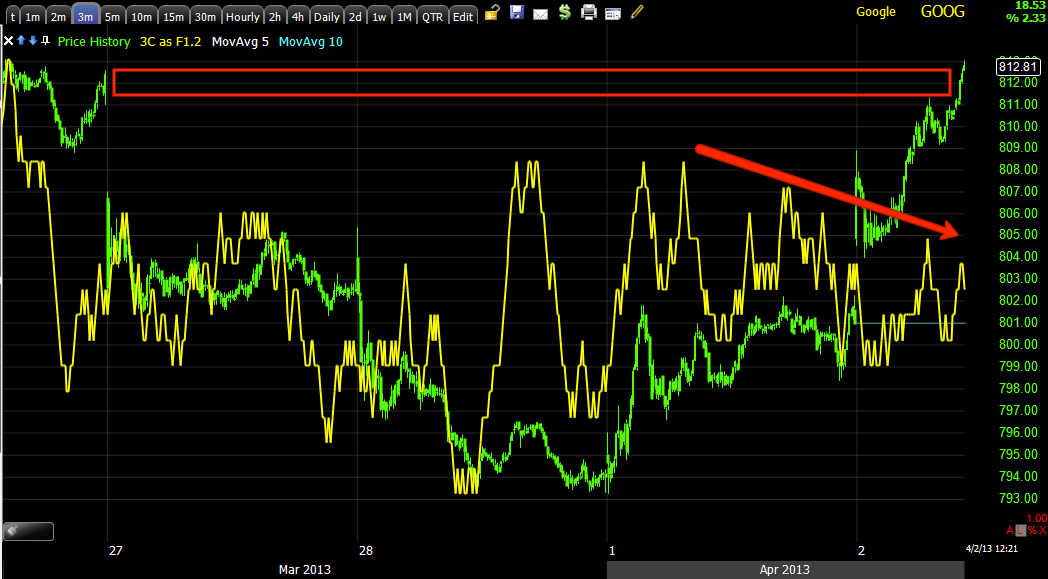
 The intraday 3 min chart has a negative divergence, this is intraday, but it also looks a little thin in price action after a nice move and in an area of some overhead resistance.

 The 1 min chart still looks good, but because of that 3 min, I feel a divergence in the 1 min will be worse than normal so while there's good momentum it looks like a decent area to take some off the table.

I chose to leave half on the table, although the expiration this Friday makes me a bit nervous, because this 15 min 3C chart is still leading positive.

I have a full GOOG update coming next as we have other positions open here.

Closing Half of the GOOG $800 Weekly Calls (expiration this Friday)

Again this is a momentum thing as we are running in to some resistance, but still have some decent looking longer term charts.

Taking some off the table here makes sense if it is worth it for you (meaning the position size won't be negatively impacted by transaction costs).

Same Fill @ $1.40

That makes the entire position a +38.6% gain for a day, not too bad.

This is why I'd rather be safe than sorry and possibly add a new position on a pullback...
Even though price in the Q's is higher than the earlier closure of the first half of the position, because momentum is less, the fill came out to be the same. This 3 min chart and the look of the Q's looks to me like a pullback, the 1 min NQ futures are pretty divergent as well, although the NQ 5 min chart doesn't look bad.


Closing the rest of yesterday's QQQ $68 Calls

I may look to re-establish a position after a pullback.