Tuesday, April 9, 2013

AGQ / SLV / GLD Follow Up

I still have pretty high hopes for a GLD and SLV trade on the long side, I think the base needed is still there, but I didn't see the reason in watching these two deteriorate and just waiting there for the stop to be hit when they made a decent amount in the few days they were open (Friday)


At the fill, this came out to be about a +8% gain on the ETF for 2.5 days. I would have much rather held it and hope to again soon.

 SLV 1 min

 3 min

 The divergence went as far as 15 min so I figured it's a pretty decent one.

GLD
 1 min

 2 min

 3 min

And out to the 10 min so again, it seems like it was more than just intraday selling.

Closing the Rest Of the IWM $91 Weekly Call This Week expiration

Going to take AGQ Long off

I'm going to close the AGQ long, maybe re-open at lower levels if possible, if I had long GLD positions I'd take them off as well, I feel there will be at least a decent pullback.

Other Averages: SPY, DIA, IWM

So far my favorite among the averages is the Q's for a quick Put position, however among the 5 min futures it's ES/SPY and TF/IWM, perhaps that will sort itself out. The DIA has been the strongest of the averages for almost a week now.

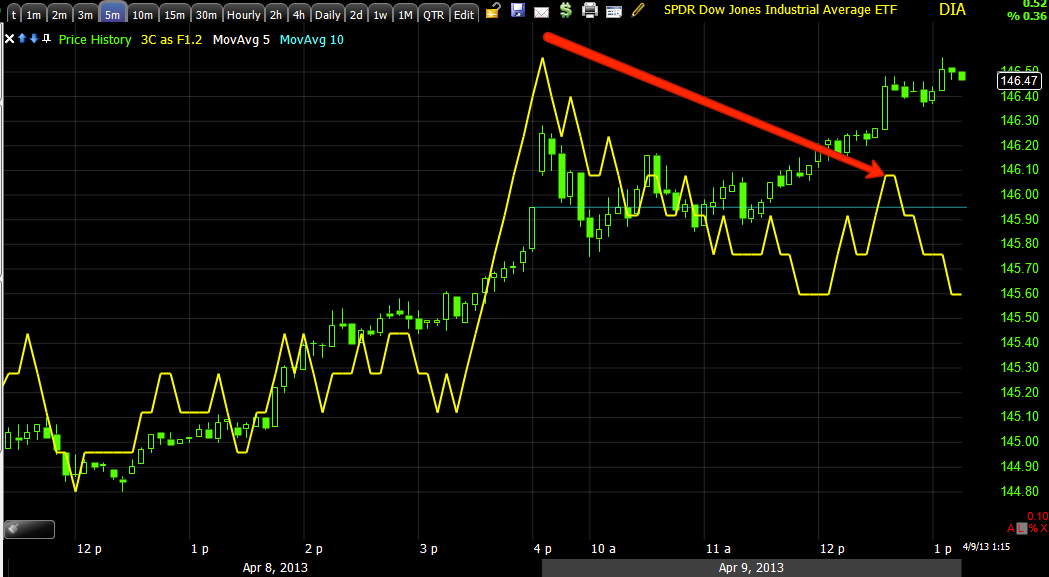
DIA
 1 min Leading negative


 3 min leading negative

 5 min leading negative

IWM
 1 min leading negative pretty bad

 1 min intraday

 2 min leading negative

 3 min leading negative pretty bad

 5 min leading negative very bad

 10 min shows the strength from last week and why we were expecting more to build before the algos ran the market up, there's still most likely a decent base there, but we'll have to look at everything with new eyes.

The 10 min here is totally flat so it's lading negative the last 2.5 days

SPY
 1 min leading negative

 2 min leading negative and pretty bad as this is intraday

 2 min with some context, leading negative

 3 min leading negative-all are worse in to today, as I said yesterday, I don't trust this move.

 SPY 5 min

The 10/15 min charts that were so strong last week, the reason we too out some long positions, but again these will have to be viewed from a fresh perspective on a move down.


There goes AAPL making its move

QQQ Update

I'll get the other averages out in the next update, but a lot of the concepts are the same.

By the way, the R2K Futures (TF) also now have an intraday 1 min negative, not as bad as NQ, but it's there and that was one of the stronger positives.

 QQQ 1 min leading negative, because yesterday was algo dominated, there wasn't accumulation, it was buying, selling, buying lower, selling higher, it wasn't true positioning.

 Here's the same QQQ 1 min chart on an intraday basis, you can see why it has made the moves it has, but you can't ignore that oin context it is leading negative (above this chart)

 2 min also leading negative

 3 min also leading negative

 5 min leading negative

And 10 min where no accumulation-positive divergence was added at all on the institutional timeframes of 5 and 10 min, this is a large negative divergence considering price movement.

Went With QQQ Weekly PUT / expiration 4/12 / Strike $69

Going to open half of Spec Position in QQQ weekly Put

Expiration this Friday, not sure of the strike.

The NQ intraday futures, as I said, can change fast.

This intraday chart is now leading negative.

To me this is worth the risk of half of a spec position, I'd like to fill out the other half, but will wait for further confirmation

AAPL is showing improvement

 There's improvement on the 2 min chart above

And the 5 min chart.

The 10 and 15 min already looked good.

I don't see much improvement on the 1 or 3 min, which if anything suggests AAPL may make a move to join the market, but is not necessarily ready for the move I'd like to get involved with.

I'll keep an eye on it, but for now, I personally will stay away. I think if you were very nimble and had time to watch it very closely, there's probably going to be an intraday tun to the upside.

Futures

I'm going to keep the futures and the market average posts separate so I can get them out faster. First I'm going t show you why I am considering the Put in one of the major averages and then why I'm waiting for the right moment or signal.

 NQ (NASDAQ Futures) and divergences on the 5 min charts have been productive for 1-day weekly calls or puts, the negative divergence here is pretty bad.

 TF (Russell 2000) 5 min chart has a nice negative divergence.


 And ES 5 min (SPX Futures) have a very nice negative divergence as well.

Now what has held my hand back...

 NQ 1 min has some positive intraday divergences suggesting higher prices intraday, plus after looking at the leading indicators, I'd like to really see strong negative signals short term and in leading indicators.

 TF 1 min has a very strong intraday positive divergence and has already moved significantly off the lows.

And ES has a positive looking 1 min 3C chart and is in confirmation with 3C at new intraday highs, these can change pretty quick so I'll be watching them, but also leading indicators.