Wednesday, April 17, 2013

TICK

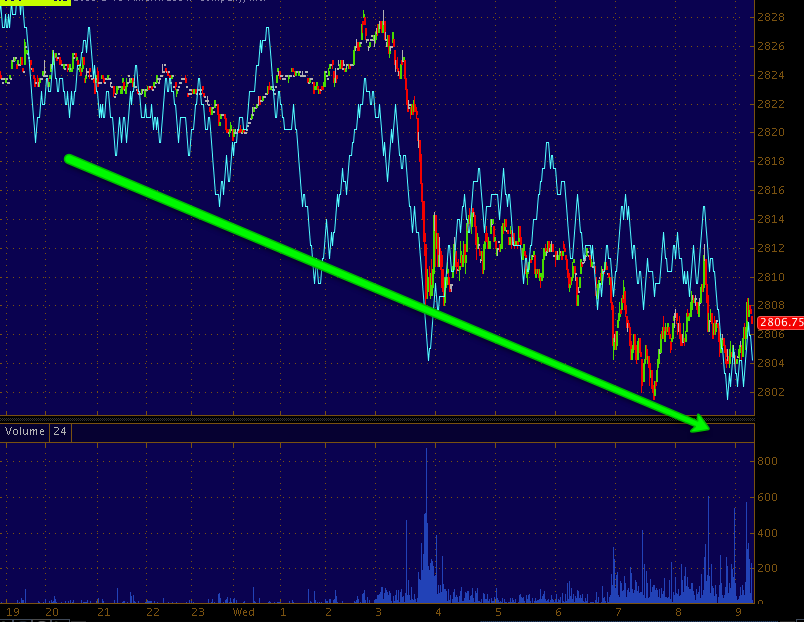
The TICK suggests the market is going to back off a bit intraday, this is where I'd prefer to open positions, in to price weakness.

This is a great tool for these situations, draw trendlines on the channel moving with the market and a divergence and break of that channel is usually an early head's up that the market averages are going to move down intraday or up if the break up wards from a downward sloping channel

Market Moving Much Faster Now

Since we are in the location I expected, a lot of things are happening very fast the $USD is showing 3C negative divergences, the Euro is showing positive divergences, the Index futures are showing at least 1 min positives that are building and some 5 min in some classes like NASDAQ futures.

I will probably start looking for some short term Call positions (longs) with an expiration probably in to May, although I think weeklies can work (although I;d prefer an expiration past this Friday), I'd rather have more quality, more time and slightly in the money on calls.

As far as 3C on the averages (QQQ, IWM, SPY, DIA), right now I prefer IWM and IWM should lead.

I'll probably open an IWM call position very soon, I'd rather open it in to some price weakness, but I don't have the luxury of watching for that, I'll likely leave room to add in case I do have time and find a lower price and I'd prefer to phase in to this position as we wait to see continued strength build in the 3C divergences.

I'll let you know ASAP before any positions are opened. If you don't trade options, then leveraged ETF, whether 2x or 3x will work as well like UPRO, TQQQ, URTY, etc.


Volatility

I think  we are pretty close to our destination, we still want to see some lateral trade and accumulation build, but the moves in volatility and overall in some risk assets suggest we are at our "W" area.

First Volatility and you may recall last week we had positive price behavior in the VXX Thursday as well as positive divergences and that was an area we talked about VXX or UVXY long trades. Now we seem to be in the area in which you probably definitely want to look at closing those out for short term trades, longer term trades is too complicated for this post considering the assets.

 SPY arbitrage (30 min delayed) being red right now would mean assets like VXX would not be in play to manipulated the market higher, in that case VXX we would expect VXX to be a bit higher.

 VXX 1 min 3C chart shows a relative negative divergence so I do think this is the area distribution of the VXX long trade is occurring, the longer charts aren;t there yet so I think we could get another move toward the highs or some sort of consolidation like a triangle or a flag intraday in the area.

 This 2 min chart is in line so it's not seeing the migration of the 1 min chart's negative divergence, I would expect that to happen as we move forward though and on any market move higher, VXX/UVXY should head lower (again the nature of the trade is shorter term, maybe a couple of days, but it's usually longer than reason would suggest) so VXX short or UVXY short would be the play or XIV long.

 VXX 5 min intraday is not seeing a negative divergence at all so again the negative has to migrate across those timeframes to prove its building strength.

 On a relative basis, yes we have a relative negative divergence overall and that helps to increase the probabilities of our market bounce, as far as timing though, we want to see the intraday charts like the one above this one start to go negative as well and they'll have to move higher or consolidate for that to happen.

CONTEXT Model for ES (SPX futures)

Remember this was at the largest negative differential I have ever seen just before Monday's drop, it was a 40+ point ES negative differential in the model, as I showed (I believe yesterday), the move in ES was almost exactly the same as the ES model's negative differential. The fact the ES model is going positive here suggests risk assets are improving, (interest-rates and curves, credit risk, FX carry, commodities, and precious metals) and other assets in the Context model.

I may be a bit slower on emails from here on out because I need to really pay attention to what's going on and post it for all of you.

Quick Market Update

We have a little bounce in the market right now, this looks to be nothing more than an intraday correction, but specifically triggered off a short term head fake move as the averages crossed below support of the 4/15 lows, essentially drawing in new shorts who are being squeezed right now.

There's 1 min intraday confirmation of the divergence, but it doesn't moves past that so it's nothing I would trade.

The SPY 1 min chart shows a relative and slight intraday leading positive divergence as those lows were broken, so it's essentially a small head fake move.

Here's the run below support drawing in new shorts and they are being squeezed intraday right now.

However what we do want to start watching for is some lateral trade in the area and building positive divergences in the area as we are now in the area of the "W" and it did what I mentioned in an earlier post and ran below support on a head fake move.

GDX Update

I have been asked about GDX Gold Miners) several times and whether it is showing any positive divergences in to weakness.

I figured I'd just update GDX all around.
 This is a 5-day chart (each bar=5-days) of GDX. You can see a H&S top, if you put a cumulative volume indicator like the one I use (the code is V+V1 in a cumulative indicator) you can see volume isn't perfect, but does a pretty good job of confirming the price pattern, especially on the right side from the decline of the head to the right shoulder.

The implied price pattern target is around $15, about the level of the 2008 lows.

 This is the Trend Channel on the decline of the right shoulder, it has held the trend perfectly without a single stop out, but notice the increased ROC on the downside recently as well as the 4-day ATR rising significantly, that's a change in character, changes in character lead to changes in trend, that can be good or bad, as in a bounce or an increased rate of decline.

 On a daily chart we do have a recent gap and a large volume spike that looks like short term capitulation, the market has been relentless about filling gaps since HFTs have become more dominant so I wouldn't be surprised to see a gap fill and that is probably about the right size move for the bounce that I would expect for a "W" bottom in the market.

 The 2-day 3C chart of the H&S pattern is typical, we see strong accumulation of the 2008 lows with a leading positive divergence on a multi-day chart and almost immediate distribution of those shares in to higher prices. The decline has been in line (3C/Price trend confirmation) at the green arrow.

 On a 60 min chart you can see some accumulation around the neckline of the H&S or support and distribution in to the right shoulder and 3C is in line since on the downtrend, there seems to be a possible 3C divergence, but this is a 60 min chart so 3C lags a bit and take s a little time to catch up so I looked at faster timeframes.

 The 30 min chart shows no divergence and it would be more defined here if there was one so I don't think we have any positive divergence, at least not that strong.

 Even the 5 min chart is in line with price action.

 At the 3 min chart there's a possible longer term relative divergence

Zoomed in on the 3 min chart and it is acting as you'd expect, we have a head fake/false breakout at the yellow arrow/box with 3C leading negative on the breakout confirming a head fake move and in line since.

I personally would not trade this even if I think the probability of a gap fill is strong unless we had a more decisive positive divergence to point to, it may still come, there's time, but it's not there yet.

So the probabilities of a gap fill in my view are not the same as a high probability/low risk trade, at least as of the information we have right now. We can check it later to see if anything has changed.

FX Moves

This is the move that just sent the averages lower, but as mentioned in the first post today...
We are looking for at least the "W" bottom so the move is not surprising. A "W" bottom is the minimum we need for stability to place some short term long trades, there's always the chance that a "W" turns in to a series of then which would be a trading range, but judging from the mid term and longer term 3C charts, I don't think this market can hold up that long.

So none of this should be surprising, but here are the FX moves that caused it, I don't know yet if there was any news as a catalyst, but it doesn't really matter, the currencies were going to make these moves and so were the markets.

The $USDX ($US Dollar Index) 1 and 5 min futures...

 $USD has been moving up all night, this actually starts just after the close yesterday when the currency post telling us to expect this move was posted. Remember strength in the $USD puts downward pressure on the market and risk assets like commodities and precious metals. This very recent spike is what's causing the weakness in the market this morning.

 Here's the 5 min chart, the red is when the Futures post written late Monday night/early Tuesday a.m. was posted telling us to expect Dollar downside (which is market supportive which we saw yesterday) and at the white area is yesterday's after market post telling us to expect dollar strength (market negative).

The Euro (moves the mirror opposite generally against the $USD and has the opposite effect on the market)
 1 min Euro futures shot down this morning around the open, that puts negative pressure on risk assets/the market.

5 min Euro futures showing the same areas with the same posts mentioned above and you can see how the Euro has lost quite a bit of ground this morning, pressuring the market.

One quick word about "W" bottoms or what some might call a double bottom (very small one) is they don't act like they use to, which is to say the second bottom usually fell short of the low of the first bottom, Technical Analysis expects that or market support at the first bottom's low, so we generally see a head fake move below support, trapping technical traders and giving us a great entry at great prices and lower risk.

Quick Market Update

We should see some lower prices in the averages, the same thing that moved futures overnight is moving regular hours trade, the dollar just spiked higher and the Euro spiked lower. I'll bring you the charts, but this is what we have been expecting today (directionally) to get to the bottom of the "W" or the second bottom.

Precious Metals Futures, Gold (YG) and Silver (SI)

Since the movement in currencies (specifically The Euro and $AUD moving up is supportive of risk assets and the $USD and Yen moving up pressures risk assets) it's not surprising that Gold and Silver are behaving in a way that is very similar to Index futures or the Market averages, as I wrote about the change this weekend because I felt it was a very important dynamic that would define trade moving forward (more so than it has in the past).

We all know Gold and Silver have taken extraordinary plunges recently, there are a lot of potential causes, I believe chief among them is the collapse and therefore margin maintenance required in the Japanese JGB (bond) market, which isn't a big deal to most of us, but for institutional traders, it's a huge, very liquid market and they also tend to be the ones who have good profits in Gold any way over the last several years so it's a good place to come up with additional margin money.

Here's Gold and Silver Futures (and just to be honest, so far we have almost everything we have been looking for, it looks good for a high probability/low risk trade, but we still need 1 more thing which we should see today-accumulation of either price decline or consolidation).

SI (Silver Futures)
 SI 15 min 3C chart (remember the longer the timeframe, the stronger the signals of underlying trade). After the collapse and in to the lows of Silver for the week we see a 3C relative positive divergence (white arrow) that moved to a leading positive divergence which is stronger (white box) since. This has the look of the start of a "W" base, but it may consolidate sideways, I would think some downdraft would be more likely, but accumulation is most often seen in either prices moving down or a steady lateral trading range.


 Silver 5 min chart offers more detail, the signals are not quite as strong, the trend is not quite as defined, but it gives us better near term signals. We have the same thing on the accumulation side, a relative, then leading positive divergence, it does look like there's a relative negative divergence or some distribution, although not too heavy compared to the accumulation, it could be just enough to bring prices down, we'll check the regular market assets after morning trade has settled in a bit.

The 1 min chart is pretty much since the close yesterday of normal market hours through over night to the present. Mostly we have seen 3C in line with price with several corrections, there's a small negative divergence currently so this may bring prices down. We'll check SLV shortly to see if we have confirmation. If so, then we'll be looking for accumulation in to lower prices and an area where we might go long for a trade (whether options, leveraged ETF, something else or no trade, will depend on the signals we get today).


YG (Gold Futures)
 YG 15 min chart shows the same 3C signals as silver, accumulation.

 TG 5 min essentially shows the same theme as silver futures, currently a negative divergence suggesting intraday prices move lower, although they may consolidate laterally at some point.

The intraday 1 min chart since yesterday afternoon and overnight shows 3C negative divergences or distribution, on this timeframe the signals and underlying trade are nowhere near as strong as the 5 or 15 min chart so the negative divergences would be more to turn Gold down than to actually distribute shares for the purpose of unloading, it would be more like a course correction.

We'll look to confirm in GLD as morning trade settles (as there are a lot of games in a.m. trade-stop hunting, limit order runs, etc).

Index Futures

If you take last night's End of Day Currency post which explains the currencies futures post from the night before and where we stood last night moving forward in to today and have just a basic understanding of what we expected Monday night/early Tuesday morning and in the same post what 3C was telling us about today in the signals it was giving on currencies last night before they even moved and you recall that we were looking for a "W" bottom shortly after Monday's destruction, then the 5 min Index Futures charts will make PERFECT sense and so should our strategy moving forward.


First Russell 200 futures (TF) because they show it best...
 TF 1 min which is our intraday movement, since last night's currencies futures post shortly after the market closed, currencies moved exactly as 3C signals said they would which moved Index futures the way we thought they'd move, down. The green arrow is 3C/Price trend confirmation, it's still in pretty good confirmation with a slight positive divergence in to the open.

 TF 5 min chart coming off Monday's destruction to the left shows heavy distribution Monday with accumulation in to the first bottom of our "W" right where we want to see it, the bounce yesterday with light distribution at the top and a move lower that is in line with the price trend, we will be looking for accumulation at the second bottom of the "W" base today.

The other Index averages are essentially exactly the same.

ES-SPX futures
 1 min intraday-overnight/premarket action in line.

 5 min is the same as TF and in line this morning

NQ -NASDAQ 100 futures
 1 min intraday overnight to present is perfectly in line with the price trend

And the5 min char is a bit less developed, but should get there.

Our "W" Base

You probably recall me using the phrase "W"-like base a lot over the last day or two, that's what we are looking for so we can trade a short term bottom with high probabilities and low risk.

Last night I posted something I thought was pretty incredible, in fact the post was, "Incredible-Last Night's Post in Currencies Called Today's Moves in FX and (equity) Markets PERFECTLY!"

I guess I shouldn't be surprised being I spent 10 hours writing these two posts over the weekend that said the markets were going to be moving because of that exact reason, CURRENCIES.

A Currency Crisis

A Currency Crisis Continued

I'm not going to go through all of the post again, but it showed how yesterday's move was predicted perfectly by the night before's Futures post or more specifically, how the currency futures were set up last night for the market to move lower overnight and today.

So this is what we have, NOT BECAUSE OF ANY OVERNIGHT NREWS, NOT BECAUSE OF ANY OVERNIGHT CATALYSt, in fact it's difficult to determine exactly what caused the currencies to move, all we know for sure is that 3C showed in last night's post linked above, "Incredible..." that the currencies were most probably going to move based on 3C divergences and that was going to cause the market weakness we have been looking for to form a "W" bottom.

This morning in pre-market, this is what we have...
As I mentioned yesterday.yesterday's price action looked a lot like the second top of a "W" base" and you can see where we will open roughly in the white box of the bid and ask, that's roughly forming our "W" base, so today might be the day we start taking some positions for a short term tradable bottom which moves in to our bigger picture tradable top.

That is essentially what has happened, it's all in the posts above.

I'll put this out so you have an idea of what the plan is today, to watch for accumulation in to price weakness and if we get that, to start taking some short term positions to trade this short term bottom that we said we were looking for as of the 15th.

Futures update coming next...