I think we are pretty close to our destination, we still want to see some lateral trade and accumulation build, but the moves in volatility and overall in some risk assets suggest we are at our "W" area.
First Volatility and you may recall last week we had positive price behavior in the VXX Thursday as well as positive divergences and that was an area we talked about VXX or UVXY long trades. Now we seem to be in the area in which you probably definitely want to look at closing those out for short term trades, longer term trades is too complicated for this post considering the assets.
SPY arbitrage (30 min delayed) being red right now would mean assets like VXX would not be in play to manipulated the market higher, in that case VXX we would expect VXX to be a bit higher.
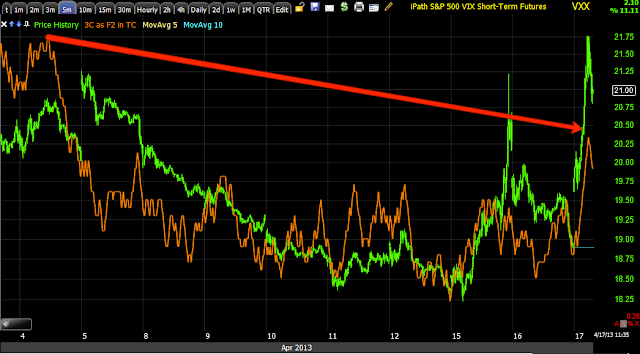
VXX 1 min 3C chart shows a relative negative divergence so I do think this is the area distribution of the VXX long trade is occurring, the longer charts aren;t there yet so I think we could get another move toward the highs or some sort of consolidation like a triangle or a flag intraday in the area.
This 2 min chart is in line so it's not seeing the migration of the 1 min chart's negative divergence, I would expect that to happen as we move forward though and on any market move higher, VXX/UVXY should head lower (again the nature of the trade is shorter term, maybe a couple of days, but it's usually longer than reason would suggest) so VXX short or UVXY short would be the play or XIV long.
VXX 5 min intraday is not seeing a negative divergence at all so again the negative has to migrate across those timeframes to prove its building strength.
On a relative basis, yes we have a relative negative divergence overall and that helps to increase the probabilities of our market bounce, as far as timing though, we want to see the intraday charts like the one above this one start to go negative as well and they'll have to move higher or consolidate for that to happen.
CONTEXT Model for ES (SPX futures)
Remember this was at the largest negative differential I have ever seen just before Monday's drop, it was a 40+ point ES negative differential in the model, as I showed (I believe yesterday), the move in ES was almost exactly the same as the ES model's negative differential. The fact the ES model is going positive here suggests risk assets are improving, (interest-rates and curves, credit risk, FX carry, commodities, and precious metals) and other assets in the Context model.
I may be a bit slower on emails from here on out because I need to really pay attention to what's going on and post it for all of you.
Is interest rates about to start going up?
-
Yes, I know - it does not make any sense - FED is about to cut
rates...but....real world interest rates are not always what FED wants it
to be.
6 years ago


No comments:
Post a Comment