Monday, May 13, 2013

GDX-Gold Miners / MARKET CONCEPT

This is a complicated asset, 1   because of the market behavior we'd expect from it, 2 because its long term correlation with gold has been flipped on its head over the last several years and 3 because its correlated to gold which is in the crosshairs almost more than any asset with the F_E_D ending extraordinary policy accommodation. this is why I have thought gold has performed so badly lately longer term (bear market) as smart money has discounted what the F_E_D is doing long ago, if I can figure it out last year and Hilsenrath is now just telling dumb money it's a possibility, than smart money knew before I did.

Yet many of you have asked, I'll show you, but also give an opinion on the trade that might surprise you.

THIS IS A MULLTI-DAY (4)  of GLD, it shows confirmation of the uptrend and then distribution, to show distribution on a 4-day chart it has to be VERY HEAVY, ironically it starts right at the 2011 top, which ironically is the place I said we have either seen an intermediate or a primary top in gold, thus far I was right as gold has moved in to an intermediate downtrend, it may move to a primary bear market, I suspect it will.

*On a personal note, if I had been accumulating physical gold and silver the last several years, I'd be selling it all right now while you still can at a reasonable level and maybe keep some profits, I think gold will be back down to about half of its value today within the next year.

 The yellow box is where we saw the large triangle top-triangles that large are either tops or bottoms depending on the preceding trend, 2011 is where we were going to buy some GLD, but stopped because I didn't like the change in character, we were 100% right. I told well (I'll withhold his name-many of you know him), he has his own site and a fund and is a major gold bug, back then that I thought gold topped, he dismissed me as some punk kid. Part of me hopes he's still long gold and buying the dips, I'm sorry, but arrogance in the market and thinking you know everything (I learn from our members every week) is a fast track to the bottom.

 This is the 60 min counter trend rally in gold/accumulation-remember counter trend bear market rallies are some of the strongest rallies you'll see in ANY market; think ABOUT WHY?

 GLD's 10 min 3C trend, remember new divergences start on earlier timeframes, I can't say 100% that this is the end of the counter trend rally or just a break in it, I do not consider this a high probability area though to enter any trade in GLD currently, it's too choppy, volatile, there's no good stop nearby, there's no "Let the trade come to you" concept in play here. You don't have to trade everything, wait for the best set ups.

GLD 2 min has an interesting short term positive divergence, because of what we see in the miners.

How many remember out "Miners Trading System"? The two trading assets were DUSt (3x short GLD) and NUGT (3x long GLD) and the system gave signals to buy or sell both.

You may be surprised to know that the rules I used in the system had nothing to do with gold, instead they had to do with two costs that miners can't control and create either higher or lower costs and that is what the system was based on-the costs miners faced and those were based on Energy they need to run operations and currencies as the value of their gold as mines are across the world, depends on whether their currency is weak or strong against the $USD which is what gold is traded in-almost everything else, labor, equipment, land leases, etc are fixed costs.


 This is the Trading system that gave a short for NUGT/Long DUST and as you can see, that trade would have made significant money on a nice trend, but there's a recent cross to long NUGT, this is not based on anything other than Energy costs and currency values, but it is interesting as it fits with market concepts.


 5 day chart of GDX, I always start from the longest chart because it shows me the history, what I see here is a massive, complex H&S top that has broken down and is in a bear market-before gold and this makes sense. Miners use to trade at a higher multiple than gold itself, that all changed in 2009 and miners traded at a significant discount to gold so the fact miners are down first and harder is no surprise. Longer term I expect miners/GDX to make significant lower lows, as a long term invesment, short GDX makes sense to me.

I checked volume to validate the H&S top, it validates it with my custom cumulative volume indicator.

On a 1-day chart it looks VERY much like GDX will see a counter trend rally, like some other assets recently, volume makes sense, the range makes sense, even the market behavior for H&S top shakeouts make sense, although this is a long way to go to shakeout shorts.

 This is the 2-day GDX 3C chart, makes sense for a H&S top doesn't it?

However the 2 hour chart looks like a counter trend rally is the highest probability right now.


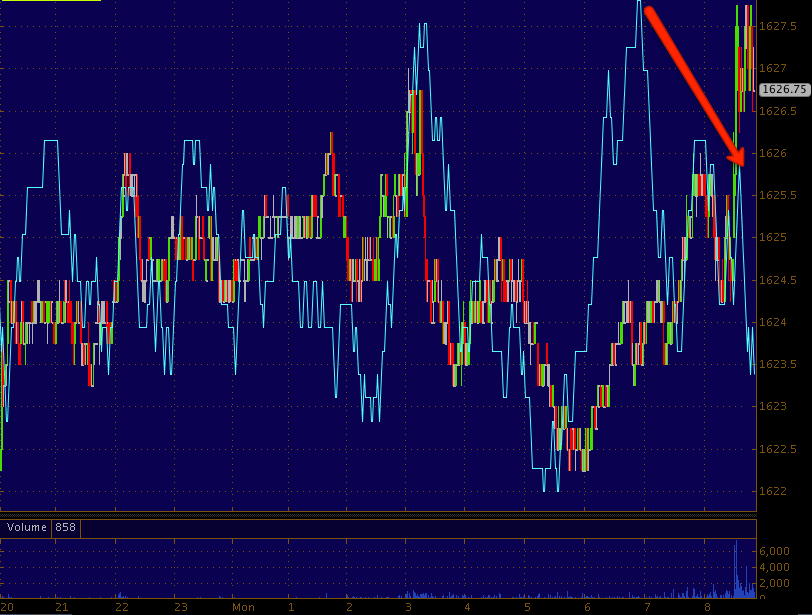
 Strangely though, on the 1 min chart you can see whenever there's strength in GDX, it is sold, much like many market averages and assets, this could be part of maintaining a range to accumulate in as well, it's hard to say for sure.

NUGT which would rally "Countertrend" with GDX also has a 30 min accumulation zone after distribution and confirmation of the downtrend.

The 5 min NUGT chart shows strong accumulation, at this point it is very tempting for a swing type trade-long GDX/NUGT.

 Again though a 1 min chart of NUGT s like GDX, strength is sold, that is natural when trying to accumulate in a range, you want prices low and steady, I only question it because the market is doing the same without the range conditions.

 DUST, the 3x leveraged short GDX ETF shows longer term 2 hour distribution in its uptrend as GDX has moved lower, this confirms GDX and NUGT's charts.

The 60 min shows distribution at recent highs, again confirming GDX and NUGT.

The 2 min chart does the opposite of GDX and NUGT in the same timeframe, which again confirms them.

As for behavior of shaking out a major H&S top as we discussed with AAPL, it makes sense here, although the decline from the H&S is a bit deeper than usual, by the time price moves to shakeout shorts, most shorts will be at about 0% or very small losses and will see GDX as overbought and not likely to cave in easily.

The other problem is it is hard to imagine gold/GDX making a big move like that now, but the 3C signals are there supporting it, the problem is that we have seen those fail since last week the same way they failed in AAPL just before it lost nearly half of its value.

I'm going to say that despite the signals, I'm not playing GDX unless it does bounce on a counter trend move and I will use that as "Letting the trade come to me" and look for a short entry to be on the side of the primary trend-short GDX or long DUST, but that requires patience.


AAPL Update

I just wanted to let you know where I'm at with regard to AAPL and a new put position, I am waiting for now. Remember that moves like this, a counter t rend (Friday was down, today up and you should know why from earlier updates) are only effective if they move sentiment and make the new shorts so scared that they cover, today's move has started the process of exactly what we were looking for Friday and that's why we closed the AAPL put for a profit, but this move is not to, as they say in Technical Analysis, "Work off oversold conditions", the market cares less about overbought/oversold or else this would be the most overbought market in our lifetimes, it cares about its positions and these moves are a means to an end, they are only effective if they can scare new shorts enough that they believe they are facing losses much greater than a bounce which is to be expected.

So although we are seeing the right track in AAPL developments, imagine yourself as a new short entering when AAPL broke below $454, at $457 are you scared?

You have to forget about what Technical analysis tells you about overbought and oversold-they almost got it if they had thought a bit more because they always add the caveat, "The market can stay irrational longer than you can stay solvent", what they missed was the market is not acting irrational, it's pushing emotions to their breaking points, the market is not some benevolent or ambivalent creature, it's an extreme, manipulative, emotional hell on earth and that's the way Wall Street wins so understand that and you are closer to beating Wall Street.

GDX update is next since so many have asked about it.


Quick Update

The market is very scattered and fragmented, each average is different, almost all show distribution in one form or another, but the flocking of the herd is gone, they are in panic mode, EUR/JPY and AUD/JPY have distribution, the TICK looks horrible, it looks like from the TICK that again, any strength is being sold, TLT is the one to really watch.

We are at a very complicated time, these extreme markets and the breaking up of the herd only happens maybe once every 5 years or so, when the primary trend changes and this is the most extreme I have seen, there's the most to lose as the entire rally from 2009 was built on a sand foundation as a house of cards with liquidity that the entire market is now catching on as Hilsenrath got the OK from the F_E_D to go ahead and say what they have been clearly hinting since September last year.

Panic is setting in although it doesn't look like it, watch how long gains can be held before someone who use to move with the herd says, "Sell here and now, don't wait".

I'll do my best to answer emails, but the most important thing  is trying to tell you where we are and what assets make for good positions right now.


TLT

Here are the charts, as mentioned, I didn't understand why Treasuries gapped down with the market, they normally would go the opposite direction, but the low volume of overnight futures allows price to be manipulated with little cost, they want to buy TLT as cheap as possible.

First though TLT is used to send SPX and Dow to record highs, Wall St. can sell in to strength and short it, while buying TLT on the cheap. You recall we saw the shorter term (meaning not heavy distribution, but enough to turn TLT down) negative divergences and I even said specifically, TLT, although it has a VERY strong underlying trend will move lower, maybe a gap fill?" 


Well we can see what Wall Street is doing many times, but if you wait to find out why, then you've missed the move, the reason why in retrospect is quite clear.
 TLT (long term 20+ year Treasury Fund) makes a base, but before heading higher? A HEAD FAKE TO SHAKE OUT LONGS (Yellow trendline), TLT moves up against the SPX correlation and against what EVERY pundit on CNBC said, they said there would be a "Great rotation out of bonds/treasuries and in to stocks", does that look like that is what happened? Turn off CNBC.

Note the white areas where I suspected and 3C short term told us TLT was headed lower, I assumed to fill gaps-on 4/10 TLT gapped lower and 5/3.

Now, look at the SPX on the same days, remember TLT is one of the 3 levers.
SPX breaks out to a new high on 4/10 and again on 5/3, that would not have happened without TLT

TLT recently, "A" showing signs it will pullback, "B" starts accumulating and those who accumulated at "B" (even with price lower now, I guarantee will see profits), "C" is where TLT moved up with the SPX, the SPX topped right there on distribution, TLT was set to head higher and send the market to deep lows fast, this was last Thursday. Only the PPT would step in at that point and I believe as one of our members  wrote in and as John Hilsenrath, the unofficial mouthpiece for the WSJ wrote conveniently after the close Friday that the F_E_D is going to be tapering out of QE as I have maintained ever since (ironically) they launched QE3 on Sept. 13 2012! He also said they were worried about more or less managing the downside moves, but this is nothing new for the PPT, they don't ever want another 1929 so they let markets go bear, but manage them so they don't crash. Perhaps this is why there are typically more up days in a bear market than down days, the down days are just bigger. 

At "C" I almost guarantee it was the PPT stepping in sending TLT down on a large divergence for intraday and immediate, meaning they flashed a big order out in the open for all to see, not something smart money usually does. Why do you think there's all of this hubba-bub about Bloomberg terminals over the weekend and them being able to see whop placed what order? It wouldn't be good for the public to know that big TLT sell order flashed on Thursday at 2 p.m. came from the NY F_E_D's trading desk!!!

"D" could be a head fake move, I was surprised there was none, but it would be a natural reaction to seeing such a large,  apparently desperate looking sell order in TLT on Thursday as well. No doubt part of the PPT's way of sending TLT down without having to spend a lot, mostly psychological warfare.

As already stated, after the Hilsenrath article after the close Friday, of course smart money is over the print in TLT on Thursday and wants to buy TLT as cheap as possible, the easiest way is to send the open lower by manipulating LOW VOLUME overnight futures trade, which was accumulated as we already saw this morning.


 TLT 10-min, accumulation and at "A" the move on Thursday that could have crashed the market, even after TLT was sent lower the SPY still moved down. TLT broke out at 2 p.m., just as the SPY saw distribution and moved down and it broke out on 400% volume, Tell me one other risk asset like SPX or DOW new highs that even posted 25% higher volume on all new highs-NONE.

If TLT kept going without the PPT stopping it, SPX would be a lot lower, perhaps 1929 style, the PPT stepped in for a reason, not to manipulate, but to halt unreasonable declines.

Note accumulation even today in TLT as I already showed in futures.

TLT 5 min accumulation today, the green arrow is TLT's breakout and the PPT's halt of that, which is fine with smart money, buying TLT on the cheap is even better.

 TLT intraday 1 min

2 min with migration

3 min migration. Any questions as to what is happening in the Flight to Safety Trade?

TLT looks like it wants to head higher intraday, I'm sure they'd rather accumulate more down here, we'll see what they do, plus TLT moving up with VXX which is accumulating wouldn't be good if HYG  can't hold gains as it hasn't been able to yet.

SPY is Green-WATCH HYG

Remember HYG strength is transitory, it's just a lever being pulled on an oversold basis, it may help HYG longs to exit on strength, this is why we want to see if they exit as fast as possible, the "Every man for himself" rather than try to get the best fill, that tells us they just want out at any cost, the same as AAPL when it fell.

TLT-Lever's Update

First the SPY Arbitrage...
Arbitrage went from positive to negative.

A few things are happening, right now even as the SPY is trying to fill the gap essentially and get green, it is seeing distribution, this is what I have been telling you since last week when I said Thursday night on some risk on assets (currencies) with positive divergences, "Something doesn't look right".

Those divergences sent the currencies higher, but were cut almost immediately short with distribution in to any slight gain, knocking them down, it happened again Friday, any bit of strength is being sold, the hedge fund herd (they herd, I'll ex[plain why later) is breaking up and that's why the signals didn't look right, the same thing happened in AAPL as soon as it was disclosed that Dan Loeb no longer held AAPL as a top 5 holding, every bit of strength in AAPL was sold until the sellers (hedge funds) panicked and all trried to sqeuzze out the door at the same time, not caring about a horrible fill, just wanting out. That sent the GOLDEN STOCK, AAPL down 45% in 7 months.

When AAPL was crossing $700 to the upside and I said it had the worst negative divergences I had seen in AAPL ever, did you believe me?

Now AAPL has lost 315 points and moved down almost IN HALF in 7 months, do you believe those divergences were accurate now? 

The same is happening in the market now, I showed this morning, strength in any risk asset (currencies, etc, is being sold as soon as it appears.

TLT is down, I knew and told you when TLT was near its highs it was going down, for some reason I didn't understand at the time (and you never understand what smart money is doing, you just see it, at least until after when it's too late to make any money), the reason was two fold, to allow the SPX and Dow to make new highs and smart money to get out and sell short the market and secondly to accumulate TLT at better prices. If you think TLT being down is bearish, it's because you follow price only. If you are smart money and have seen the exodus almost all year in to TLT, you know TLT is going higher as the market crumbles so if you know that, do you want to buy TLT near its highs or do you want to buy TLT as cheap as possible?

Before we get to TLT charts, I'll just tell you about the 3 SPY arbitrage assets this a.m., VXX is almost unchanged, but under accumulation. HYG is down pretty significantly BUt, is seeing short term accumulation, HYG is oversold and they will use that as cover to use HYG as a lever to support the market right now because VXX is being accumulated and other than short term HYG intraday accumulation, HYG is being distributed HARD, they are as I said, running, not walking to the exits.

What will be interesting is to see whether HYG is sold early on any bounce/strength?

TLT is down, it gapped lower with the market last night which seemed strange as they move opposite each other, but I'm convinced the low volume of overnight futures was used to gap TLT down so it could be accumulated on the cheap, that is what is happening in TLT.

I'm posting this so you know what is going on and what to watch for-HYG as an upside lever, and whether HYG is sold in to any strength earlier than it should be, I'll tell you that. if so, then this market, as extreme as the divergences are like AAPL, is doing the same thing right before AAPL crashed and that may be the only way we can pinpoint a market acting this extreme, hedge funds are every man for himself and selling any strength.

TLT charts next.


AAPL Update

You may recall on Friday we took profits in some AAPL Puts for a 25% gain because of a short term bounce I expected that really has more to do with a market concept than a 3C signal, although both were there.

The concept and AAPL move I wanted to warn you of so you knew what it was if you saw it and knew how to take advantage of it if it materialized, as I suspected, it did.

From the post linked above...

"because the market is human emotion, the concepts are fractal as is the market, you'll see this happen on a 1 min chart, a 15 min chart, a daily or monthly chart-the concept doesn't change."

"AAPL has a small H&S pattern, you can see it above on the 10 min chart, you may recall there are 3 places I will play a H&S pattern and 1 I WILL NOT....The one place I will NOT enter a H&S is where Technical Analysis tells you to, on the break of the neck line (red trendline support). That's where most shorts enter on "Price Confirmation" and that's where most will be shaken out."

"I have no strong 3C proof of a shakeout here, but it is a common market behavior that takes advantage of the predictability of Technical Traders who have been doing the same thing in this case, for a century.

I mention this because first I want to prepare you in advance in case you see it, you know what it is and don't fall victim to the trap. Secondly and more importantly, for anyone wanting to enter AAPL short, that's the last low risk, high probability area to do so. You have to wait until price is above the neckline and you see signs of short covering like a rally with no pullbacks intraday, like a diagonal line."


As expected, more because this is just the nature of the market, as mentioned above (as I had no strong proof at the time), AAPL has done exactly what almost all H&S patterns do, this is why I won't short them where all Technical Analysis books tell you to, but I will use them to my advantage-like taking profits in puts before they disappear and when the time is right, entering at the Third place I will enter a H&S top-no matter the size-market fractal behavior.

AAPL Update...
 This is the H&S top, very small compared to a textbook H&S top, but the textbooks don't recognize the fractal nature of all price action, how else could I have properly predicted exactly what AAPL did this morning when I had no 3C signal at the time I wanred in this post FROM FRIDAY, "AAPL Possible Setup-MARKET CONCEPT" ?

There's the H&S small reversal top and the market concept of shaking out the shorts that enter on the break of the neckline as Technical Analysis teaches, "To short ONLY after confirmation", Wall St. knows Technical traders are so predictable that they always run a H&S through the neckline where the new shorts have their stops and that's why this is the 3rd and last place I will short a H&S pattern, after the shakeout. That means our AAPL Puts closed in ANTICIPATION of this move (which would be worthless today instead of a 25% gain on Friday) will be able to be re-entered soon for a bigger gain, we must still wait for the short squeeze to finish and the signals to line up.

 Here's the long term 30 min chart of AAPL hitting +$700 and losing 45% in 7 months, like the market now, AAPL was at VERY extreme 3C readings and few believed them as AAPL made a new high of 10 % over $700, but for those that trusted, a 45% (nearly half of AAPL's value) was taken in 7 months, the extreme 3C signals were correct.

You can see the positive divergence that was the recent AAPL run up, this is a bear market counter trend rally, as I say often, these are the strongest rallies you'll ever see, they have to be. So AAPL is already in a bear market and already pulling counter trend bounces, that tells us something about the overall market's position/situation, especially with the recent failures of late last week, remember when I said, "This doesn't look right" 2 times in 24 hours, booth times correct, that's the behavior seen in AAPL right before it broke, but few wanted to believe with AAPL at all-time new highs, I hope they held, it's the only way they'll learn the lesson.

We also see a negative divergence on this counter trend bounce, this is why I opened not only the puts (closed Friday), but an AAPL equity short (still open) for the longer haul.

 Here's the divergence for AAPL's counter trend bear market rally, it was strange of you recall, coming and going, I think that is because AAPL was already in a bear market with a counter trend bounce brewing while the rest of the market was behind AAPL so it was hard to reconcile, but the negative divergence here makes sense, things are easier to understand now.

 Here's a close up of the short squeeze predicted Friday BEFORE there were any 3C signals, I predicted this solely on the basis of market behavior, in fact more specifically, the predictability of retail technical traders and how Wall St. uses that predictability against them.

As the flat area continued (where we often see divergences), the divergence became much clearer. Look at the price action this morning, that is short squeeze covering.

The 10 min chart of the counter trend rally for context of the situation.

All we have to do now is look for the short term divergences to go negative, then AAPL becomes a short (equity or options or for me, both).

This is why I posted specifically, MARKET CONCEPT" because these are so predictable, even without evidence yet, we can expect them as they occur so often and all because technical traders are SOOO predictable. 

Morning Thoughts Continued...

The JGB market was the barometer to watch in the 1 Quadrillion Yen Japanese debt market-JGBs, whether BOJ leader, Kuroda and Japanese Prime Minister Abe who set the country on this ambitious, QE on steroids course, look very much like they have lost control as I suggested days after they announced the true QE policy Bazooka, that trend continued overnight. For anyone who has looked at historical moves in Japanese JGB's, you know these are historical moves and acutely suggest Abe and Kuroda have lost control as we saw the next day after QE was announced (which was the biggest ever-doubling the BOJ's monetary base in 2 years) as the Yen started seeing accumulation that hasn't stopped and JGB futures went limit and tripped circuit breakers for days in a row.

Only the temporary move of USD/JPY over $100 which was the BOJ's target and an area that has the G7/G20 now speaking out whereas they were quiet before as they were engaging in the same currency destruction.

10-Year JGB futures, as mentioned, have now seen the biggest 2-day sell-off since 2008 during the Lehman Crisis. 5-Year JGB yields have moved to their highest Yields  in 13 months at the fastest pace in 30 months.

The Implied volatility of Japanese Interest rates will pressure banks (Japanese) to reduce risk by unwinding positions including equities as well as others that will effect Europe's sovereign interest rates as well as FX rates.

As mentioned last night, the risk on currencies of the Euro and AUD looked like they'd head higher overnight, I suspected in to distribution and the $USD and Yen looked like their larger trend would win out with 5 min positives, here's the currencies as of now, thus far the signals I saw last night and my expectations have played -out right on time.
 1 min Euro with a negative divergence in to a slight overnight gain going in to the open...

 And as expected the $USD and Yen have positive 1 min signals as you'd expect from the Euro chart above, as well as...

The 5 min positives as seen above in the Yen here. The $USD looks very much (as it has for the last several weeks) as it is coming out of the pullback from the completed base. The Yen is looking like it will make a move higher as it continues to accumulate fro a larger move higher, the same thing we saw the day after the BOJ announced their QE and every day since, the length and size of the divergence suggests BOJ policy is a failure.

 4 hour Yen 3C chart with an enormous Leading positive divergence.

4 hour chart of USD/JPY, I believe the BOJ spent all of its ammunition to get the pair to their target of $100, note the huge leading negative divergence on a 4 hour chart, rarely seen past a 15 min chart with pairs.

As for the Carry pairs, as suggested last night, they'd move higher and see distribution in to those moves, that happened, they moved higher again in the earlier morning hours and saw the same distribution again, I'd think whatever is left of the Carry Trades, they are being aggressively shut down as traders sell in to any strength, again, the herd breaking up.

 EUR/JPY sold last night as I suspected and again this morning.

The same with the other carry pair, the AUD/JPY, you can see from last night's decline they were sold in to any small strength and again this morning with a negative divergence-these are the risk pairs that support the market when they rise.

The other risk pair (although not a carry pair), the EUR/USD also has a negative divergence right now.

As I suggested last night, the markets not being open and the position of the risk pairs as well as Treasuries is what had CONTEXT so out of whack, as you can see, it has changed...

From +20 to +14 when I wrote last night, it fell to 7.5 as the overnight risk pairs were sold, they ran up again sending CONTEXT off the early a.m. lows and are being sold again to put CONTEXT at a differential of + 9.7, I expect it to continue to fall.

Also moving CONTEXT, as I expected last night, any weakness in US futures (10/30 year) would be aggressively accumulated, they were.

 10 year 1 min Treasury futures, they did gain overnight-further sending CONTEXT down...

10 year 5 min positive has grown even larger, exactly as expected, weakness in Treasuries or safe haven assets being accumulated, strength in risk assets being distributed. The more important 30 year...

 1 min as it moved higher overnight on accumulation and the 5 min chart below...

An even stronger leading positive divergence, again, more proof the TLT move was a head fake not only for the normal reasons, but to save the SPX Thursday from an epic collapse, as the WSJ's Hilsenrath suggested Friday after the close, the F_E_D is not only looking for their exit, but trying to manage downside catastrophe, not hold up the market-trying to keep the sell-off as orderly as possible which is nothing new-the same thing they have done since the late 1980's.


Pre-Market... Developing as Expected

There's no glory in calling an event that you have read about historically and seen in your own lifetime happen again and again, anyone who calls this event like I have are not ahead of the curve, they are simply paying attention, they aren't gurus, they simply know the historical trend, they aren't smarter than the crowd, they are just more willing to recognize reality than get caught up in temporary, however impressive, distortions that can't go on forever-no bubble-even F_E_D induced, can go on forever.

I have spoke many times about how I followed the declining currency market, the carry trades and the major changes in the Yen that will change this market, almost all have something to do with the F_E_D backing out of policy, but in a quick search this morning I found one of those articles when I was tracking currencies, suspecting there was a change in the making, you may remember these posts, they all looked the same-for newer members there were several a week as we could see the early changes in the trend before anyone else (not, "could recognize them, but...) was willing to recognize them.

Here's an example...  "Currency Wars" Wednesday Feb. 13, 2013

As for the two-paprt article dealing with the $USD and just as important, the Japanese Yen, "A Currency Crisis" I have place permanent links under the link section at the top right of the member's site. I spent 10 hours researching and writing these of April 14th, 2013, they are just as valid now as they were then and just as important; if you haven't already, I'd read them.

Here's where you can locate them...

Overnight for the second day in a row, as I have maintained since writing those articles, it seems the Bank of Japan, BOJ, has lost control with the most ambitious QE program ever. Overnight Japanese 5 and 10-year JGB futures (like our Treasuries) have fallen at the fastest rate since 2008 during the Lehman crisis. The fact they are trading like this and were halted were what I said in the articles would be the signal that the BOJ and PM, Abe's ambitious plan to halt 2 decades of deflation with massive QE, would be a signal for failure. Only the Yen moving temporarily above $100 has allowed the Nikkei to perform well, it is irrelevant, the JGBs are what to watch.

Yen short term and slightly longer term, you've seen the 4 hour chart, the move down in the Yen is temporary, when it moves higher, watch out across the globe.
 Yen 1 min overnight...

Larger Yen 5 min trend...

Index Futures overnight...
ES not able to fill the gap, more importantly...

 As you can see with the longer TF (r2K ) The gap was not filled, but as I suggested, any move in to strength is being sold.


The exact same happened with NQ-and ES its just the histories aren't long enough.

I'll bring you more after the open, but that's what pre-market looks like thus far, we will see the normal Monday morning volatility I'm sure to run out weekend warrior orders and stops.