Monday, June 17, 2013

AAPL Update

First the market, there are some 1 min intraday positives, I suspect because they are only 1 min, they are more meant to keep the market in a specific spot for a fixed period, usually not long. I don't see any serious examples of this positive behavior moving to longer timeframes to negative the last market update so I think that is still the likely near term outcome, just a bit delayed.

You may recall that I closed the AAPL Equity Short position last week, AAPL was meant to be a longer term short trade, but I'm just not so sure about it until I see what it is capable of, the second question that you have to ask with a stock that was cut almost in half in 8 months is, "Is this the best place for me to deploy capital?" 

It's not about being right or wrong on the direction, you can post that on Stocktwits and grab some props, it's about determining what is the best allocation of your funds, sometimes that's out of the market altogether.

There is an open AAPL July $420 call of some size, in fact a lot bigger than my risk management rules allow for, a LOT bigger, so I obviously see something I like in AAPL.

 AAPL daily, the triangle is the notable feature.

Here's a closer look on a 60 min chart, this is generally speaking, WAY too big to be a consolidation/continuation triangle in a trend, it looks more like a top or bottom, but in this case it's too small to be a bottom of any serious consequence, it may be enough for a 50% retracement of the $700+ to $385 decline and I believe that's what I said, why I closed the short equity and why I think AAPL is a playable long equity position rather than just options.

The yellow area recently is what? And when do head fake/stop runs most often appear? So it would seem AAPL is very close to a move to the upside of some size.

You can see the positive divergence all the way out to a 60 min chart as AAPL made a stop run or head fake, that gives me confidence in AAPL's ability to deliver on the upside.

 The 30 min chart...

The 10 min... I think we've established AAPL's positive character.

Shorter term, the 1 min chart was strong Friday afternoon like many, it went negative earlier like the market and id showing a renewed positive move like I just mentioned in the market, except this is a lot stronger.

The 3 min chart is positive too.

At this point I think AAPL is a decent equity long position right here, it's probably a good call position right here, although we want the trade to come to us so I'd watch for any pullback, I'm pretty sure it will be worth a call position, unfortunately I won't be able to join you.

I think this is bigger than just the market short squeeze, but could play a large role in that.

NFLX, IWM, XLE Options P/L

Most of these positions were opened Wednesday or Thursday of last week.


The gain for this position in NFLX came out to +68.9%


The gain here was +9.8%


The IWM Gain was +19.6%


And the XLE gain was +28%

Out Rank starting off the new week for the Options Tracking Portfolio


In no way am I claiming to be a great options trader, but this just goes to point out for the second week in a very volatile and choppy market, that we are in the right place at the right time, to be at #4 means a lot of people were in the exact wrong place.

That's really all this ranking is good for, to understand where you are compared to the heard, on the right track or not and it's a good indication of sentiment, if not a bit lagging.


Closing NFLX June 215

Market Update w/ Charts

First I want to say I bought a Samsung Galaxy S4 This weekend after having been an I-Phone person forever, I don't know what AAPL will do next, but I couldn't sign a 2-year contract for an IP5 when the S4 was already blowing it out of the water. This is what AAPL missed on the IP5, my exact words were, "This is the first I-Phone that isn't revolutionary, but evolutionary", the S4 is revolutionary, maybe in some gimmicky ways, but I find them useful, I wish I had some on my computer.

OK, the market. First let me say the SPY Arbitrage is non-existient this morning, but CONTEXT for ES (SPX futures) looks REALLY bad. I'm not sure if this is something we should expect, but I do want to see how the market reacts to a pullback and we have plenty of time for that to happen today, this is why I have been closing down some nicely profitable positions as they can be added back at a lower level.

 The CONTEXT ES model is 17.5 points lower than ES, suggesting ES is quite over-valued at the time.

 ES 1 min isn't horrible, but volume has fallen off badly and there's a negative in place.

The same with NDX futures.

Oddly though, I don't see too much wrong with the USD/JPY or the $USD and Yen that would suggest that's where potential pullback momentum is coming from. I guess we'll see, I still have some open calls like XLF, and others, but I wanted to take those gains and see if we can not only get good information about the near term, but also set up new positions.

The SPY 2 min, as mentioned earlier, is just not confirming as it should this early.

 The IWM 3 min was very positive Friday afternoon, thus the gap up, but it hasn't added anything to that chart today, 3C was already up there Friday, again, not as strong in the near term as I'd like to see.

1 min VXX suggests a move higher, which sends the market lower.

However at 5 min where it's important beyond an intraday wiggle, VXX ix negative which is in line with a nice, durable short squeeze this week.

TLT is also positive suggesting the same as VXX, yet again...

The 3 min is negative suggesting the same as VXX 5 min above.

And finally...
 HYG 1 min has a pretty sharp negative divergence, if HYG comes down and TLT and VXX all move up intraday, that's a solid arbitrage move and the SPX/market pulls back, perhaps a nasty pullback from the looks of CONTEXT, but all that really matters is the underlying action in to any such pullback.

If it's positive, then we can start setting up new positions in FSLR, IWM, XLK, etc.

Once again, the momentum on HYG's 5 min chart is also indicative of a stronger, bigger move coming, this I believe with about 95% certainty is the short squeeze this week I mentioned last week, last week I didn't think 2 days was enough time to keep the psychological pressure on before a weekend and likely pullback in global markets based on 2-days of US market strength, thus Friday was the "Nothing" day I expected.


Also Taking IWM July $96 Calls Off the Table

Also Taking XLE July $79 calls off the table

I think the $USD comes down intraday

Taking NFLX July $210 Calls Off the Table

I've waited long enough for confirmation, not what I wanted to see.

Quick Update

After watching a.m. trade develop, I feel pretty certain we'll have a pullback shortly, possibly a gap fill. There's some slight damage on the short intraday charts like 1, 2 and 3 min. Where it really counts, at 5 min, the charts are still strong so I'd guess this is what I expected last night, some early weakness, but nothing to be too alarmed over.

I'd like to see how the market reacts to a pullback, if there's accumulation, if so, which I expect, then there may be some good opportunities to get in (LONG) on some assets you might have been eyeing. I'll keep updating the situation.

Pre-Market Update

Overnight we got part of what we expect, whether it holds in early trade is more, "Take it as it comes", but USD/JPY again was the catalyst...
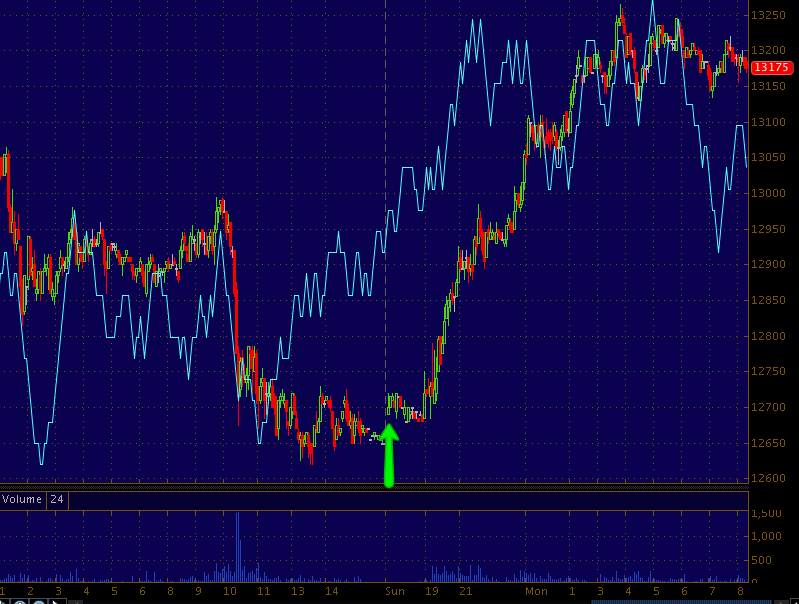
 USD/JPY since the open of futures/FX this week and overnight on a 5 min chart; briefly held 95.

This sent the Nikkei higher by +2.73% and above the psychological whole number of $13k.

This in turn sent ES higher overnight as Europe (most of it) also got as boost on low volume, likely short covering...
ES 1 min with some recent consolidation.


The Empire F_E_D Indes was out this morning, the headline number beating at an incredible +7.84% vs last of -1.43% and consensus of 0.00%, how the headline number beat with all of the other sub-indicies coming in horribly is beyond me, well not really, but you know what I mean.

For example...

New Orders down, Shipments down, Unfilled Orders down, Delivery Time down, Inventories down, Number of Employees down, Avg Workweek down, Labor market conditions worsened, with the index for number of employees dropping to zero and the average workweek index retreating ten points to -11.3.


F_E_D mouthpiece from the WSJ, Hilsenrath writes that if the Fed maintains confidence in their economic forecasts (If and how these forecasts change) it could send an important near term signal about the Fed’s near term intentions; it could signal they think they're on track to begin pulling back on QE later this year.

As for hints in the early going, I look to the JPY and USD separately and find there's not a huge edge like the 15 min charts from last night that firmly suggest a nice short squeeze early this week, they are on the positive side each* (for the USD/JPY) to move higher, which is positive for the markets, but look a little soft right now, I'd expect some volatility in early trade as we always see Monday mornings.


The Week Ahead

I hope everyone had a good weekend.

I took a look at Friday's market action near the closing couple of hours when markets reveal their true nature as most op-ex contracts are closed by then, the market is released from the pin.

My feeling was (as of last week), that Friday was noise that didn't matter much, it would be this week where any real short squeeze could keep the psychological pressure on.

It's also the F_O_M_C meeting starting Tuesday and ending with their policy statement Wednesday at 2 p.m., I'll remind you of the F_E_D knee jerk reaction in the markets; this is by far the biggest event of the week. Short term the only hint we have was last week's unofficial mouthpiece, Hilsenrath from the WSJ spouting out some reassuring comments in an article, that the if the F_E_D begins to taper, it in no way means they will touch interest rates any time soon, the market reacted positively to the article.

The F_E_D may seek to cool the recent volatility which has been pretty astounding in the US, but Japan is out of control ad that volatility is spreading across Asia, starting to infect Europe and I think they'd rather it not hit US shoreds any more than it has.

I'll let the charts do the talking, my gut feeling is still this week is where we see a short squeeze beyond Thursday's very impressive 1-day move, all shorts being squeezed. As far as very near term action, there was improvement in 3C late Friday, I don't know however whether this was a start to be followed up on Monday which is what I'd usually think, or this is part of some accumulation of an early week pullback. There are some hints either way, ES isn't saying much about the very short term, but futures seem to have something to say about a short squeeze this week and there's ANOTHER, very clear technical price pattern, that may in fact be there to scare the shorts in to covering.

To the charts...
 This is a 60 min SPY chart (same pattern in ES and the SPX) showing (not a great trend line) a bullish Inverse H&S bottom or base. Volume is the most important thing in confirming one of these, but since no one does any way and I think its there more as a scare tactic than an actual true base, the idea being to scare shorts in to thinking any move above the white trendline is a breakout of this base and it may very well happen that way, then we prepare to cross the next bridge.

The point is though, just like 2 weeks ago almost to the day I said that I didn't believe all those market triangles were there by accident, well 2 weeks later almost to the day, I'm saying I don't think this price pattern is hear by coincidence or normal market flows.

 Another thing that would scare technical traders in the very short term if it happened would be a break out above this bullish consolidation/continuation "Bull Flag", it's almost perfect. I'd say a breakout of one would lead to a breakout of both and thus a short squeeze.

It's just difficult with Index futures to get a good feel on Monday right now, maybe by the morning they look different. The short Squeeze timeframes look all set as you'll see.

 At 1 p.m. Friday in all of the averages you'll see up to about 3 min positive divegrences through the rest of the day, this may continue Monday or we may get a pullback with positive divergent action, either way any pullback at this point is about as meaningless to me as Friday was overall as I made clear last week.

SPY 1 min

The SPY 3 min confirms the 1 min above, again around 1 p.m. as the op-ex pin would be winding down.

I could go on and on, but here's the 3 min IWM confirming the same Friday.

As for other assets, I saw positives in AAPL, Financials, Tech , the VXX had no clear signal, close to inline, but XIV which trades opposite the VXX and with the market did have a signal.
 XIV is positive on the 13th, but so were all risk assets, it's specifically Friday I'm interested in, this suggests VXX moves down and the market up, it's a 5 min timeframe so it's not for first thing Monday morning, but it is for a decent move in the next day or two (Mon-Tues.).

 HYG lost a lot of ground late Thursday with HY credit, but seemed to make some up late Friday 3 min HYG.

HYG is also leading the SPX all of Friday, so all in all, some more bullish action in credit.

High Yield credit which is less liquid and therefore moves first pretty much signaled Friday's market on Thursday, but look at the sharp move Higher in to the last hour Friday, it seems Credit all over is not SCREAMING, but is relatively strong which would make sense for the anticipated move.

Commodities also showed better relative performance than the SPX Friday.

Here are the Index Futures since opening Sunday...
 ES went positive late Friday as you see to the left with the averages, it's positive tonight, but it's a long night and this is only a 1 min chart, the morning will give us a better sense.

NQ leading tonight 1 min as well

This is what I'm really interested in though and screams "Short Squeeze, the 15 min Yen and USD charts, for the market to go up, the USD/JPY needs to go up and for that to happen the Yen needs to fall and the USD needs to rise, that pulls the market up, this is  just another indication that we get a strong short squeeze, I'm guessing before 2 p.m. Wednesday, perhaps the market keeps running with F_O_M_C as fuel from there.

The 15 min Yen is deeply leading negative suggesting a strong down trend this week in the Yen, that's 1 we need for a short squeeze.

The 15 min $USD is strongly leading positive, it has put in a rounding base that is the right size (the process of a reversal-not event) and is powerful enough alone to move the USD/JPY, but with the Yen above cooperating, I expect a strong move this week in the FX pair and that pair has been leading the market around by its nose.

So, very short term I'll have to see more tomorrow morning or Monday as early action unfolds, I'm not concerned in the least though as far as long and Call positions opened for this move.

Everything else seems to confirm what I expected last week, Friday would be a blah day that didn't do much (in fact it just consolidated in a bull flag) and this week they can keep constant psychological pressure on the bears, the price pattern IVH&S and bull flags are there. I feel very good about those positions.

Furthermore, I think Wall Street knows what the F_O_M_C is going to say at this meeting, it will probably be the minutes that are the bombshell, if I'm right, then underlying trade should confirm it clearly this week on Mon- through Wednesday before 2 p.m.

See you in the a.m.