Thursday, June 27, 2013

Precious metals and GDX

I'll get some charts up ASAP, but it looks like we have some very good (short term) signals for all 3 and they should see upside very soon, likely moving the opposite of the market.


VXX P/L & VXX / UVXY charts

Again, this isn't a reflection of anything more significant than what I posted last night and it is much more about the difference between trading options and equities, even 3x leveraged ETFs.

For those of you who don't know my PERSONAL preference regarding options, to sum it up as succinctly a I can, options are a form of Wall St. derivative, they are by design set up like Vegas or the Lotto, the House always wins in the end and if you think about them and why "most" people use them and how they use them, they treat them more like a lotto ticket than a tool that has a place in trading. In short, I tend to try to do the opposite of the allure of options, I tend to buy more quality rather than use them as a cheap way to control a lot of stock (in the money and a longer expiration than I think I need) and I don't treat them as a lotto ticket, but a way to play a good signal that otherwise doesn't have the profit potential. I'd rather close them out and take whatever gain or loss rather than sit through a pullback or correction and watch their value deteriorate. If the opportunity is there, I'll re-open them at more favorable prices. I don't hold on to them hoping for better prices or get greedy or look for triple digit returns, in essence I try to avoid the traps that are inherent in options, the reasons why so many expire worthless.


As you can see this is barely a break even position, that's not what matters to me, what matters is whether I think there's a better chance that they pullback and lose value (through time decay for instance).

UVXY is doing better at a 7+% gain right now. The draw down in UVXY is tolerable for me and when weighing the probabilities, it makes more sense for me to sit through a pullback/correction here as the leverage is significantly less and we are not dealing with the same dynamics such as time decay for one.

Have you noticed just about every "Core Equity Position" is a straight long or short with no leverage? Leverage in my view is a tool just like options (one in the same really), if I don't need the leverage to make the position worthwhile, I'd rather forgo it.

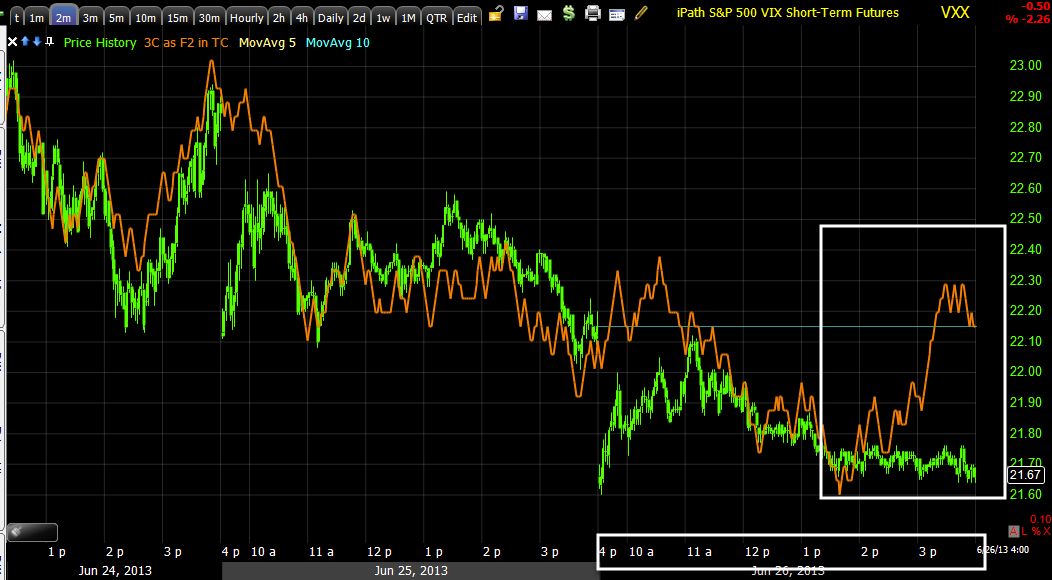
 VXX 2 min going from a very good 3C trend confirmation to a positive divergence, it's not very large, it's not on a very strong timeframe, but it's enough to damage the option.

VXX 3 min is a little more serious because of the longer timeframe, but again it's nothing that has to do with the trend expectations, just short term intraday or day to day "Noise" that is meant to keep traders guessing and create some movement and opportunities.

This is the 3 min chart of the leveraged version of VXX, UVXY, both are short term VIX futures and both trade opposite the market (with caveats here and there like anything in the market).

VXX 5 min -The more important trend and you might say the reason I don't mind keeping the UVXY long open is this leading negative divergence on a 5 min chart which is a much stronger timeframe than those above.

In fact 3C is leading to a new low for the chart.

As you can see, the 5 min chart of UVXY looks almost the same, that establishes decent confirmation.

If you know VXX is likely to rise, than you know the market is likely to pullback. I'll remind you that VXX is 1 of the 3 SPY Arbitrage assets, the other two being TLT and HYG.

Closing VXX July $22 Puts, Leaving UVXY Equity Short open

This is more about short term expectations, the short term intraday charts for the SPY, DIA and IWM all still suggest what I talked about last night, I still think it's short term noise as I tried to illustrate yesterday with the SPX 2008 decline and how the market had almost as many up days as down days in what otherwise at first glance looks like a clear cut, sharp downtrend and it was, it's just there's shakeouts and noise. In a similar way, I'm thinking about the short term in terms of the VXX options because of the nature of options. As far as the more "clear cut trend", this is why I'm leaving the UVXY short equity position open, it won't have the same drawdown and it is more there for the longer trend where as the options are more hit and run as they have been in this market for us recently.

Notice I didn't mention the QQQ with the other 3 above, it looks better, I doubt it bucks the directional trend of the market even intraday, but relative performance can certainly be different and I suspect this is in some part, a reflection of near term AAPL expectations.

Remember as well that Thursday's tend to close pretty close to the Friday Op-Ex max pain pin (yes, even for weekly options).

More on the Q's and AAPL later.

Market Update / Base Area

This is a bit too early to draw any solid conclusions about short term confirmation of the gap up, in last night's post I made it pretty clear there were some shorter term charts falling behind and that could lead to some consolidation to the downside, but this would effectively be noise as the charts that count, the charts with the highest probabilities of the tradable trend have been very solid and remain very solid.

We'll take a brief look at both, at least to some degree (I don't have to repost the 30, 60 min and even 2 hour positive Index futures, we've seen them, they are very strong and haven't changed).

 This chart of the SPX (2 min intraday) is very interesting to me because last week I said according to the size of the move down, my expected basing area or what I would call the reversal "process" would be about 4 days to be proportional which they usually are, I also thought this one might go by faster as a short squeeze would benefit from a quicker turn-around, but if this post from yesterday   , the one about "slow boiling the frog", in essence keeping steady, but limited pressure on the upside, not enough to scare shorts out, but enough to lift the launching point of a squeeze; if that concept is correct then it really wouldn't matter if the reversal had a faster than normal process (rather than an event-reversal- the difference between a "U" or "W" shaped base and a "V" which is much more rare).

So what I find interesting is that my initial assessment of 4-days is just about dead on as the SPX is just testing what would essentially be the neckline. There is resistance there any way, but we also have gap resistance which until the take over of the market by everything HFT, gaps use to be some of my favorite and most effective support and resistance.


 These 1 and 2 min intraday charts are the fast timeframes we use to see early confirmation of a gap up like today or not. Right now for good confirmation, 3C would need to be about where the orange arrow is.

However as you know these are intraday charts, they are mostly for intraday moves and they don't carry the weight or importance of longer charts, even at 3 minutes, but especially at 5 minutes where there's a big difference between the 1-3 min timeframes and the 5 min.

So although this is almost exactly along the lines of last night's post with regard to shorter intraday timeframes and the medium term (I hate using words like that because they are so subjective, of course I mean medium term within the expected 30-60 min positive Index Futures move we are expecting and the one I believe started earlier this week).


 Above the 2 min chart (and 1 min) are not yet in line with price, suggesting an intraday pullback, but at 3 mins we not only have good confirmation, but a leading positive divergence.

The 5 min chart shows all of the underlying action from distribution to accumulation and it too is leading positive.

As I said last night, the short term charts like 1 and 2 min in this case and any subsequent pullbacks/corrections coming from those timeframes are like noise as far as I'm concerned, the real importance of our analysis of this trend lies with the 30, 60 min and now even 2 hour positive Index futures, that still suggests quite a strong move up, probably stronger than I have even imagined at this point.

So we are still very much on track, if there were a pullback/correction, this would be the right area for that to occur for several reasons, but I think psychological (especially if the "slow boiling the frog" theory is correct) would be the most important.

In any case, we'll stay on top of it, but the main point of all of this is to keep your eye on the ball or the prize at least for this trend's move, we have positions in place for this move, I don't intend on making any significant changes until this move has served it's purpose and we move to the process of setting up or finalizing preparations for the real prize (as I have been saying, even though we are hitch-hikers on this move, it's just a means to a larger end- allowing us excellent, high probability, low risk entry in to new short positions or to fill out existing core short positions).

Pre-Market

It was actually a fairly quiet overnight session compared to what's been going on this week especially in China with banking liquidity lock-ups.

In any case futures were pretty dead until about 7 a.m. when they just kind of took off.

Interestingly, in addition to the 3 F_E_D speakers we've already seen this week, today we will hear from another three,  Dudley, Lockhart and Powell, perhaps they continue to jawbone the market higher as suspected last Saturday, well that was just rumors in the WSJ I expected, not the surprise we got.

Here's what futures look like going in to the open.
 ES 1 min flat overnight, but in to a small triangle that broke out around 7 a.m., everything right now is inline.

NQ 1 min, is a bit different as it is inline, but with a larger relative negative divergence, these are the weakest form, but I figured since it has a different look I'd post it.

ES 5 min is in line, NQ looks exactly the same so it may be interesting with the F_E_D speakers today.


Wednesday, June 26, 2013

Daily Wrap

This afternoon I laid out a theory in the "Strategic Update post", you can check it out. Basically the theory was the market's sort of dull performance may in fact be to keep shorts in place as the market "slow boils the frog" to launch a short squeeze at higher levels. This is exceptionally hard to prove, but it makes some sense.

For a second day we saw mediocre performance with the S&P up again just under 1% a,most exactly like yesterday, I don't believe in "coincidences" in the market and as you well know this was something that was already at my goat yesterday, a second day of it seemed to be beyond coincidence.

Anyone remember my email response from Saturday to a member as to what the catalysts may be, I said I thought the usual stuff, buyt F_E_D rumors wouldn't surprise me, yesterday we got even better, we had two known F_E_D hawks talking like doves, for a 2nd day in a row we had another F_E_D hawk, Lacker, doing the same. How did I know that last Saturday? Well I didn't, but looking at the way the market is set up, it seems to me that something more than just a short squeeze would be needed to change short term retail sentiment and I figured some dovish F_E_D rumors would do it, I didn't expect 3 hawks to come out in 2-days and sing the doe song!

As a reminder, here's the exact email question and answer from Saturday (almost 5-days ago)...

Member: "This suggests the bulk of the upside will have to come from a combination of upside biased HFT algos, short covering panics and, eventually, bulls jumping in long on the assumption the market has reversed. "

My Answer: "That's the obvious stuff, but I wouldn't be surprised if the F_E_D let a rumor slip, picked up by the WSJ that helps, remember they have a lot closer relationship than they disclose as evidenced by the minutes being emailed to 154 trading firms over a day early. They'd rather see them make money in the market than have to bail them out.

That's just one theory, but there could be numerous things along those lines."

And here we are 3 days in to the week with not one, not two, but 3 known F_E_D hawks, talking down the QE Tapering fears, essentially talking the market up!


As far as some risk assets HYG High Yield Corp. Credit showed almost tick for tick relative strength vs the SPX again today, the important thing is it's not leading negative. DHY / High Yield credit and the first of the credit assets to run scared because of its low liquidity was actually putting on a show today, even more so than yesterday... take a look.
 HY Credit was positive yesterday, but today this illiquid credit that I don't think anyone would bid up without a god reason, was indeed bid up today which to me (considering the liquidity risks) means that someone see the bigger picture (I'm not talking about the ultimate big picture as in the market crashing) the next tradable trend which I believe we have started already (up) although I never believe nor have a often seen a market just move in one direction. I think people have a misconception when you say, "I think the market is going to see a strong move up", they expect that every day, every hour the market will do nothing but rise, that's just not true. For instance lets just take a look at a STRONG down trend.

Even knowing at the time this was a horrible period with 90 year old investment houses failing and inter-bank liquidity completely seized up and adding to that the benefit of hindsight, I think at first glance no one would argue this was a nasty down trend and I think few would think that they would have been shaken out of their shorts.
 Late 2008 in the SPY/SPX, I think if you asked most people "What would you have done, knowing the period was horrible at the time, would you have held your short?" I think most people with the benefit of hindsight would have said without hesitation, "YES, of course! Look at that down trend, there's nor reason the let go of a short there!"

However when looked at in a moire realistic way, forget about intraday volatility that just scrapes away at your nerves, just looking at the daily trend, let me give you some facts and see if your answer would be the same...
During this period we had 16 down days and 14 up days, it would have hardly felt like a downtrend when you are living at the right edge of the chart not knowing what comes next. And as bad as the down move was, did you know there were 3 days of approx. +2% gains, 1 day of 3% gain, 3 days of nearly 4% gains and 1 day with a +14.5% gain? Not knowing what was coming the next day or the next few weeks, do you still think you'd have the nerves of steel to hold a short as you watched the market march higher all day for a 4% gain on the day or a 14.5% gain? Looking back in hind sight and putting yourself in the moment are two very different things.

This is what I mean when I say, "Wall Street will never make it easy", I think you need to have an edge that you trust to get you through those 3 and 4% up days.

 As for sentiment, even though the EOD saw Street sentiment fade toward the EOD//close, it is still in an overall, very powerful place suggesting a strong move if you can live through the volatility.

HIO shows something very similar, both in the trend and EOD today. I'd suspect that tomorrow will see some downside moves to shakeout those who feel confident in a move higher (as few as that may be) and give confidence to the perma-bears.

Interestingly, on an intraday basis (Yields are still positively dislocated from the SPX when looking at a slightly longer term along the lines of a move up represented by 30 min positive divergence in the Index futures) Yields came down before closing early and not too long after the market came down in to the EOD, I do think this had a lot more to do with psychological warfare being waged at SPX $1600, but TLT is a known SPY arbitrage asset used for short term manipulation.
There it is, Yields intraday as a magnet would suggest we see downside early tomorrow or at least early tomorrow and maybe them some. I'm not going to get in to TLT here tonight, this deserves a post of its own.

Commodities didn't work with the SPX again this week, but rather (unlike the SPX) followed their legacy arbitrage correlation with the $USD, the SPX is actually stronger than the $USD correlation would normally allow for, take that, take sentiment above, take HY credit, especially HY (illiquid) leading positive and you have some very bullish undertones in the market and seemingly institutional money aware of what to expect which thus far has been the same as what we've expected and as for the 3 F_E_D hawks, turned Doves this week so far, again as I made clear on Saturday in my expectations for this week, I DON'T THINK THERE ARE ANY COINCIDENCES AT WORK HERE!

I mentioned above the possibility or even probability of some downside tomorrow, but at the same time I've shown you several assets above that argue for a bigger move, just like the 2008 chart I showed you (the downtrend), nothing is as easy as it sounds, it takes faith and faith is only differentiated from hope by objective data.

Take VXX for instance, short term as in perhaps tomorrow, we have an intraday positive building, since the market moves opposite the VXX, that would suggest that VXX moves up and the market down.
 VXX 2 min leading positive this afternoon, but remember this is only a 2 min chart, still enough to move the market tomorrow in a way that might make you doubt your data and probabilities,  but if you go to where the stronger probabilities are (just like the 30 min positive Index futures across the board and consider Credit above, and the other things I've pointed out so far, then...

This 10 min leading negative of VXX would suggest the highest probability trade here would be to sell short VXX or buy puts in to any short term strength as this chart makes clear a leading negative 10 min (institutional timeframe) divergence that fits well with all of the other information we have. These are hard moves to make, selling short in to strength, but we need to look past intraday action, we need to look at data objectively and put emotions aside, the hard trades to enter are often the best performers.

As far as confirmation in the SPY, take a look.

 The 2 min chart, like VXX is not exceptionally strong in its negative posture, but it's enough for a short term move which could be part of the day, maybe the entire day, but again if we come bask to the higher probabilities and in this case I could go to 5 or 10 min charts, but I don't have to...

A simple 3 min chart, stronger than a 2 minute shows a strong relative positive and leading positive divergence with NO DAMAGE done to it today at all, suggesting whatever short term weakness may be there, is capped at a very weak 2 min chart (at least in the context of the overall data we have).

Take the Q's as a confirming example...
 The 2 min QQQ again has a negative divegrence at the EOD, it's probably enough to have an effect on the market tomorrow, but once again, I don't have to go far to see where the probabilities are (just like that SPY downtrend I showed you, you can think of these 2 min charts as the chop up and down, but the main trend of a loss of -26% in the example above is on the higher probability charts and again I don't have to go far to find it.

Another 3 min chart leading positive at a new leading high!

I said I didn't need to, but I can go to a longer chart like 5 min and see very strong probabilities, so as I have said before, you have to be careful when you watch the market all day, every day ,not to "GET LOST IN THE LINES", in other words, get so emotional about intraday and day to day volatility that you miss where the trade is like the -26% move down in that short period of 2008.

Tonight's Dominant Price/Volume Relationship in all four major averages (this is the relationship between price and volume for all of the component stocks that make up and average like the Dow-30 or NASDAQ 100-NOT the average's price and volume itself) is in line with what we see on the 2-min charts, the Dominant (meaning overwhelmingly obvious) relationship in all 4 averages is the most bearish for the short term (as in the next day), of the 4 possible outcomes, the dominant relationship for all 4 averages is Price Up / Volume Down.  More often than not, this is one of the best indications of a 1-day overbought market, I use overbought very loosely because the price/volume relationship is a lot more elegant than a simple "overbought/oversold.

As far as Precious metals go, a strong divergence doesn't just fade away that easy, just like a 4% move up in the 20098 SPY downtrend didn't change anything in the trend, I don't think last night's move in precious metals as China opened will have any lasting effect on the expected trend and outcome for Silver and gold (SLV and GLD). For example...
 This is the Silver 5 min 3C futures, very positive on today's move

And the longer term or highest probabilities on a 30 min Silver futures is pretty clear as well, this is why I don't panic over a move like last night's.

 This is the Gold 5 min futures, it looks almost exactly the same as Silver's.

And the 30 min gold futures, it's not just the quality of the divergence, it's the confirmation between the two assets as it remains the same (both positive) as it was Tuesday.

As for tonight,  the Nikkei futures look strong, however the 3C charts in the 1 and 5 min timeframes aren't supporting price so I don't know if the Nikkei will end the day on a solid note, I personally wouldn't put money on it because that's not where the short term edge is.

This is only a 1 min chart, but as I said, the 5 min isn't backing price either.

Of course it's very early in the night and a lot can happen, but the divergence on the 1 min chart in the Nikkei futures have been right on, both positive and negative so despite price seeing a parabolic move up right now, this isn't the edge that we look for, this is the kind of position that we pass up (unless this were to change and give us a real solid edge).

ES has a similar negative 1 and 5 min, as does NQ and TF (the 1 min in this case is much worse than the 5 min, the Nikkei they are about the same). However where it really counts at the 30 and now even the 60 min charts, all Index futures are still on very solid footing, there has been no damage whatsoever to those charts and for me, that's all I care about in the current positions and even more as a means to an end, the BIG PICTURE, setting up shorts for a primary trend down.

That's going to do it for tonight, I'll be back in the a.m. to check the futures, we'll see if there are any overnight surprises, with volatility as high as it is, I wouldn't be the least bit surprised. It's the 30/60 min charts that are the anchor that relieves me of surprises.


Psychological Warfare

There are 3 types of market analysis, Technical, Fundamental and Mass Psychology with the latter being the least understood and perhaps the most important.

I often say if you want to work in the market as a trader, don't take economic at college, that's all  theoretical garbage and they are the only group with a worse track record than the weather man.

Tell me, what do you see on this chart that has to do with mass psychology?

What do you see that would keep a short in place and give them hope? What has the market been doing all day and what changed that in the last few minutes?


Let me give you a hint. When you go to the store or shop anywhere, EVEN GARAGE SALES...

 (Believe it or not I took a 2 week course in Baltimore on the entire subject of sales from what color scheme businesses use, such as fast food- Red and Yellow, red is the first color your eyes focus on and yellow is associated with hunger. Now thing, McDonalds, Burger Kind and Wendy's all use what two colors?)

What are the last two digits of nearly every price tag? They are 99, whether $1.99 or $199,999 (house price). It really makes a difference.

So what's the important number near the close on this chart that fits with my earlier post, "Strategic Update"?

All of the Index Futures have that 1 min negative still

As doe the averages, the QQQ is the only one to really look mostly in line as if it could keep on going, but I suspect this is as my theory laid out a few posts ago, the moderation that makes shorts happy at the EOD, keeps the gain there, but nothing that is shocking-currently at +1.08%.

AAPL Charts

Here are the charts....
 1 min AAPL intraday

2 min trend

Close up intraday of the 2 min chart, there was a slight move below recent support, stops or orders were hit as volume spiked up and 2C gained ground in the area.

5 min trend, the divergences loo squashed because of the volume pane open.

 Close up of recent 5 min action, the break below the psychological $400 level seems to have been a key area for positive divergences, you'll see toward the end.

 10 min overall trend is actually quite clear, negative at the counter trend bounces and positive in to the move below 2 triangles and $400.

As we made that move under $400, the longer charts went positive, there are few charts positive in the 30+ min. area.

 I noted the 60 min going positive yesterday, today it added to it and...

Unbelievably to me, we even have a 2 hour positive chart now as AAPL is in a flat range, EXACTLY where I was telling you yesterday to "Be Careful", this is where institutional money is quietly at work .

Still LOVING AAPL Long- at least for a TRADE

Here are the charts, if I could add or needed to fill out a long (I have an open call and open long equity position) I would.

Take a look, I'll get charts up ASAP, but it has now added the 2 hour timeframe to its positives.