For a second day we saw mediocre performance with the S&P up again just under 1% a,most exactly like yesterday, I don't believe in "coincidences" in the market and as you well know this was something that was already at my goat yesterday, a second day of it seemed to be beyond coincidence.
Anyone remember my email response from Saturday to a member as to what the catalysts may be, I said I thought the usual stuff, buyt F_E_D rumors wouldn't surprise me, yesterday we got even better, we had two known F_E_D hawks talking like doves, for a 2nd day in a row we had another F_E_D hawk, Lacker, doing the same. How did I know that last Saturday? Well I didn't, but looking at the way the market is set up, it seems to me that something more than just a short squeeze would be needed to change short term retail sentiment and I figured some dovish F_E_D rumors would do it, I didn't expect 3 hawks to come out in 2-days and sing the doe song!
As a reminder, here's the exact email question and answer from Saturday (almost 5-days ago)...
Member: "This suggests the bulk of the upside will have to come from a combination of upside biased HFT algos, short covering panics and, eventually, bulls jumping in long on the assumption the market has reversed. "
My Answer: "That's the obvious stuff, but I wouldn't be surprised if the F_E_D let a rumor slip, picked up by the WSJ that helps, remember they have a lot closer relationship than they disclose as evidenced by the minutes being emailed to 154 trading firms over a day early. They'd rather see them make money in the market than have to bail them out.
That's just one theory, but there could be numerous things along those lines."
And here we are 3 days in to the week with not one, not two, but 3 known F_E_D hawks, talking down the QE Tapering fears, essentially talking the market up!
As far as some risk assets HYG High Yield Corp. Credit showed almost tick for tick relative strength vs the SPX again today, the important thing is it's not leading negative. DHY / High Yield credit and the first of the credit assets to run scared because of its low liquidity was actually putting on a show today, even more so than yesterday... take a look.

Even knowing at the time this was a horrible period with 90 year old investment houses failing and inter-bank liquidity completely seized up and adding to that the benefit of hindsight, I think at first glance no one would argue this was a nasty down trend and I think few would think that they would have been shaken out of their shorts.

However when looked at in a moire realistic way, forget about intraday volatility that just scrapes away at your nerves, just looking at the daily trend, let me give you some facts and see if your answer would be the same...

This is what I mean when I say, "Wall Street will never make it easy", I think you need to have an edge that you trust to get you through those 3 and 4% up days.


Interestingly, on an intraday basis (Yields are still positively dislocated from the SPX when looking at a slightly longer term along the lines of a move up represented by 30 min positive divergence in the Index futures) Yields came down before closing early and not too long after the market came down in to the EOD, I do think this had a lot more to do with psychological warfare being waged at SPX $1600, but TLT is a known SPY arbitrage asset used for short term manipulation.

Commodities didn't work with the SPX again this week, but rather (unlike the SPX) followed their legacy arbitrage correlation with the $USD, the SPX is actually stronger than the $USD correlation would normally allow for, take that, take sentiment above, take HY credit, especially HY (illiquid) leading positive and you have some very bullish undertones in the market and seemingly institutional money aware of what to expect which thus far has been the same as what we've expected and as for the 3 F_E_D hawks, turned Doves this week so far, again as I made clear on Saturday in my expectations for this week, I DON'T THINK THERE ARE ANY COINCIDENCES AT WORK HERE!
I mentioned above the possibility or even probability of some downside tomorrow, but at the same time I've shown you several assets above that argue for a bigger move, just like the 2008 chart I showed you (the downtrend), nothing is as easy as it sounds, it takes faith and faith is only differentiated from hope by objective data.
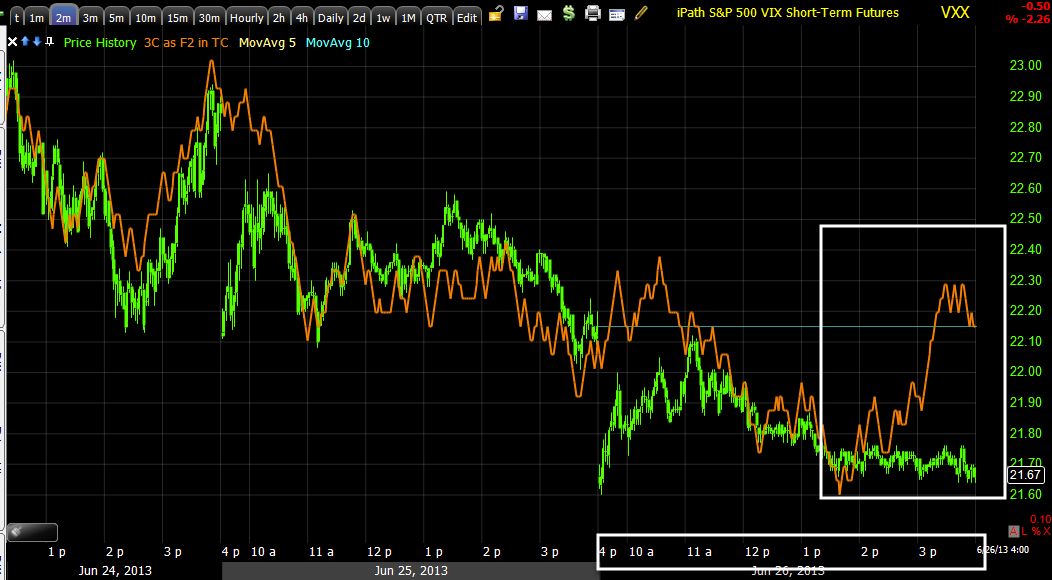
Take VXX for instance, short term as in perhaps tomorrow, we have an intraday positive building, since the market moves opposite the VXX, that would suggest that VXX moves up and the market down.

As far as confirmation in the SPY, take a look.


Take the Q's as a confirming example...


Tonight's Dominant Price/Volume Relationship in all four major averages (this is the relationship between price and volume for all of the component stocks that make up and average like the Dow-30 or NASDAQ 100-NOT the average's price and volume itself) is in line with what we see on the 2-min charts, the Dominant (meaning overwhelmingly obvious) relationship in all 4 averages is the most bearish for the short term (as in the next day), of the 4 possible outcomes, the dominant relationship for all 4 averages is Price Up / Volume Down. More often than not, this is one of the best indications of a 1-day overbought market, I use overbought very loosely because the price/volume relationship is a lot more elegant than a simple "overbought/oversold.
As far as Precious metals go, a strong divergence doesn't just fade away that easy, just like a 4% move up in the 20098 SPY downtrend didn't change anything in the trend, I don't think last night's move in precious metals as China opened will have any lasting effect on the expected trend and outcome for Silver and gold (SLV and GLD). For example...


As for tonight, the Nikkei futures look strong, however the 3C charts in the 1 and 5 min timeframes aren't supporting price so I don't know if the Nikkei will end the day on a solid note, I personally wouldn't put money on it because that's not where the short term edge is.
This is only a 1 min chart, but as I said, the 5 min isn't backing price either.

Of course it's very early in the night and a lot can happen, but the divergence on the 1 min chart in the Nikkei futures have been right on, both positive and negative so despite price seeing a parabolic move up right now, this isn't the edge that we look for, this is the kind of position that we pass up (unless this were to change and give us a real solid edge).
ES has a similar negative 1 and 5 min, as does NQ and TF (the 1 min in this case is much worse than the 5 min, the Nikkei they are about the same). However where it really counts at the 30 and now even the 60 min charts, all Index futures are still on very solid footing, there has been no damage whatsoever to those charts and for me, that's all I care about in the current positions and even more as a means to an end, the BIG PICTURE, setting up shorts for a primary trend down.
That's going to do it for tonight, I'll be back in the a.m. to check the futures, we'll see if there are any overnight surprises, with volatility as high as it is, I wouldn't be the least bit surprised. It's the 30/60 min charts that are the anchor that relieves me of surprises.


No comments:
Post a Comment