Monday, October 28, 2013

Financials / FAZ Position Update

About a week ago FAZ (3x Financial Bear) was entered (long), since there have been updates on 10/22 and 10/23, the position is just in the green and I still like it.

Here's a view of XLF which is the Financial Industry as well as the 3x leveraged ETFs, FAZ and FAS (3x bear financials and 3x Bull Financials respectively). I also looked at the 2x leveraged UYG (long) and SKF (short) and found the same confirmation.

XLF-Financials
 1 min intraday

3 min intraday

5 min, more trend and a much more important timeframe.

XLF 15 min with a previous cycle (accumulation, mark up, distribution and decline).

 XLF 60 min with continuing deterioration with lower 3C highs at higher XLF prices.

FAZ 3x Financial bear- this should look almost the mirror opposite for confirmation.
 FAZ 3 min intraday leading positive, pretty sharp and very recent.

FAZ 10 min trend, note the strength pick up at the 18th.

FAZ 60 min is pretty self-explanatory.

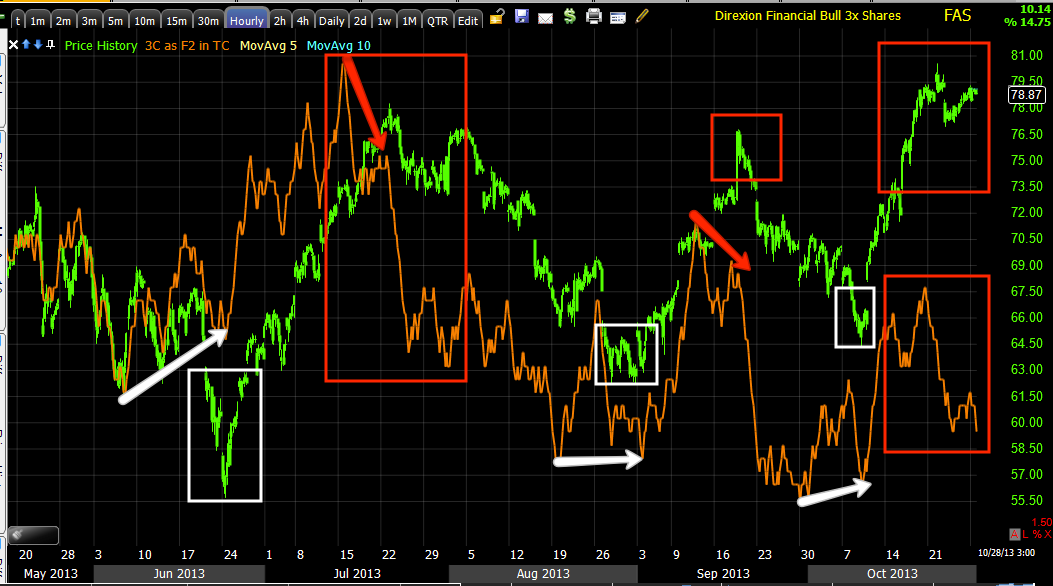
FAS 3x long Financials, this should look similar to XLF for confirmation and opposite FAZ above.

 2 min intraday leading negative, I consider this to probably be connected to FAZ's 3 min leading positive.

FAS 3 min leading negative, similar to FAZ's 3 min leading positive.

FAS 15 min with accumulation for the cycle in to the low at 10/9 which is a theme we see everywhere and negative at the 18th, again a common theme. These themes are seen, but I've seen few that are so clean and consistent through varying and very different asset classes.

Longer term FAS 60 min, this shows previous cycles like the XLF 60 min, accumulation, mark up, distribution and decline, right now we'd be in distribution and borderline decline.

All in all, I still like FAZ long or SKF long or for less leverage XLF short or for more leverage, XLF calls, although I haven't checked on their liquidity.


AAPL Position Update

Well it's not the Icahn/Ackman CNBC shouting match, but it in funny or whatever the appropriate word might be... "Ridiculous"? to watch two billionaire's have a spat over... TWITTER, just think about that a second, they are having a slap fight over Twitter! I think Ridiculous is the right word.

 Icahn responds to Gross...
 Now it's turning in to, "Who is more like Bill Gates", but at least Icahn was pretty much restrained and didn't come undone, I sure wouldn't want Gross as an enemy even if I was Icahn.

As you know AAPL reports for Q3 after the bell tonight, this might be a good time to take the just about double digit gains in the AAPL December $535 put, I have decided (so far) to stick it out, but that is subject to change if I see something that gives me good reason to cut and run.


 AAPL 1 min intraday isn't very telling at all, a little surprising considering earnings, I'm sure this will pick up later.

The 3 min chart is nearly perfectly in line with price on an intraday basis and that would be a downtrend for the timeframe we are looking at, but watch what happens when I take the EXACT same chart and zoom it out to scale to reveal the chart's trend...

 All of the sudden the very same chart shows accumulation in to the 10/9 lows which is a market wide theme  and it shows distribution or a leading negative divegrence at the 10/18 (Friday) which is also a market wide trend.

So AAPL looks VERY much like the broader market in 3C and price which just goes to show that the market is the main gravitational force on price movement of an individual stock, even AAPL so check out the market's probable trend before looking for specific trades, you'r probabilities go way up.

The 5 min chart shows the same leading negative divergence, I think if it showed something more positive and less like the overall market I'd suspect an AAPL leak. I'm not sure what consensus is for AAPL, but just being on the street, I'm going to guess they come in light on handsets with Samsung's Galaxy 4 taking away some business, I've been seeing a lot of them lately.

 This 15 min chart is probably the best reason I have for the put position, it's not meant to be a long term trend trade and the chart is leading negative and right around the 18th.

The larger chart where I think Icahn actually started shows a large "W" bottom that we followed with interest for months, first assuming it was a counter trend bounce and then when it widened it's base with the second "W" low, it appeared to be something more serious and I suspect that's a lot of ICahn and some other players noticing the change in character and guessing AAPL is oversold. The point is, the longer term trend at 4 hours is still in line, maybe that changes, maybe Icahn and Gross go at it over AAPL via Allianz, I have no idea, but this is why I'm not interested in a trend trade here or now.

I'll update you if I do decide to make any moves in AAPL before the close.


Market Update- So Far No Surprises

So far there haven't been an special surprises in trade, overnight trade looked like it was going to be a stronger day, but a rising $USDX nipped that in the bud this morning.

Very short term (intraday) there are 1 min positives in the Index futures and 5 min negatives, this falls right along the lines of expectations from Friday that today would be another noise day within the overall trend starting at the 10/9 lows with a chance for a head fake move.

Leading Indicators thus far (admittedly early) show HYG and JNK credit underperforming; HYG never recovered from the negatives that started building on 10/18. Sentiment Indicators are both underperforming, the VXX is outperforming and still looks like it's putting together a healthy base, including VIX futures and Commodities are underperforming.

Other than that, so far there hasn't been anything standing out as uniquely interesting, it's more or less what I imagined on Friday as we flop around the Friday close, a bit below or a bit above. I will say some of the short term 3C intraday signals are looking pretty good for the IWM so that might be something to keep an eye on, otherwise my update would really be, "Not much happening".

MCP with a GS Sell Signal, Maybe a Bottom Coming...

The last time we traded MCP we closed it October 2nd ( a short term trade) for a +38% and +58% return. The last time I wrote about MCP was October 4th, but I've kept an eye on it since then.

MCP has been looking like a large, long term base, but on October 4th after looking for a pullback that we got,  I had written,

"I don't or didn't feel strong about the action in underlying trade when the pullback took place yesterday so I didn't open a new position... This is the 5 min MCP chart, this is what I wasn't too excited about yesterday, it just seemed like MCP needed some more time to gather strength so I skipped the trade...  So far intraday we don't have the kind of support MCP needs to sustain a move higher so I'll set some alerts for a shallow consolidation and look to see if this situation has improved which may offer that SCBO." 

Here's what happened since...
 10/2 is when we closed out a trade and 10/4 is when I wrote the above, shortly after that MCP dropped out of what looks to be a large bottom/base on heavy volume.

 However the long term weekly chart shows this is still most likely a base going through a shakeout and with Goldman's sell signal on MCP now, it virtually guarantees they are trying to buy it on the cheap.

 Here's the range after the gap down and a break under the range today on the GS news.

Yet the hourly chart has been going positive since that gap down, I'd suspect GS has been involved here long before today.

Still the shorter term charts need to catch up like this 10 min, but I'd definitely keep MCP on your long watchlist and keep an eye out for that reversal process.

GOOG

GOOG is interesting for the opposite reason of Priceline, it's the lack of a change in trend that makes GOOG interesting, but it's still the $1000 level that is key to the analysis like PCLN.

 For several quarters on this weekly chart there was an obvious range in GOOG and the obvious target was $1,000, but I just didn't see how it was going to get there on it's own, then came earnings and the work was all done , the move above $1,000 was no coincidence, never underestimate the subconscious and its affinity for whole numbers, that's why every retailer in America never uses a whole number, instead of $10, the price is $9.99- honestly, think about that. What does that 1 cent really mean? Well for retailers it means the difference between someone thinking something is a bit expensive at $10, but in the 9's it's not so bad.

It's the same with stocks, but in a slightly different way, stops and limit orders, etc all congregate at these whole numbers, people don't think "I'll put a limit at $987.31. the think $1,000.

So in any case, the important thing about GOOG is the work is done, it reached the area even though it didn't look like it would, that's not coincidence.

 This is the current daily chart with a large gap, normally in the past we'd consider this a break away gap, but times have changed and with them, gaps. Unfortunately now, most gaps get filled which is a shame because gaps contained so much information and reliable levels.

Here's where GOOG gets interesting...
 It takes a lot to move a 4 hour chart and there was a clear trend before earnings of distribution in the range, even if the 4  hour chart was to confirm the upside move, I'd expect it to take a few weeks longer, but I don't think that will happen.

 Note the 2-hour chart shows the same distribution pattern in the range, also remember that ranges are where we often see distribution or accumulation depending on the preceding trend, they look quiet, but they are actually quite busy.

 And the 60 min chart shows the same pre-earnings trend, this is interesting to me because there's a lot of confirmation of what was going on and a 60 min chart could have easily confirmed the upside move by now, in fact it could have done it in a day, it would be rare, but it has happened before, but no hint of confirmation which suggests there's no support up there beyond pegging GOOG in place to basically carve it up..

 Here we have the same pre-earnings trend on a 15 min chart, this could have confirmed the upside move in a day easily, but nothing even close to that.

 Even a 0 min chart shows the same pre-earnings trend and at best is pegged laterally right now. I believe this peg is to hold GOOG in place to distribute large chunks at a fantastic price that is really like a gift to Wall St. or anyone trading in their foot-steps.

 Even a 3 min chart!!!

With GOOG I'm not so focussed on a move to $1100, it's not really necessary and I don't know if GOOG would have what it takes as it's being carved up, but what I would be on the lookout for in concert with a nasty market day would be a distribution or churning day. 

To the left I drew a few possible candles that might be seen on such a day and the trendline would represent current price, so a gap up and a Shooting Star, Hanging man or a Long Legged Doji/Star.

The other possibility (I removed the current price so we could act like what is to the left is the range of the current price, this would be a Key Reversal day, it could take on several different candlestick patterns, but the key is a new high and a close at or below the previous day's close, May 22nd is a good example in the market averages.

The key to all of these price patterns is LARGE VOLUME, that's the churning element of it, so that's what I'd keep an eye out for in GOOG and I think a stop can be placed above the most recent intraday high so risk is actually quite minimal, I just wouldn't make the stop too close or too obvious.

I do think GOOG is a very high probability set up so I'd keep an eye on it, put it on your watchlist.


PCLN

PCLN looks interesting for a number of reasons, first of all if we were below $1000, I'd say $1000 and above is a huge psychological magnet and I'd expect to see some real distribution above that level. PCLN $1000 is sort of like Dow $10,000 if anyone can remember back that far, it was just such a magnetic level you knew once we were within 800 points or so, we were going there and we crossed in to the $11,500 territory before coming back down.

Part of the reason PCLN is interesting is because we see what I'd expect to see at $1000+, the other part is because PCLN is a trade that can come to you rather than you chasing after it.

 This 60 min chart shows the 3C trend with price, what's interesting is how well the uptrend had good 3C confirmation. I can pick out small divergences here and there that created pullbacks and new legs up, but the trend is what is the centerpiece here, I hope I didn't draw too much over 3C to the right, but you can clearly see 3C fall off right above $1000 as I'd expect (yellow trendline) and there's more work to do here, but that's fine because the same goes for the price pattern, I think ultimately PCLN will take out $1100 (orange) before it's ready, but that's an alert I'd be setting today, I already have.

 The 30 min chart has more detail and the distribution above $1000 is obvious, it's such a magnetic level. In fact the initial selling above $1,000 sent PCLN back under $1000 briefly, You can see a triangle taking shape, I doubt this is the final price pattern, but I think it is part of it.

Here's the 125 min chart with the dip under $1k and continued distribution above and as we make our way higher. $1100 being a centennial number will act as a magnetic area as well, I'd guess there's a very good chance for a head fake move >$1100 so that is an area I'd set a price alert for.

This is the first solid change in trend on a 60 min chart that really stands out so I don't think we are too far away from an excellent entry (short), the higher the better for profits and for risk as the stop can be a lot tighter.

A.M. Observations

Not much of actual note happened overnight, yet futures (ES) ramped about 8.5 points until the $USD started to strengthen around 5-6 a.m. sending futures lower to just about Friday's close, expectations thus far for today have not changed, I still expect a noise-like day with a  chance for a head fake move, but we may stay a little flatter for a little longer considering the F_O_M_C coming up.

No one seems to think the F_O_M_C will taper, the pundits believe they are turning more dovish, will hold off on a taper or even increase the size of asset purchases, I think the pundits are useless.

Lets see how a.m. trade goes and I'll get PCLN and GOOG, probably AAPL out as well.

Have a great day

Sunday, October 27, 2013

The Week Behind and the Weekk Ahead

Good evening,

On a quick personal note... I'm not sure how many of you live in Florida, but apparently my health care provider, B_C_B_S has cancelled 80% of all of their Florida policies this week, some 300,000 so far apparently because the policies don't meet the minimum O-Care criteria...apparently. I'm not sure if mine has been cancelled as I have not received a letter, however it just makes me think more acutely about how screwed up this entire O-Care mess is. I do believe we were told if "We like our current insurer, we can stay with them", I've been with mine over 10 years and intend on staying with them, however if I were cancelled right now, because O-Care's "No pre-existing condition denials" is not yet in effect, I'd basically be without insurance until O-Care came online if that ever happens as I see there are  4 lawsuits regarding a legal glitch in the law,  you must buy insurance... "through an exchange established by the state.", but 36 states have decided against opening exchanges for now. LA Times has the complete story, it looks like the biggest threat to the system yet.

In any case, this would be more than a slight inconvenience for me, I think about the hundreds of thousands of employees that have already been effected and whether this law succeeds or fails, the damage in many cases is already irrevocably done. I'll leave it at that for the time as my personal feelings aren't pertinent to anything we do, but I do think this will be an economic issue much larger than it already is not to mention a founding document that seems to be less and less relevant every year, it starts with a "C".

OK, a quick look back at last week...

Gold had its best 2 week run in nearly 2 years, again I think there's mounting evidence for a sub-intermediate, perhaps intermediate and maybe even a primary uptrend in gold. This is not as an easy of a trend call to make as 2011 because the "would-be" base is not the same size (perhaps it will be though).

Meanwhile, Dr. Copper saw a -1% decline and Crude saw a -3% decline on the week, obviously this was not the week for bullish growth prospects.

Other than a few standout headline earnings, they were generally weak. I have some interesting information about the most important part of earnings, "Guidance" and the number of companies raising versus lowering guidance has been on a negative trend since Q3 of 2011, however it is now just a hair away from hitting new lows since we entered this uptrend in 2009.

In addition, US Macro vs the SPX doesn't look good. 
 Not only is US Macro turning down, but note the series of lower highs. If you look very closely you'll see the improvement each year near the new year as the arbitrary "Seasonal Adjustment" period begins, we see this every year for the first quarter at least.

The Bloomberg US Economic Comfort Index just plunged very dramatically.

And I thought this quote was a nice segue to the next chart, especially toward the bottom...


That brings us to NYSE Outstanding Margin Debt
 Which is now at an all time new high, this means investors are essentially robbing Peter to buy Paul, it also means any sudden shocks in the market will likely be GREATLY amplified. A correction of say 7% may easily move to -20% (I just use that as it's the media's favorite metric for measuring a decline.

Some more evidence from Rydex with regard to risk taking and some commentary below...

I'd say the ship is lop-sided and when the ship is lopsided it doesn't tend to stay that way too long, the market is a zero sum (for lack of a better word) "game", for one to make money one has to lose money. It's pretty hard for everyone to make money trading in the same direction, Wall St. usually settles that as it's really a feast or perhaps a "slaughter" would be a better term.

And where is the money coming from to chase these "Risky Assets"? This is the Rydex Money Market trend...

THIS WEEK SPECIFICALLY, ONCE AGAIN AS WE SAW IN JUNK CREDIT AND SIGNS IN HYG, CREDIT IS NOT BUYING THE EXUBERANCE EQUITIES ARE.

 Note that the move off the October 9th lows is showing Credit Diverge roughly at the same place the 3C divergences get very strong and in the "Reversal process" as well as a number of other leading indicators. The 18th of October is when we noticed something big was changing, that's just about exactly the same as credit above.


Since there are so many metrics around lately showing how this market is at a bubble, over-inflated, blow-off, I thought I'd post Warren Buffet's Indication of a Bubble, US Stock Market Total Capitalization vs. Gross National Product, which is currently at 110% which the the highest level since the NASDAQ's 2000 top.

More specifically Friday my gut feel was Monday would likely look something like Thursday and Friday which I termed as "Noise within the trend" which is still lateral with the SPX showing a daily candle very close to a bearish reversal Hanging Man and right in the range of resistance from 10/22. The Russell 2000 is nearly identical except the close was lower than the open; and the NDX is very similar to the Russell 2000, none are textbook Hanging Man, but again the point is not to memorize a textbook illustration, it is to understand the premise that each candle stands for.

Price/Volume Relationships were all over the place, there was no Dominant theme, except Volume Down was present in 4 of the 5 major averages, the close was mixed (these are the component stocks of each major average, not the average itself)

The SKEW Index remains elevated at 135, about the same as the previous two days.

The VIX was VERY clearly used to "Bang the close on Friday (HYG and TLT did NOT cooperate), the Spit VIX fell off at 3:30 along with VIX futures and VXX of course.
 Friday's CLEAR "Bang the Close" with the VXX nose-dving at 3:30 p.m.

The longer trend of the VXX vs the SPX (which should be mirror opposite) shows VIX/VXX strength as the market is above the red trendline start to the left, the VXX should have moved below its red trendline at the arrow and continued lower, but it appears a bid for protection kept price up via the supply/demand mechanism.

Sentiment indicators were mixed, 1 in line, the other moving opposite the SPX which I don't find surprising given expectations, where the market is and the recent range bound activity.

Yields as a leading indicator were negative Friday and overall since the 10/9 trend are very negative. 

I also noted High Yield Credit refused to follow the "Bang the Close and instead went the opposite direction rather than staying put.

The EUR/JPY was once again dominant in guiding the market Friday, I did show a chart of the pair vs the SPX falling off a bit in to the afternoon, however it opened with a bang tonight obviously helping overnight futures at least for the time being.

Finally of note last week was the F_E_D's warning regarding "Lax leveraged loan underwriting", in a round-a-bout and not so obvious way, whether the F_E_D tapers or not, "Bubble" concerns are obviously growing which I think have been there since the 4th quarter of last year.

As for Treasuries, I'm still hopeful TLT pulls back to the $100-$102 area where I'd like to establish a long term core position (long).

You may recall I opened a long TBT (2x UltraShort 20+ year treasuries) as I think a near term TLT pullback is probable.

The 1-day 30 year treasury and even 10 year Treasury futures look to have based and look set to make a move higher soon, this is a daily chart of each.
 30 year T. Futures 1-day

10 year T/ Futures 1 day chart, both seem to have a nice bottom in place, but again I expect a short term pullback in TLT (20+ year treasuries) and that's why I opened the long TBT on Friday.

I think gold is another longer term long play, personally I'd wait for a pullback before entering a new position or adding, but it looks like it may be good at least for an intermediate trend which can last 6 months or so.

 Daily GLD chart shows massive positive improvement at the recent lows...

The 30 min chart shows a strong trend, this is why I'd likely buy in to any pullbacks to fill numerous gaps.

I'll have PCLN, GOOG and perhaps AAPL updates in the a.m., I'm seeing interesting activity, especially in PCLN and really GOOG as well.

As for tonight, the EUR/JPY opened higher so it was no surprise to se Index futures open higher. There are 1 min negatives through all Index futures, but that's short term overnight jiggles, the more important 5 min chart is negative as well, but as I said Friday, the continued character of Thursday and Friday in to Monday would be my expectation as well as the fact the rounding area is larger so we lost the head fake move as it was absorbed in to the larger area which prompted me to question whether we'd see a new head fake move on the upside  just because they are so common, about 80% of all reversal on just about any timeframe display this behavior which happens to be an excellent reversal timing marker.


I believe the Tuesday PBOC (we'll know early Tuesday morning or Monday in the early a.m. hours) liquidity injection will be a defining event for Tuesday as they have skipped 3 consecutive injections, with Norway and Sweden just deciding to place rates as is and Canada taking a slightly more dovish tone, I would not be surprised to see the PBoC fail to inject for the 4th consecutive time and the market is clearly worried about that.

FINALLY.... we have the F_O_M_C meeting on Tuesday with the policy statement Wednesday at 2 p.m. AS ALWAYS, DON'T FORGET ABOUT THE F_O_M_C KNEE JERK REACTION.

I have no idea what the F_O_M_C will do, there are all kinds of predictions from "Nothing" to increasing Treasury purchases by $15 billion a month, my prediction is that they will raise rates last week... If that makes no sense, it's suppose to, I think it's just about as useful as all of these F_E_D predictions flying around.

It's also a faurly heavy Eco-data week, mostly front loaded with Industrial Production and Pending Home Sales tomorrow morning (9:15 and 10 a.m. respectively), we have the PPI and Retail sales pre-market on Tuesday and Business Inventories and Consumer Confidence at 10 a.m., that should keep us busy right in to the F_O_M_C on Wednesday.

I'll check the futures in the a.m. as there's not much to say right now except the Nikkei is catching a bid as I type.

HAVE A GREAT WEEK, STAY PATIENT, ON WEDNESDAY STAY CALM, these F_O_M_C knee-jerk reactions are emotionally moving, but have a high rate of failure which ever way they initially knee-jerk.

Look for the PCLN and GOOG analysis as well as AAPL too tomorrow a.m.