Monday, March 3, 2014

Market Update

There's not a whole lot to do right now unless you want to go long, I have a large tolerance for risk and I wouldn't dream of it, however as this move rolls over, then there's lots to do so until then it's monitor things., look for set ups, manage open trades, etc, but I really try to be patient and wait for odds and probabilities to realign.

Earlier I said there were quite a few differences between relative performance or the divergences put in place today. First I think we can probably rule out a larger "W" divergence, it doesn't look very likely.

Next I want to show you the strongest timeframe for each of the averages so you get an idea of the relative performance for this jiggle/bounce.

First I'll use the Q's as an example showing the strongest timeframe and then the very next longest timeframe and you'll see the one after the strongest is not a contender, it doesn't have the strength so if 3 min is the strongest, that will be it, the 5 min won't be much of an influence.

 QQQ 2 min is the strongest timeframe, the divegrence here looks very strong, but consider it's part of a day and it's only a 2 min chart, in reality it's not very strong at all.

Now the next timeframe after 2 min ...
 QQQ 3 min is in line more or less, there's no positive divegrence here at all, so you can see where the strongest timeframe is and when divergences stop dead in their tracks and get a feel for the relative performance moving forward the next several hours.

IWM 3 min is the strongest, still not as clear as the QQQ 2 min, but a slightly longer timeframe so I'd put these two on par with each other.

The SPY (as mentioned earlier) has the best looking intraday divergence and this is a 5 min chart for the SPY that is leading positive, it should see the best relative performance.

Now the DIA which was one of the weaker earlier...
 This is a 2 min positive, not that strong and not that big of a divergence, what I thought I'd also show you is the roof on this move, for instance take the stronger 5 min DIA chart below...

I don't know how far the DIA 2 min positive can travel with a leading negative 5 min chart that is a much stronger divergence and much stronger timeframe as well as a much larger duration divergence.

I hope that gives some perspective.

Gold and Gold Miners

I have short positions in both gold DZZ (2x leveraged Gold short) long and Gold Miners via DUST (3x leveraged short Gold miners), as you probably noticed today both GLD/gold and GDX/gold miners popped to the upside putting the DZZ long position at a -4% loss (which is a partial position that has room to add if I found a better entry that still had strong 3C signals) and the DUST long is at a -3.13% loss, both very acceptable for 2 and 3x leveraged positions for me.

However I want to keep an eye on these positions as I still don't know what the correlation between gold and the market is going to be as it has changed twice and this could be a thrid 180 degree change, but 1 day does not make a trend.

Here's what I have on both GDX (Gold Miners) and the related DUST (3x short Gold Miners) position as well as GLD (Gold) and the related DZZ (2x short gold) position.

 I'VE TALKED AT LENGTH ABOUT HOW I FEEL ABOUT GOLD LONG TERM, I LIKE IT A LOT, BUT I THINK IT IS STILL WITHIN THE BORDERS OF A LONG TERM BASE.

The bull flag of the last several days is very apparent, technical traders would see that if they were trading GLD, the pop today is an Evening Star, a bearish reversal star as there has been no ground gained between the gap open and the current price, it's a sort of loss of momentum and that is why the candle formation is considered a bearish reversal candle. Also note the increasing volume which in my experience makes these reversal candles about 2x more likely to work.

This would be an ideal head fake set up, just because of the very obvious bull flag which traders expect to break to the upside, leaving them holding the bag works as a bull trap head fake for downside price momentum.

The long term 60 min chart shows the large base I mentioned above and its range, there has been significant accumulation recently and we see that toward the end of a base, but my view is that GLD is going to pullback to the bottom of the base and maybe even run stops on a head fake move before making a breakout to stage 2 mark up so I'm short to sub-intermediate bearish and intermediate term to long term bullish gold.

 The 30 min GLD chart shows the negative divegrence that I think is part of pulling GLD back to the lower end of it's longer term base.

The 15 min GLD chart (as well as others) all confirm the same signals, in any case, I can't see GLD moving much further north with 15 and 30 min negative divergences, it has to in my view, at least pullback to build new strength, I just happen to look at the big picture and think that this happens at the bottom of the range near $114.

 The 5 min chart as far as timing shows the recent bull flag as being in a negative divegrence and today's gap up did not see any 5 min confirmation so it doesn't appear to be that strong, this makes the head fake scenario more likely.

The 3 min chart shows a positive divegrence Friday afternoon, however at 3 min vs 15 and 30 min negatives it didn't appear to be much of a threat, you can see it moved to confirmation of the gap, this is where we look for any new divegrences forming intraday.

 Both the 1 and 2 min (migration) are negative intraday, I'd think that the 3 min will be next to see an intraday negative, if that happens I may add to the DZZ long or a GLD short/put as this would be excellent positioning, but I want to see higher intraday probabilities first.

As for GDX (Gold Miners), they are somewhat similar to Gold overall.

The long term 2 hour chart also shows a base with recent increasing positive divergences, but still within the range of the overall base area.

 Like GLD, the 30 min chart is calling for a substantial pullback, again I suspect toward the bottom of the range which would be around $20.40 and then there may even be a head fake move in the area consisting of a run on stops below the $20.00 area as support is so long and well defined and $20 is a whole number where stops would likely be accumulated.

The 3 min GDX chart didn't have the same Friday afternoon positive, but it does have a negative in to the gap up as you can see above.


DZZ 2X SHORT GOLD
 DZZ's 60 min chart is leading positive after a negative divegrence and downtrend (opposite GLD) , the positive is impressive, I can't see today's gap down nullifying such a strong positive, although it is not a huge divergence in duration which makes me think it is along the lines of a swing trade plus, or sub-intermediate uptrend as GLD pulls back to it's lower support.

 The 15 min chart confirms not only the negative and the downtrend, but the leading positive divegrence.

 Intraday on a 2 min chart there's no confirmation of the gap down.

For these reasons I chose to hold DZZ long and may even add to it if I see charts that just can't be ignored, the larger picture looks very solid, the short term charts from this point are more about timing for me than anything else.

DUST 3X SHORT GOLD MINERS...
 Like DZZ, DUST has an impressive 30 min cycle from distribution to downtrend confirmation to a leading positive divegrence and there's confirmation between all 4 assets as they are all correlated (GLD, GDX, DZZ and DUST).

The 5 min DUST chart looks like it is ready to make its move, this is why I closed the former NUGT long and replaced it with DUST, again no damage at all from today's gap down.

The intraday chart actually looks pretty good as it is seeing a new leading positive high on the gap down, I'll be watching this, I'm not sure I have room to add, but I suspect that both DZZ and DUST will be ready at the same time, for now I'll hold both longs open.

Quick Market Update

Remember, volatility, a quick rumor and denial sent the market up on a spike, but no follow through, I expect that is because the intraday reversal process is still taking or was taking shape. I'd say it's probably about mature right now and while I hate trying to give targets, I'm guessing a target somewhere around Friday's close is not unreasonable. There's no accumulation behind this intraday base beyond what I've told you about so it's not the start of anything new, it looks to be the typical (more normal) market bounce or jiggles, but volatility as I said before can make things look larger than they really are in the mirror.

In any case the reversal pattern looks a little like an inverse H&S bottom, you could pull a price based target from that, for the SPY that would be about $186.50.

IF WE GET SOMETHING ALONG THOSE LINES, I'D BE CONSIDERING POSITIONS SUCH AS VIX CALLS, MARKET AVERAGE LEVERAGED INVERSE ETFS LIKE SPXU, SQQQ, SRTY, SDOW AND OTHERS LIKE FAZ, TECS, ETC. I'LL LOOK AT THESE IF AND WHEN WE CROSS THAT BRIDGE.

VXX / UVXY

I wanted to show you a few charts for the Short Term VIX Futures, VXX and the 2x leveraged UVXY; a few of you with different positions inquired about them today.

 This is the 1 min intraday UVXY, I have a long equity position in the trading tracking portfolio in UVXY that I chose over a long call option in VXX which would have more leverage.

As you can see we not only have a longer term large positive divegrence (as seen earlier) in VXX and UVXY, but also a positive divegrence Friday afternoon which has run in to this morning and sent price nearly vertical in to what I'd call a parabolic-type price move. You can also see the slight negative divegrence which makes sense with what we are seeing intraday in the market averages considering the two trade opposite of each other.

With a move like this in UVXY of 14 points or more since Friday, I'd be hard pressed not to take near term expiring calls off the table, there's good momentum to sell in to and it should be a fairly nice profit, if the expiration is close at hand, even March monthlies. The way I see it, with a parabolic price move, they are almost always going to fail or see a significant pullback so why not take the gains and look for the next entry and do the trade all over again and double your profits? Options aren't like an equity long, they lose value the longer you hold them due to time decay of the premium so just expecting higher prices in the future (before expiration) doesn't always mean you'll end up with a better gain so I often will take these quickly and just look for a new area to open a new position.

I purposefully chose a long (2x leveraged) equity position in UVXY because of the large positive divegrence, I wanted to be able to take advantage of that (the position is up about +10% right now) without having to worry about trading in and out of an options position. Generally the longer the trade or more profit potential, the less leverage I want to use, one reason is just so I don't burn myself out trying to trade around an otherwise trending position.

 This VXX (same as UVXY except no leverage) 15 min chart shows a long term positive divergence as the market was rallying, usually you wouldn't expect to see that but it seems someone has been building a lot of protection against a downside move as they too didn't expect the Feb. rally to last. Because of this, I feel comfortable that VXX/UVXY are going to trend for a longer period, even though they'll have pullbacks and corrections along the way, I don't need to worry about time decay like I do with options and I can let this trade work and trend without too much hassle.

This 30 min chart is another reason why. If I see a great set up for an options trade I may take that, but in this case where it looks like there's a significant base with a lot of accumulation, I think the position has a lot of upside and I'd rather just let the position trend.

So as you can see, I';d treat two different positions very differently, the giveaway for near term expiration call options for me today is price, it's very vertical and that usually gets corrected so I'd likely have taken some or all of the call position off the table, wash, rinse and repeat for another gain.

Quick Update

There's an increased ROC of 3C on the upside of intraday charts, it's most noticeable on the SPY 1 min, but I thought I'd point it out on ES (SPX e mini futures) 1 min chart...
ES 1 min with an increased ROC of 3C (positive). From the looks of price or the "reversal process" as just about every trend has one (even an intraday bounce), there are two possibilities, the market calms down and comes down toward intraday lows and makes a larger "W" like base or this "U" shaped base is complete and ready to go. In the first case that would make for a stronger bounce, still nothing of concern, but perhaps something that can be used for tactical entries or perhaps something that might make you consider taking some positions like VXX calls off the table or maybe market average puts like QQQ puts that have a near term expiration off the table.

If it is the second and this is ready to go, then we should simply see the move start, with this much time left in the day we'd likely see the end of the move as well, this may provide some entries in to new positions like market average puts or long inverse ETFs, the size of the base really does have some proportionality with the proceeding move.

More as it develops, I'm concentrating on positions that look viable or may be soon that offer good entries and low risk.

Market Update

The last thing I said in this morning's, A.M. Observations was a warning about increasing volatility, this means downside moves are going to be bigger, but insignificant corrections are also going to appear much stronger as well and after a period of low volatility like the last week-plus, those upside "jiggles" will appear to be stronger than anything you've seen in over a week as a function of increasing volatility, thus my warning at the end of this morning's post...


"Volatility should remain high, lets see what this week brings, I'd encourage you to look at the trading in terms longer than just a day, volatility should be high and falling for every shake on this kind of volatility will have you in and out of good positions, but it's also a sign of changing character and those precede changes in trends as we can now see clearly."

We are also getting back to a more "Normal" market, which is something we haven't seen since 2008 with all of the intervention and what I mean by normal is greed and fear are the drivers of the market rather than how big the morning's POMO is, so many things like volume will take on new importance that they previously didn't have, in fact volume was of no importance at all, that will change.

As for what I see right now intraday, it looks like we will see a bounce , this is what I said in last night's post, something along the lines of, "I think we will see several trends between now and 4 p.m. tomorrow (today)" which is neither good or bad, it's just the normal functioning of the market, like the waves and tide, just in smaller proportions. Actually it is what you make of it.

Here are some charts of the averages so you get a feel for what's going on so far on an intraday basis.

QQQ
 You can see an intraday 1 min positive forming here.

Also Friday's leading negative and a 2 min positive

At 3 mins the Q's are basically in line , so as of now this isn't a very strong divegrence, it's more along the lines on an intraday bounce, but keep volatility in mind.

As of the QQQ 5 min chart it is in line with the price trend, no positive divergences at all.

 And the 15 min chart is quite negative, I don't think we will be seeing anything positive develop here, in fact it is where the probabilities are for any short term moves, this is the stronger magnet on price, that doesn't mean we won't get waves/bounces, but they should continue to resolve with the larger outgoing (bearish) tide.

IWM
 The IWM 1 min has a very small relative positive, if it were on its own I wouldn't even mention it.

The 2 min chart has just as small a relative positive divegrence, as far as timing, you can see a rounding "reversal process" taking shape so this move is not quite formed and ready to go, it also is not very large.

IWM 5 min is in line and no positives at all, so once again this is in the realm of intraday and is more of a correction than anything at this point, it is not what I'd consider a return to the previous bullish price trend.

SPY
 The SPY probably has the best relative performance in this intraday divergence, the 1 min looks better than the rest, but still a 1 min chart.

The SPY divergence stretches out to 5 min as seen above, it's still forming the reversal process.

However at 10 mins 3C is in line with the move down in prices so anything positive in the SPY stops at the 5 min chart above.

DIA
 DIA 1 min is not impressive at all, in fact this is the worst relative performer for the intraday divergence.

As you can see the 3 min is no better, there's essentially nothing here, I certainly wouldn't show this on its own, but I did want to show where the relative strength and weakness was and that this was not a market wide bounce of relative strength.

The DIA 5 min chart needs no commentary, this is very ugly so I'd expect this to be a very poor relative performer if it is able to perform at all which they usually do as the market runs together directionally, but like Friday we had a few averages in the +20% range and the Russell 2000 in the -40% range on the same day.

Ukraine or Not: BIDU, FB, GOOG, GS, NFLX, PCLN, QQQ, UVXY, etc...

The above positions are all in place either via puts and/or equity short positions (core shorts or expected trend positions). For instance the QQQ March $88 Puts look like they'll be fine, I'm very happy with all of the other positions as well.

One thing I've had a lot of questions about (I suppose because I like geo-politics and have covered them and what they mean to the market in the past) is how Ukraine will effect the market and the first thing that comes to my mind, especially with the Russian Central bank hiking their rates by an astounding 150 basis points which hasn't been seen since 1998, just before Russia defaulted on their sovereign debt (bonds) and their currency collapsed. The reason I note this period is because it's when the "Smartest guys in the room" (which is an incredible episode that I encourage you to read about) nearly took down the U.S. Financial system, I'm talking about Long Term Capital Management which was the all star money management team founded by the head bond trader from Salomon Brothers as well as 2 Nobel Prize winners in economics, Myron Scholes and Robert Merton of the Black and Scholes Options pricing model. Like now, they were using heavy leverage (like the Carry Trade leverage of the USD/JPY), but unlike now they were heavily vested in the new Russia (as well as some other positions that went against them) and the bet went badly against them at full on leverage. LTCM produced returns (after fees) of +21% their first year, +41% their second year and +41% their third year, they were the rock starts of money management.

At the start of 1998 LTCM started out with an AUM (Assets Under Management) of $4.7 Billion Dollars. They had a pairs trade go against them and by September they were experiencing a flight to liquidity. LTCM started September with $2.3 Billion in assets, 3 weeks later they only had $400 MILLION dollars left, all of the rest fled the company in a period of 3 weeks, yet LTCM still carried over $100 BILLION in contingent liabilities effectively putting them at 250:1 leverage.

At this point LTCM was looking for funds to bail them out when a consortium of Goldman Sachs, AIG and Berkshire Hathaway offered the partners a buyout of a mere $250 million dollars , remember at the start of the year they were worth $4.7 BILLION dollars. Warren Buffet gave the partners 60 minutes to accept the deal which they did not, as a result the F_E_D ultimately had to step in and bail them out and by 2000 LTCM was dissolved. 

I mention this because when I think of Russia and the high amount of leverage in the market via FX carry trades like USD/JPY which are often at 100:1 leverage, the lesson of, "The Smartest Guys in the Room, LTCM" always comes to mind.

That being said, with everything that's going on, I'm very happy with the above positions that are in place and while I would not be so naive as to say the Ukraine has nothing to do with this, we have seen other geo-political nightmares from nuclear, to Syria to the collapse of friendly Middle Eastern governments that were essentially taken over by terrorists and the chances of war, chemical war, nuclear attacks and all out halt of oil through the straits of Hormuz has done very little to effect the market.

Furthermore, this is what we expected long before the Ukraine, before the Olympics even were in full swing. Running a quick search (because I wrote about this so many times prior to February 7th, I found this, the exact reason we were expecting the market to move up... Changing Sentiment from February 6th. Some excerpts...

"I've been getting a lot of retail sentiment updates...So today's sentiment report is not surprising in the least...

"Practically everybody on my stream was calling for the 200 day as if it was a certainty yesterday."

 ...retail chases the move and the sentiment has clearly been bearish, that's typically when we see the H&S volatility shakeout back above the neckline which it appears we will see, this accomplishes about a half dozen things, they're all well documented in my 2- part article on the member's site, "Understanding the Head-Fake Move".

Since Dow Theory can be difficult to explain in a short period of time and since there have been revisions to it since first recorded in the WSJ almost a century ago (Charles Dow owned the WSJ), the best visual example I can give is the beach and tide.

If you go to the beach and wait for a wave to break and roll up to its highest point on the beach and then stick a wood stake right there in the sand, over the next few hours you'll see that the waves are either coming further up the beach (an incoming tide or bull market) or are receding, an outgoing tide or a bear market, but no matter what the tide, the waves will still roll up the beach and the market is exactly the same.

... this (*the predicted strong move up that had not started yet) would be a wave in the larger tide rolling up the beach even as the tide is moving out.

In any case, you know I expect a move strong enough to change sentiment (*because as of that date, sentiment was very bearish with traders expecting the SPX 200-day average to be broken while we expected a strong upside move that would change sentiment to the bullish side which has since happened), but there are no victory laps in the market so we'll keep watching, but if this is as we suspected, then there's not going to be a lot to do other than take care of the positions we entered in expectation of this move (because we had already entered "Hitch-hiking longs until we were high enough to enter core shorts), look for some new entries and at a certain point when we are seeing distribution on a large scale, move in to core short positions like GS, PCLN, NFLX, GOOG, etc."

February 6th 2014 "Changing Sentiment"...

My point in showing excerpts from one of a number of posts at that time was to show we expected a strong up move and had already entered longs for the move, more importantly we expected the move to be used to change sentiment and just like a wave rolling up the beach in the form of the February rally, it was in my view and still is, within the context of a larger OUTGOING TIDE.

So, when I'm asked about Russia and the Ukraine, I want to simply point out that the bearish resolution to this rally was something we expected before it even began. Take the charts of assets we have recently profiled as possible positions/trade candidates and note their charts and divergences...

BIDU
BIDU 60 min's leading negative divergence was in place LONG before any Russian/Ukrainian situation.

FB
 FB 30 min is one we saw over a month ago and had been keeping an eye on looking for an entry, again, before any of the current news.

GOOG
GOOG's 60 min chart had already been marked with a "Black Dot"  long before any current fundamental news flow, it was just a matter of timing/entry,  as I said in the post above from early February, "There won't be much for us to do except watch-over long hitch-hiking positions until we get in place to enter core shorts like GOOG".


GS
 GS's 5 min shows the accumulation area that was being talked about at the time the post above was written, however there were already long term negatives and it was just a matter of waiting for the "Sentiment changing move on the upside" to run its course, this 5 min GS chart seems to clearly indicate it has run its course and therefore makes the entry look like a nice entry with much lower risk.

NFLX
The same is true of NFLX on this 5 min chart, the signals that represent the tide were already negative, it was just a matter of waiting fro the wave to stop rolling up the beach and enter as it started to roll back down the beach as the tide continues to go out.

PCLN
PCLN 5 min is the same scenario over again, all of these were set up long before Russia's invasion, these were the very stocks referenced in that post almost 4 weeks ago.

QQQ
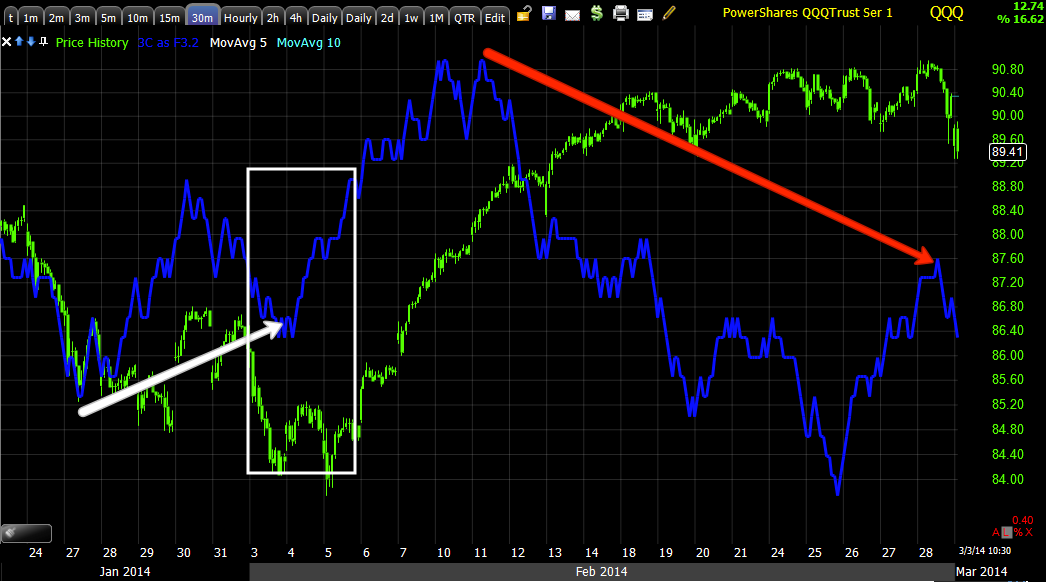
 The 30 min QQQ Puts, the March puts I have felt would be fine have turned and are so very close to being at a gain, again I like them very much and feel they will bring in a gain.

VXX / UVXY
And if this February rally were anything other than what we expected it to be (and our expectations were in place long before the actual rally started as you can see by our line of thought in the excerpts from the early February post above), we wouldn't expect to see this kind of leading positive divergence in VXX and UVXY during such an "apparent" strong move up, why the need for so much protection as the leading positive divergence points out?

So far, I'm VERY happy with these positions, I'm also very happy with our trend expectations predicted more than a month in advance, plenty of time to set up positions and take advantage of multiple trends/trades.

So yes I do think the Ukraine is helpful, especially as a 30-second CNBC soundbite as to why the market is doing what it's doing, but if you followed our posts through late January and early February, you would have expected the same market action right now and would not be surprised so apparently it doesn't have as much to do with the situation in the Crimea as some would have you believe.


A.M. Observations

More market destruction overnight.... The Index futures still remain well below Friday's lows. The USD/JPY is now approaching $101, forget about $102, as we started Friday morning out, "$102 is not going to hold much longer" and it's now off my price scale.

 USD/JPY saw a small bump up off last night's positive divergence and headed lower with 3C in line on the move lower, now closing in on $101, $102 is no longer visible on my normal price scale.


And ES has been following USD/JPY tick for tick so it seems our question is answered, the correlation is still there, even if it breaks for a day or two to accomplish Wall Street goals in running these set ups/ cycles.

This is ES intraday 1 min overnight, divergences are causing very small moves, USD/JPY remains in control.

TF has the best looking positive divegrence, but it's only 1 min, it's not that impressive considering the overall situation.

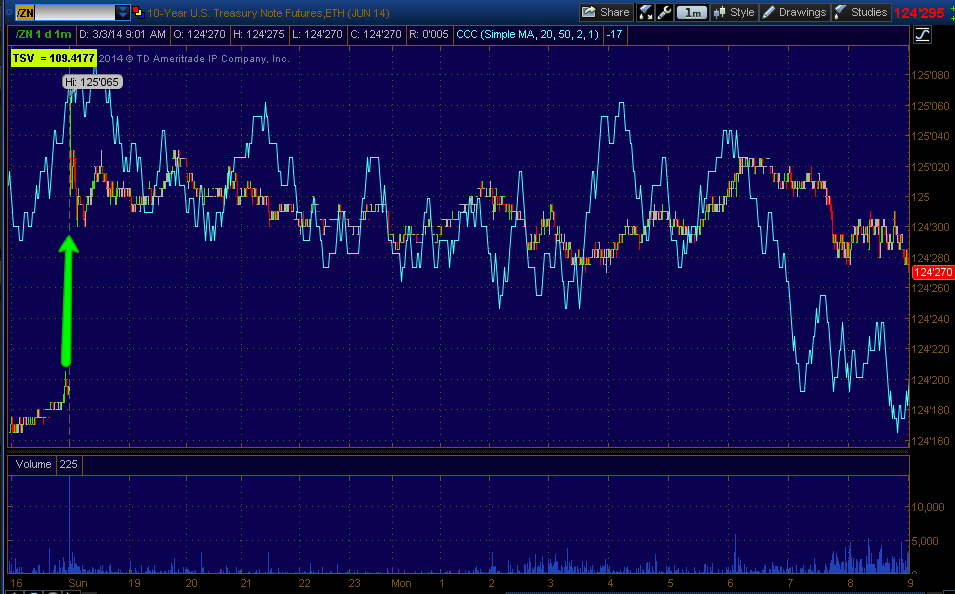
The safe haven bid in treasury futures has dropped off as mentioned last night in a thin market with the underlying market not even open, however we have seen flows to Bunds in Europe and safe haven currencies as well so the flight to safety continues worldwide.

Perhaps the biggest news is in Russia itself where the MICEX Index of Russian stocks has fallen -11% with major banks leading the way with losses between -10% and -20% on the day and this coming after an astonishing 150 basis point hike in rates from the Russian Central Banks to try to halt the devaluation in their currency, the Ruble which is at all time lows vs the $USD and to stem the outflow of funds from Russia.

For perspective, this is the biggest Russian CB rate hike since 1998 two months before the Russian crisis saw them default on their bonds with massive currency devaluation, THIS WOULD BE THE SAME CRISIS THAT ALMOST KNOCKED THE US ECONOMIC SYSTEM ON ITS BACLK WITH THE COLLAPSE OF LONG TERM CAPITAL MANAGEMENT...

You may recall LTCM, the smartest guys in the room including founding members such as the head of bond trading from Solomon Bros. as well as not one, but two Nobel Prize Winners in Economics, yeah, it was the Russian crisis that took LTCM from the hottest management company to the biggest flop we have seen, eclipsing even Lehman and Bear Stearns.

Volatility should remain high, lets see what this week brings, I'd encourage you to look at the trading in terms longer than just a day, volatility should be high and falling for every shake on this kind of volatility will have you in and out of good positions, but it's also a sign of changing character and those precede changes in trends as we can now see clearly.