Tuesday, May 20, 2014

GDX/NUGT DAILY UPDATE

I'm not at all convinced that naming a price pattern is important, but knowing what a price pattern is in advance can be useful as far as expectations, the health of the pattern (if you know what the standards are) and even targets.

There are a couple of "possibilities" for GDX, this doesn't mean any of them are correct. One mistake technical traders make is to memorize the rules (or even worse, not memorize the rules), but fail to understand why the rules create the pattern. Almost every price pattern that is legitimate, has a psychological reason it formed, that's why they have formed for well over a century and are similar every time, human nature doesn't change and the two main drivers of price action are not supply and demand, but rather the psychological  human elements of emotion, specifically fear and greed and that's why these price patterns are so similar whether formed on a 5 minute chart in 1920 or a 5-day chart in 2000.

Here are a couple of possibilities...
 There's an inverse H&S bottom, the sloping neckline is not a problem, although it's generally not one of the cherry picked examples you'll see in a T.A. book.

The symmetrical nature of the left side of the head and right side of the head are actually quite common, even allowing quite a bit of room for fudging on the left side of the head, we still get at least two major shoulders and the right side is stuck at 1.

As mentioned yesterday, volume is key to identifying a H&S top, it's even more important in a H&S bottom.

This custom cumulative volume indicator (blue) just makes it easier to follow the trends of volume. No matter what the pattern is or isn't, the increased volume on the downside move is indicative of a selling climax event which allows a new trend to emerge, like a stage 1 base.

As far as the Inverse H&S bottom, the left side of the head volume is not critical, but by the head and to the right of it, it is very critical. Volume increasing on the move down at #2 is good, but it should be heavier at the bottom of the head and then even heavier on the advance from the bottom of the head to the neckline which it isn't.  At #5 the diminishing volume is okay, but the volume would need to pick up SUBSTANTIALLY on any advance off the lows on the right side.

This is not a great candidate for an Inverse H&S bottom.

As far as a Cup and Handle Bottom, typically a C&H is a continuation pattern with a preceding uptrend, we don't really have that here. The C&H can be a base pattern although less popular as one. We do have the cup, there are at least two different areas we could consider the cup and the downward sloping consolidation would be the handle. Volume isn't bad for such a pattern, the shape and size aren't bad, the handle is a little close to going too far, but still not bad.

If I had to put a name to it, I think I'd go with the C&H.

As far as the main issue I've had with GDX and the 3x long version, NUGT, it has been the repair of the 10 and 15 min charts, especially the 10 min.

I'm not going to go through all the timeframes today as they aren't that important, the 10 min chart update is exceptionally important.

THIS IS ANOTHER HALF SIZE POSITION I'D LIKE TO FILL OUT TO FULL SIZE AND I THINK WE ARE RIGHT IN THE AREA.


 GDX 10 MIN POSITIVE with a reversal process.

NUGT 10 min confirmation with a reversal process.

And finally, all 3, DUST 10 min negative with a reversal process providing all 3 assets giving confirmation.

I'd like to add to this position as well. The 30 and 60 min charts are pretty much already there, it was the 10 min that was troublesome. We do need the 15 min charts to migrate from the 10 min and just make some minor adjustments and a few intraday timeframes. I'm thinking we likely get the inverted "Igloo with chimney" head fake move as part of the reversal process, I will set alerts for a move below the recent rounding lows in GDX and NUGT as there's about an 80% chance that's where we find our add-to points, otherwise I'm holding the partial position that's already open and I'd have no problem opening a partial position here as long as my risk management allowed for enough room for a head fake move to add to the rest without violating position size.

This is one that told us what to expect back in April and has come to us, doing everything we expected, this is the kind of trade I don't ignore.

MCP Looking Very Interesting

MCP has been with us for some time, I kind of find it a little ironic that we were long MCP in to a breakout from a triangle on April 22nd, as far as price action goes we had over a 5+% gain on the day, but exited the same day and closed the long because it first and foremost, didn't post a head fake move before breaking out, that's how common they are, especially in a long term support area which was the support of MCP's base.

If you look at the post earnings action in MCP on their own, it looks like a slaughter, in price alone it is a slaughter, but there's still that RIMM experience in which we've seen this before, the 3C charts don't confirm the downside, but rather stay very positive and we only find out later what the reason was after RIMM not only regained all of the post earnings losses, but went on to put our long at a significant gain for an equity long only position.

When MCP's decline post earnings is looked at within the context of the entire stage 1 base, it looks exactly like the head fake move that was missing and caused us to CORRECTLY sell MCP the day of the breakout from the triangle.

I'll let the charts build the rest of the case. However, I do think I'm going to fill out the MCP long (it was entered as a spec. half size position as it was just before the wild card of earnings), I'll let you know when I decide to fill it out, but it will be within a day or so I believe.

 MCP daily chart, there are two distinct areas of what looks to be a very large stage 1 base, the larger rectangle and the smaller descending triangle to the far right , both share the same support level.

When looking at the post, earnings decline, this is essentially about the size head fake move I would have felt comfortable having in place before hand on the breakout from the triangle in April when we closed the MCP long as the breakout failed days later and only added about 1.5% from where we exited before failing.

 This is the trend of the 1 min chart, one of the first things that stood out about the post earnings decline was not only that the fastest charts like the 1 min which could have confirmed the downside move within the first hour of the first day after earnings, not only did not do so, but it actually went the other way in going positive in to the large amount of supply that was created. We know smart money's positions are so large that they need pretty extraordinary amounts of supply to get in to positions without either driving price against the position they are trying to create or without raising the alarms with the predatory, front running or "Ice-berg" hunting algos.

There was a negative, not very large, more along the lines of a steering divergence that sent MCP below the psychological stop level of $3.00 where another round of supply was created in to another leading positive divegrence. Then only 1 more small negative right at resistance of $3.00 sending price a bit lower where a new leading positive high was put in.

This is the 2 min action leading positive right at the break and subsequent price action below $3.00.

 This was another curious chart right after earnings, the 5 min chart which could have confirmed the downside price move after earnings the first day, it did not and remained in leading positive position.

 The 10 min chart is interesting as it shows a leading positive divergence in to the triangle area, but would not make a new high at the breakout whiich was another reason we exited the trade on the breakout day, a lack of confirmation, but there's still a leading positive divegrence there.

It's as if the area was under accumulation, but there was going to be no chasing of higher prices, as if they knew there would be lower prices available soon to accumulate instead.

This chart could have also confirmed the downside post earnings price move the first day of decline, but stayed in leading positive position.

The larger picture of both base areas or one large one on a 30 min chart, it too is leading positive, most of that came only after Goldman Sachs released something on MCP that knocked price down from the top of the range to the support area at the bottom, this is when the larger underlying flow of the 30 min chart went leading positive and remained there although this chart too could have easily confirmed the downside price action by now easily.

 The same is true of the 60 min chart at the same area.

This is the 60 min chart since the post earnings decline, that's a very strong leading positive divegrence for an area that is supposedly being sold by smart money according to price action.


As I said, I'll let you know when I decide to add to and fill out MCP to a full size trading position, which may become a core position. I just want to take a closer look and make sure there's a low probability of any near term head fake moves, I really don't see the advantage in running one considering how sharp the post earnings action has been.

Market Update: Stalling for time

Perhaps for the F_E_D minutes? You'll see a pretty clear theme today, it's not one of much action either positive or negative, but rather just enough to stall price and in this case that means it's slightly more positive action, but not the kind that (at least not of yet) sets up a strong move or is repairing damage from yesterday, in fact only the Dow/DIA has a somewhat positive look to it, but this has been the case since we first saw signs of a positive divegrence market wide on Friday which has done little more than to add to the chop, the DIA "could" be a worthwhile position, but it's still a bit difficult to imagine considering the brick wall of chop the market has seen the last several months.

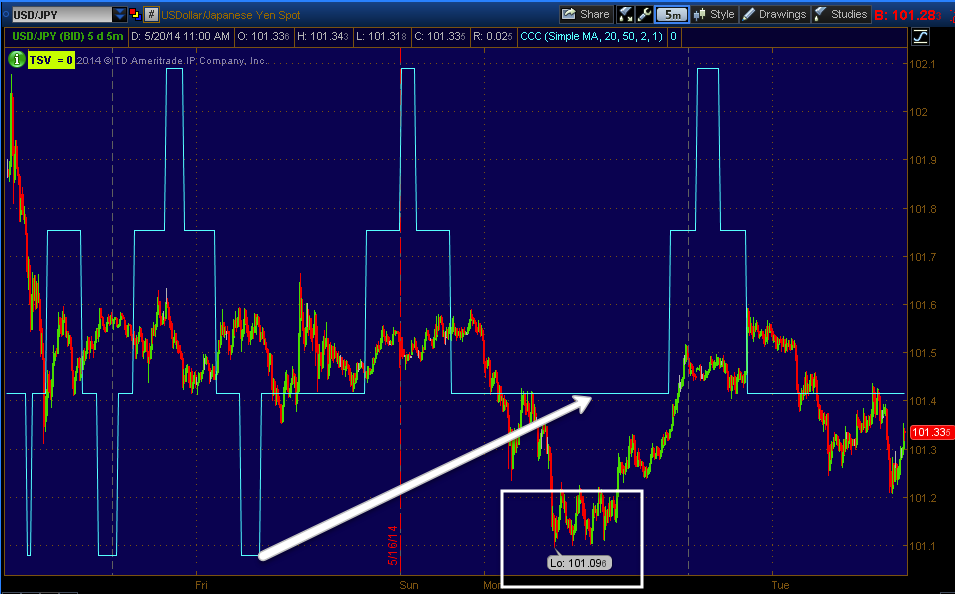
As far as USD/JPY, there's very little action there as mentioned first thing this morning.
 This is the 5 min USD/JPY, other than yesterday's lows, there's not much going on here, in fact if anything the intraday charts are leaning negative.

The single currency components of $USD and JPY (Yen) are just about as dull, it's more of a race to see which one is weaker.

 Yen 1 min intraday, with Yen downside the USD/JPY "could" see some upside, but there's a second currency to the pair, the $USD...

As I said, it's almost as if it were a race to see which were weaker, it's hard right now to imagine the USD/JPY doing anything to support the market.

As for Index Futures, there seems to be more going on in their divergences and those of the averages as far as what is actually causing "some" movement or perhaps it's better to say a "lack of movement" as yesterday did not end well for the market, it's as if it has a lifeline right now.

ES 1 min positive near the open.

However like the averages that saw deterioration to some surprising timeframes yesterday in a surprisingly fast manner, the 5 min chart is clearly negative, forecasting near term weakness as the most probable trend.

NQ/NASDAQ 100 futures 1 min are in line

The 5 min chart is the closest thing to bullish among Index futures, it's really closer to in line, but there is a slight positive there.

Russell 2000 futures saw weakness overnight and in the early a.m. hours, they are close to in line intraday, but again...

 The 5 min chart is showing VERY clear weakness forecast in to the very near future.

As for my custom NYSE TICK Indicator, I chose to look at a slightly longer scale at 5 min rather than 1 min...
 The breadth improvement last Thursday and Friday leading to yesterday's recovery of the gap down has deteriorated both yesterday and today.

Intraday breadth among NYSE stocks is slightly more negative at >-1000 while the upside is right around +750.

DIA 1 min weakness in to yesterday's close and a very minor positive this morning, this is the "Stalling" looking behavior.

 DIA 2 min with a negative yesterday and again the stalling behavior today.

 As I mentioned last week as well as yesterday, the DIA still looks the best overall for underlying trade, if there were a hitch-hiking trade available among the averages, I'd expect to find it in the blue chips/Dow/DIA.

DIA 5 min

IWM 1 min w/ yesterday's weakness and just enough to stall today.

IWM 2 min leaning much more toward weakness from yesterday's action.

The IWM was probably and probably still is the second best looking of the averages, but still negative (relative) on this 5 min chart.

QQQ 1 min with very little help today.

 QQQ 2 min much the same

QQQ 3 min, the same

And QQQ 5 min, the same.

I still have the SQQQ (3x short QQQ ETF) as an open long, although I'm not expecting too much until we decisively break through this chop.

 SPY 1 min with yesterday's damage and just enough to stall today from seeing more downside.

SPY 2 min

SPY 3 min is not seeing any strength from the 1-2 min charts, thus the stalling look and not repair.

And the continuing weakness in the 5 min charts (SPY).

I suspect this is about tomorrow's 2 pm release of the F_O_M_C minutes.


SPY Perspective

After going through a watchlist and several different assets, there's one area of interest that keeps popping up, I'm looking at it in the context of the SPX / SPY, but it's throughout numerous assets and industry groups.

First I think there can be very little doubt that the chart below depicts a multi-month top...
 This meat grinding zone of chop, leaves very little doubt in my view that this is a fairly large, multi-month market top, a very difficult one, but one all the same.

 The 4 hour chart is used here for a specific purpose, to reduce signals, noise (even if they are perfect signals) and just follow the largest underlying trend, that would also make it very clear that this is most likely a large multi-month top.

 Although I notice this area on numerous timeframes, a 15 min chart seems to reveal the same pattern over and over again in different assets, some that I wouldn't normally associate with the kind of signals they are giving, especially TLT.

 Although the entire top and its size are very important, for our purposes there's an area I keep seeing pop up. I'm not entirely sure the entire pattern is as important (from #1 to the present) or if just the area from #2 to present is more telling, in any case there has been a leading negative divegrence through the entire area.

However I keep concentrating on the divergence in the area marked as something of a H&S-like top, although it's not a true H&S pattern, but I suspect the same psychology that forms a H&S top is at play in this market.

I was a little surprised to find the same deterioration in TLT, even though I believe long term TLT looks to be an interesting long, why TLT would move with the market at all instead of against it with its usual correlation as a flight to safety, which has almost always dominated, is unclear. All I can think of is the F_E_D's taper of Treasury purchases and the Chinese move away from US treasuries may be what's causing weakness in the long bond.

 TLT 15 min, not the exact same pattern as the SPY, but the same weakness in the same area.

This is partly why I like (and have a long position open in...) TBT, the 2x leveraged opposite of TLT.

Even the VIX futures have an interesting divergence of some size in the same area, although they also have it through the entire multi-month top area as might be expected.

It becomes a little more interesting and important as to how the market reacts in to the F_E_D minutes tomorrow, but the15 min chart (and I could go out even longer, these just tend to display the area I'm focussed on better) divergences are very difficult to overcome, especially trend ones such as the above or the 15 min SPY chart above.

This looks like an area of more than just more top and chop.

A.M. Update

So far things are fairly quiet after yesterday's intraday action maintained price much longer than intraday charts would have suggested, but there was a bit more damage than expected out to 5 and even some 10 min charts yesterday which I didn't expect to see so early in the week, it's important to see how those timeframes act today.

The USD/JPY lost ground overnight, however there's a small positive divergence going in to the North American open...
This isn't a large divergence and there's nothing particularly special about Yen/USD divergences, but that didn't stop the USD/JPY from ramping up a bit during regular hours yesterday when single currency component futures weren't that impressive either (today probably less so at present).

As for Index futures, the intraday 1 min futures are also rather bland, however the damage seen on the 5 and some 10 min charts of the averages from yesterday is apparent on some Index future 5 min charts as well like Russell 2000 / TF
TF 5 min, ES looks exactly the same, only NQ is in line.

That weakness is migrating to 15 min charts as well so today's action should tell us something of how long this market can hold out.

Don't forget tomorrow's main event, a knee-jerking release of the F_O_M_C's minutes from the last meeting at 2 p.m., these tend to cause initial knee jerks that are usually wrong as well and are faded within a few hours to a few days, perhaps the market can stay up in price or until the minutes?

Again, today's information should help us better understand if yesterday's seemingly premature weakness was a one-off deal or it continues, in which case there would need to be some minor adjustments to timing of certain position entries.