Thursday, October 16, 2014

Important Market Update

I haven't loaded up on longs as I'd like to see happen, the risk I have taken is commensurate with the divergences I see.

It wouldn't surprise me to see the market pull back a bit from here and do some more work as the divergences late yesterday were stronger than today so I'm going to wait before adding anything else, if I miss the bounce, I have some exposure and I don't regret it.

Otherwise, I suspect we'll be seeing some downside near term intraday and that's where we have the window in to the market to see if there's additional, stronger 3C positive signals.

USO Update

Crude long is seemingly the impossible trade, however we entered a smaller call position Monday, Trade Idea (Short term Call/Options) USO  based on 3C signals and $USDX signals.

It looks like USO and Brent are starting an upside move. This isn't a trade I want a lot of exposure to and not on a long term basis which is why I chose the leverage of options for the position, that and I don't care for the leveraged WTI ETFs, but I did give myself plenty of time with November 22nd expiration just in case...

 Interestingly USO's positive divegrence starts at the same time as most of the averages, this is the start of accumulation, not the end, again October 2nd.

 The 5 min chart is in a huge leading positive divegrence, while I wouldn't be surprised to see volatility or the jiggles, this looks like a very strong base for a trade, again Oct. 2nd plays prominently.

And the near term intraday which was leading Monday has just added more to that, this is a beautiful reversal process, I wish there were more like this in the averages, again Oct. 2nd.


Trade Idea (Speculaltive Options Call position) QQQ

I'm going to go ahead and open a small QQQ November 22nd expiration call with a strike of $92.

I may add to the position, but for now, this is the upside risk I'm comfortable taking.

SPY, QQQ, IWM Update

You may recall that Q3 window dressing, the last week or two of September saw a lot of small caps sold off, after all , it's the "Art of looking smart", showing that these trading firms owned the hottest stocks at the quarter end report while dumping the dogs, which I suspected would create a deeply oversold and very cheap, very liquid way to play a countertrend bounce taking advantage of bearish sentiment which has been pegged at the most bearish among retail at zero on the Fear and Greed Index, 100 being the most bullish.

It looked like this...
 From the stage 3 top, we had a negatrive divegrence or head fake (Igloo/Chimney) so the expectation that we'd hit stage 4 decline and make a new lower low from the August lows was high. The support area that formed a "W" in early October was a huge bull's eye target for a head fake move and ith increasing volatility, ATR, and unpredictability, we saw exactly what was predicted almost a year ago, HFT liquidity disappear as they have no legal obligation to be the buyer/seller of last resort like market makers and specialists (at market orders), but HFT has largely replaced all of their liquidity making it a dangerous downside situation as HFT's can just shut down, market makers' who have a legal obligation saw their role as liquidity providers marginalized by HFT and our prediction was in a downside move, HFT liquidity would disappear leaving the legal obligation to the marginalized market makers and specialists, essentially creating a worse market structure than has ever existed, one of the reasons I think the bear market argument is one of the strongest for the biggest opportunity anyone alive has seen as long as you are on the right side of the trade.

We also know FEAR as an emotion is stronger than greed, that's why markets fall faster and harder than they rise, just think of all of those all time new highs on +0.10% moves compared to what we have seen recently. Five and a half months of SPX gains were wiped out in less than a month.

However this left small caps deeply oversold as well as many other asset classes with large caps holding out the longest as they did in 2007/2008.


The 3C chart of SPY in the August cycle's stage 3 top shows the head fake "Chimney" attempted breakout/failed breakout, the head fake move, see a deep negative divegrence which is where the pivot was to add short trades like SRTY/SQQQ as well as longer term core shorts. The two trendlines, the first being the obvious "W" bottom was high probability for a run below and while we were there, the expected stage 4 new lower low was also hit as the second trendline was broken. Our downside targets were a break of the 200-day moving averages, but all of this supply and cheap prices also made me think that after Window dressing, when no one is watching or able to watch, firms would be buying up cheap assets for a bounce, taking advantage of the entire market on the same side of the trade.

As sharp as the move has been, and we'll have to get use to the new normal as volatility will only get stronger in a bear market, very different than what we have seen the rest of early 2014, it does look like that plan is still in effect and there are numerous signs we have a monster base, which it needs to be. After the initial 1929 crash, the first significant move was about a 6 month counter trend rally that made +50% in the Dow, there were at least 4 more on the way to the 1932 bottom.

As for the charts we have now, I stayed short until late last week when the risk:reward started to look a little scary and went to cash, only recently this week adding some partial long positions with most everything else cash, waiting for the right moment to enter as a move of this size would be well worth the trade, however I want strong confirmation, stronger than usual which is pretty darn strong just because of the higher probability of the market breaking, we are already seeing some of that in EDGE this morning with crossed quotes, the system just can't handle what's coming which will make it worse.

 Right now the IWM looks the best which makes some sense being the small cap exposure.

This is a 60 min leading positive divegrence, this is huge as far as a bounce goes, not the typical several day bounce, but something that will change sentiment.

These charts also start on October 2nd, the 2nd day after Q3 ended and managers had a free hand no longer having to worry about what their portfolio prospectus shows for Q3 holdings which is always what they hold at the end of the month, it's a parlor trick and only works for so long with underperformance, but they do it every time.

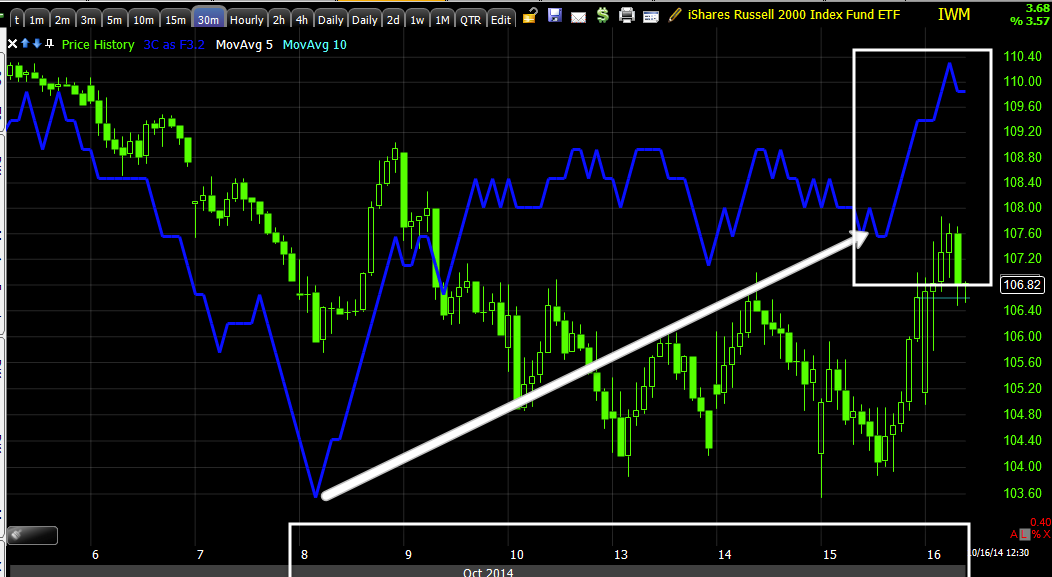
IWM 30 min leading positive.

Once these larger strategic timeframes are in place, probabilities build and we start looking for the short term tactical timing timeframes like 1-5 min build in for actual entries/exits.

IWM 15 min trend, this chart alone is capable of a strong move and again, Oct. 2nd shows up as a start date. As hard as that may be to comprehend, smart money's positions are so large, it takes them time to put together a billion dollar single position and they need lower prices and supply to do it.

The IWm 5 min leading positive is what I've been looking for and also note the reversal process building in place.

I don't think a head fake move is needed as the decline did that job.

This is the 3x short IWM, SRTY, just for confirmation, it is leading negative at 60 min.

For me, a good reason to book trading gains there.

QQQ 60 min is positive, not as strong as IWM, but still a strong 60 min divergence.

The 30 min chart, again with activity starting as early as Oct. 2nd after Q3 ended.

3x long QQQ, TQQQ with a 10 min leading positive, also at Oct. 2nd as a start. The start of accumulation isn't a but signal, it's just showing us what's going on under visible trade.

And the more recent 5 min leading positive I have been looking for.

UPRO, 3x long SPX 2 min trend, also at Oct. 2nd.

SPY 2 min leading positive, also in to October 2nd.

UPRO  10 min trend positive, also Oct. 2nd.

I think this is a much bigger base than it appears to be, we'll know when (assuming we're right) is over as it would be a bigger upside move than what we've seen on the downside.

Still, I want to enter positions for the right reasons, that means strong signals even though we have other strong signals that have been very effective like SPX/RUT Ratio and VIX term structure.

Probabilities aren't the same as high probabilities/low risk trades.

Intraday Pullback

The Index Futures and most of the averages are showing an intraday pullback, which is what I was hoping to see.

 ES/SPX Futures

NQ/NASDAQ 100 Futures

TF / Russell 2000 Futures.

During this pullback, I'm going to try to get out as many updated charts as possible for swing trade candidates.

I'm looking, especially if we see continued improvement on a pullback, to add to FAS and bring that up to a full trading position, UPRO as well and URTY, 3x long IWM.

As for the NASDAQ, TQQQ would be a good choice, but I think I might go with some November 22nd Call options with a strike around $92 or so.

Again, I want to wait on a pullback and hopefully see continued improvement, but at this point the IWM is positive out to 60 minutes and looking pretty darn good, I almost entered it about 30 mins ago before I started seeing signs of a pullback , which I welcome as they just give us more time to build stronger positive divergences and a stronger base.

All core shorts such as NFLX will stay as they are, I'm mostly only looking at trading positions long, everything else I want aligned with the highest long term probabilities as those are meant to be core, trend positions.

HYG Update

First I just want to show the continuing leading in the SPX/RUT Ratio, again the last time this happened to this degree on a positive side was the first week of August before the August rally.

 SPX/RUT Ratio positive and the VIX Term Structure is inverted still, a buy signal.

There's no reason HYG would be under any kind of accumulation unless something was going oon, it continues to lead the SPX as well. 15 min chart.

10 min HYG

5 min HYG

2 min HYG.

This is one of the levers in credit used to manipulate the market, but they get out of this one quick which is why it tends to lead, again, there's no reason we'd see this level of positive divergence in HYG unless there was an upside event in the works.

Quick Market Update

It looks like we will get a little intraday pullback, hopefully this allows me enough time to get a Leading Indicators post out.

So far today, what I was hoping to see yesterday in to today (in the area) is moving along, we are getting stronger divergences, at this point the IWM's is just about strong enough that I'd be looking to enter a URTY 3x long Russell 2000 long position soon.

I'll be back with you in a few minutes as I go through Leading Indicators, HYG is being accumulated.

For the Second Time in A Week

Earlier in the week it was the San Fran F_E_D President saying the F_E_D should consider QE 4, and now this...

From MarketWatch...

Bullard Says Fed Should Consider Delay in Ending QE

I still think they're trying to talk the $USD down, however buyers are going to see this as a dream come true, the F_E_D is re-engaged.. Look out on the upside, we may be seeing a VERY sharp move shortly.

I'm still holding out for strong signals, despite what I think of probabilities , especially with this news just out.

Opening Indications

The concept of 3C charts picking up where they left off never ceases to amaze me.

This was from the late day, 3:51 p.m. post yesterday, Quick End of Day Update,

",the IWM is up 1% and ther are a bunch of second day bullish reversal candles, however in to the close there are some 1 min charts not confirming, this is a short term timeframe that doesn't carry that much weight, but the market tends to pick up where these divergences left off. A day tomorrow somewhere in today's range adding to the divergences already put in today would be a signal I would trade for sure."

And in our "New Normal", volatility of .50% to 1% isn't anything really that big of a deal , unlike 6 months ago when we'd go 2-3 months without seeing a single day above .50% either way.

As for the intraday 1 min charts failing to confirm late yesterday, EXCEPT in the IWM...here's a look this morning...

 The 1 min IWM confirmed price in to the close yesterday (green arrow) and wuickly moved right back to that level after being down -.50% or so on the open, it moved quickly right back to the area of yesterday's close and confirmation.

The SPY on the other hand...
 Did not have confirmation in to the close which would mean I'd expect that divergence to pick up where it left off this morning and as you see, the SPY, although moving on the ES positive divegrence pre-market, gapped down in line with the intraday closing 3C divergence.

IWM 5 min is looking really good at this point, prices, although down near 1% right now in some cases, are right in the range I mentioned yesterday and above where if they continue the same rate of divergence in the 1-5 min timeframes, I'll be glad to raise my long risk exposure as confirmation will be higher and in the IWM's case, there's a nice reversal process building up, even though on a daily chart it will look like a sharp "V".


As for early opening action, ES-S&P Emini futures pointed pout a pre-market positive divegrence and it has fired off.

Now, just a bit more patience, I suspect we will get strong confirmation as we have been building that was since the 2nd, which would be one heck of a base and in this volatility, one heck of a move.

A.M. Update

Good morning...

After a somewhat ugly overnight session in Asia with the Shanghai Composite down -.72%, Hang Seng -1.06 and the Nikkei -2.22%, strangely US Index futures were having a pretty good run until Europe opened.

To sum it up, the safe haven German Bund dropped to a fresh record low of .715% while the periphery of Europe saw yields explode, take Greece for example with a 100 bps climb,  NEAR 1% MOVE NEAR 9%, THAT'S ABOUT 200 BPS THIS WEEK ALONE.

APPARENTLY THE CATALYST WAS A FAILED SPANISH AUCTION, OR AT LEAST ONE THAT FAILED TO SELL THE MAX. TARGETED BONDS. That doesn't really hold that much water with me, but either way Portuguese, Irish and Spanish bonds all saw yields jump between 20 and 30 bps.

At last look the FTSE was down -1.74%, the DAX -1.59% and the CAC-40 -2.22%.

The US 10 year dropped below 2%.

Oddly yesterday's higher ES volume is 180 degrees opposite today, From NANEX ...

The orange line in the center is yesterday's liquidity in the E-mini's, the purple is today's thus far.

As NANEX points out, "Low liquidity doesn't make the market go down, it makes it volatile which stresses the system".

So prepare for just about anything, if you though yesterday was volatile, take the IWM's drop and pop, today should be even more so, this is why I said volatility and unpredictability go up as we move to a stage 4 decline.

As for ES futures, they look the same as NQ and TF...
The 1 min chart shows the overnight smooth sailing and then the market essentially puking about the time Europe opened.

You can see the negative 3C divegrence in to the highs overnight and a positive in to pre-market.

So hold on, this is going to be an interesting session. I'm still on track with what I said yesterday, until we get stronger signals than yesterday which were decent, I'm fine with my level of risk (mostly cash with 2 partial positions UPRO/FAS).