Tuesday, November 11, 2014

Futures Indications

I took a quick swing through futures and grabbed as many charts as I thought were worth vrabbing.

It's one thing to see a chart with a strong divergence, the kind that jumps off the chart, that you don't have to look for.  Sometimes I thumb through hundreds of charts a night using 3C and the space bar to forward to the next symbol, I've literally have grown so use to looking for divergences that are screaming "There's a huge edge here, Do NOT ignore it!", that I can generally flip through about two charts a second, only stopping and lingering longer for that chart that jumped off the screen.

The point is, that kind of divergence on a single timeframe is one thing and don't discount its value, but that asset having what I call a "Full House", meaning a number of timeframes all showing similar divergences, I know I have a real pearl.

However even beyond that, when I have an asset that has multiple asset confirmation, take the QQQ's with confirmation in QID and QLD and perhaps XLK as well, that's a whole new level of confirmation, much stronger.

But when I have multiple averages in multiple timeframes telling me the same message of the market, we've reached new heights of market edges.

You might think that's impressive and it is, but what I'm seeing now goes even further. When you have assets that are closely correlated like QQQ/QID/QLD or QQQ/SPY/IWM/DIA, that's very strong confirmation, but when you add assets that are totally different asset types altogether confirming the same ideas, such as VIX Futures, Treasury Bond Futures, Credit, Currencies in single currency futures and pairs, all showing a push toward the same place via multiple correlations, you have the grand slam of analysis (add leading indicators in there as well and breadth charts which add a whole new dimension to your analysis).

These kinds of correlations, confirmations and probabilities can't be made up or cherry picked, they are so deeply pervasive that the entire market is showing just how interconnected it is and just how big the billionaires boys club really is. Technical analysis grew from the Internet making cheap online brokers possible, before that it was known and often discredited as "Voodoo Analysis" with comments like, "How can squiggly lines tell you anything about the value of a stock and where price is going?". However as it turns out, Technical Analysis was the easy way out, the lazy person's choice analysis because it can be boiled down to something as simple as a price/moving average cross over or a moving average cross over. TA gained in popularity, from Voodoo to mainstream because of people's laziness. This type of Technical Analysis, I think you'll agree, is anything but lazy.

This may be a bit confusing with so many assets and so many timeframes. Let me just put it like this, negative Index futures means negative market going forward. Negative USD means $USD FX pairs like USD/JPY and EUR/USD will be effected. Stronger positive Euro and Yen signals mean the USD/JPY which has been used to diminishing effect, to ramp the market should see a massive turn to the downside which is what I predicted almost 2 years ago, still linked on the member's page under "Currency Crisis" which looks for a rising Yen as the market falls.

The strengthening Euro with a weakening dollar means the heavily shorted EUR/USD has a chance to pop strongly to the upside, also signaling on a stronger Euro that ECB QE is less likely, also a market negative.

With a weaker $USD, $USD dollar denominated assets should rise like gold, silver, oil and numerous commodities, but many will be tempered by decreasing global demand, so the commodities which we look at have to have more than a weak $USD, they need strong accumulation signals which is why ?I bring up silver recently.

Interest rates and Bond Futures not only signal a flight to safety trade, but bond futures trade opposite bond yields and the market tends to follow yields so higher bond prices means lower yields and lower stock prices. All of these things mentioned above are shaping up in different strengths, across the board, the message is: market weakness, EUR/USD strength (hinting at diminishing chances of ECB QE), USD/JPY weakness (and a lower carry trade as well as Nikkei 225), Treasury strength- especially in the long end, lower rates especially in the long end, and higher silver prices as well as other commodities, perhaps natural gas.

The charts...

EQUITY FUTURES
 Short term 5 min ES chart, remember I have been using 5 min charts in futures as confirmation and the prerequisite for a swing trade, in this case it would be short SPX/SPT.

 NQ/NASDAQ 100 5 min charts also leading negative in a range,  several of you have written in about the "Watching Grass grow" market non-volatility, I just remind you that when the market is quiet it is one of the most dangerous times as it lulls us in to complacency, but in addition, as I often remark (those of you with children will understand), "A quiet or dull market is like the kids in the room next door being a little too quiet, you know they are up to something" and this has been proven as ranges in which activity in price is dull, happen to be one of the strongest areas for underlying 3C trade/divergences.


 TF/Russell 2000 Index futures also leading negative divergence, which is what I'd require for a swing short here, but given the longer term charts, it looks like better timing indication that we are close to a very sharp downside move, sharper than the upside October rally.

 I've started to incorporate the 3C 7 min chart in futures as several members have been using it and having good results, so I've added this to my 6 min standard for entering any trade.

The NASDAQ 100 futures are deeply leading negative divergent. Again the same message is as above, while a good swing trade timing support cart, this looks more like a timing indication for a much larger, sharper and very volatile downside move.


 TF/Russell 2000 7 min chart also deeply leading negative

TF 15 min chart, which is suggesting a larger move than just swing is leading negative.

 And suggesting an even larger move, the 30 min NASDAQ 100 futures are deeply leading negative, especially the last few days.

 TF/Russell 2000 futures 30 min shows that quiet, low volatility range, the one that seems to quiet, but is very dangerous. The leading negative divegrence is plain to see.


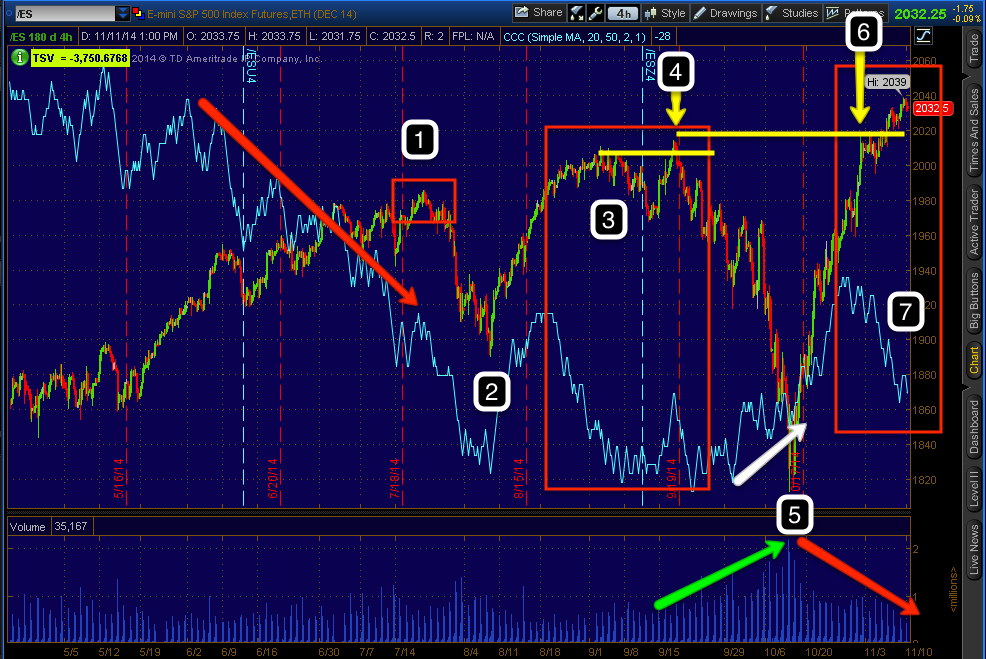
 ES / SPX E-Mini Futures 4 hour, a strong timeframe and well beyond a swing move, hinting at a sub intermediate move that makes a new low in the market, below the October lows shows from left to right #1 the July negative divegrence leading to an SPX decline of 4% and R2K decline of 8%, this also brought breadth down to deeply oversold levels which I wrote about on the night of July 31st in which the SPX was down 2%, suggesting this was a signal that a base would form for a sharp upside move.

At #2 a week long base formed and broke out to stage 2 mark up, with 10-days of breadth repair before breadth started deteriorating as the market moved to a stage 3 top at #3 and a head fake move (Igloo with Chimney- with the chimney being the head fake) at #4 with leading negative divergences and leading indicators taking us to the anticipated new low, below the August lows in which we saw almost 2 weeks of base build since October 2nd, a level in which we have long surpassed so even if you went long on the first hint of a positive divegrence, you'd be in the green right now.

At #5 the base for the October rally which we warned well ahead of time would be a face ripping , intense rally that was meant to change sentiment as I was saying at the time, "too many people are calling this a top and that makes me uncomfortable, a top will come when most people are bullish"  which was the entire point of the rally and my challenge to book mark that post as I said the rally would be so strong, even with forewarning of what to expect, even our members would be moved to emotional paralysis and a difficult time using the gift of market strength to short into, something  we would have given anything for on October 14th.

#6 is the head fake move to new highs needed to sell the rally as legitimate, the only way to get retail buying in what was otherwise a very bearish market. Also note the volume on the way down in October and the way up, VILUME SHOULD ALWAYS ADVANCE IN A HEALTHY RALLY. WOULD YOU BUY SOMETHING AT HIGHER PRICES WITH LOWER DEMAND AS AN INVESTMENT?

#7 is simply the deep leading negative divegrence through this leg, worse than the two previous pivot tops, which I believe form a Broadening top.


VIX Futures
 VIX moves opposite the market, the leading positive on a 15 min chart is moving toward a timing signal.

The real interesting chart is the 60 min which has shown (as the history to the left fades off the chart) a leading negative divegrence at the VIX highs and market October lows with a strong leading positive divegrence now, this is not F_O_M_C or Non-Farm Payroll hedging, someone is convinced of  a sharp move lower.

Currencies
 USDX 4 hour chart from strength during the 12 consecutive weekly gains to the recent weekly losses and a leading negative divegrence, I fully expect a deep $USDX correction.

 $USDX 60 min chart from strong to negative

$USDX 15 min chart, this divegrence has expanded from 60 min to 4 hour and is moving in to the shorter timing timeframes like this 15 min chart.

SILVER
 The historical $USD legacy arbitrage seems to be returning meaning assets that are dollar denominated should gain on a weaker dollar such as silver, covered earlier today.

This is a 60 min positive divegrence as silver hits stops under support.

Silver 30 min positive

Currencies- this is with an emphasis on pair, cary trade pairs.

 60 min Yen that is in line on the move lower and switched to 60 min leading positive, with a leading negative in $USDX, this suggests lower $USD/JPY prices coming and with that a lower SPX and Nikkei 225. At 60 min, this looks to be a significant move.

 Yen 30 min leading positive is expanding

Yen 7 min is now within the normal swing trade zone

Of course a strong Yen and weaker USD means a weaker USD/JPY and I don't have to tell you what that means for Index futures which are already giving the same signal on their own.


 Euro 60 min leading positive as the Euro has been in a nasty down trend and the EUR/USD sliding, again  with a positive 60 min Euro and negative $USD, this suggests the downtrend in EUR/USD is about to change and with that sentiment regarding the probability of an ECB QE announcement, having direct and indirect effects on US equity markets, all negative.


 Euro 30 min is growing just like the Yen, again the currency pair and effects on Index futures are all linked here.

Treasury Futures
30 year Treasury as seen in recent TLT posts this week and Treasury futures show the negative divegrence sending 30 year treasury futures as well as TLT lower, but since a strong leading positive and large positive divgerence suggest yields fall sharply with equities following.

We have at least 10 different assets in multiple timeframes in very different asset classes all pointing to the same thing.


BABA Follow Up

Yesterday due to popular demand, I covered BABA in Alibaba (BABA) with a first paragraph excerpt as follows:

"...it may be building up to a pullback that is worth a swing trade short (or options),  it's on that pullback that we'll know what kind of shape BABA is really in."

This is more of a caveat to the larger message that BABA's trend/charts look very strong, but a pullback soon looks very probable and their may either be a swing trade there or at least it will tell us if there's a change in character in BABA or offer a long entry opportunity at a lower cost basis and lower risk.

I set price alerts as usual with these pullback trades which have been popping off all morning as BABA is down -3.22% on the day right now, even more than that at 11 a.m. lows.  I'm not going to repost all of the main charts telling BABA's story, they can be found here, Alibaba (BABA), however short term charts need some updating as the situation has changed.

 This is the "seemingly" bullish upside rate of change (ROC), that is really a warning flag that the trend is about to change,  in addition this was also a channel buster, these typically breakout of the channel and quickly drop to either the bottom of the channel or below the channel; it is sort of the same psychological principle as a bear trap or failed breakout.


 I used a 30 bar moving average on a 60 min chart to define the trend and a break of that moving average should lead to a deeper pullback. I'd suspect somewhere around the 50-bar 60 min chart (blue) moving average which is around $110.

I had to widen out the Trend Channel by 1 standard deviation (on the edit indicator change with width setting from 10 to 20) since there's so little history, it's not possible to use a daily Channel, but this channel has held the entire trend including a close call on 10/28. The current stop for this trend is $114.24. Note that's the stop, which differs from the $110.00 guess-timate pullback area above at the 60 min 50-bar moving average.


 Since yesterday (in the red box), the intraday 3 min chart has grown worse to a deeper leading negative divegrence, pulling price down (now around -3%).

After a break of the Trend Channel there can be some sideways volatility, for any counter trend short trade I'd like to see some volatile lateral chop as it would give usa clear picture as to whether BAB is worth a counter trend short swing trade. Otherwise the next trade oopportunity we'd be looking at is a long entry on the pullback so long as the underlying charts stay strong and show accumulation. If this is not the case, then the next trade we'd be looking at is a potential short trade if BABA is in fact deteriorating.

Remember this is not an average IPO as BABA's valuation closed yesterday as the 6th largest US traded company.  The uneasy part of the IPO is the boilerplate/standard 6 month lock up for insider and underwriter shares which in a large part, does not apply to BABA, meaning insiders who normally can't sell within the first 6 months of a new issue (IPO), are not entirely accountable for this IPO standard, there are quite a few shares that are held by insiders and the IPO underwriters not covered under the 6 month lock-up period, one of the stranger components of the Alibaba IPO.


The intraday chart went negative in to the close last night, similar to the VIX divegrence at the same area in which VIX spike despite the SPX closing higher as well. So far the rest of the -3+% down day has been confirmed by 3C, in line.


Silver Update

Silver has been one of my least favorite assets to analyze and to trade, largely because of huge manipulation of the precious metal (as more and more stories are being confirmed on a near weekly basis of gold and silver price manipulation), however if we are following the underlying money flows, manipulation or not, as long as there;s a strong signal we can be on the right side of the trade.

It has been a long time since I've even covered silver, but I think this is one of those moments in which something is happening and it's broad enough that it can't be ignored. I would not call Silver a long trade right now, but if things keep developing as they have been, it may be in a very short period of time.
 This was the period of JPM's greatest intervention and Silver manipulation run by Blythe Masters as JPM inherited a large silver short when they absorbed Bear Stearns.

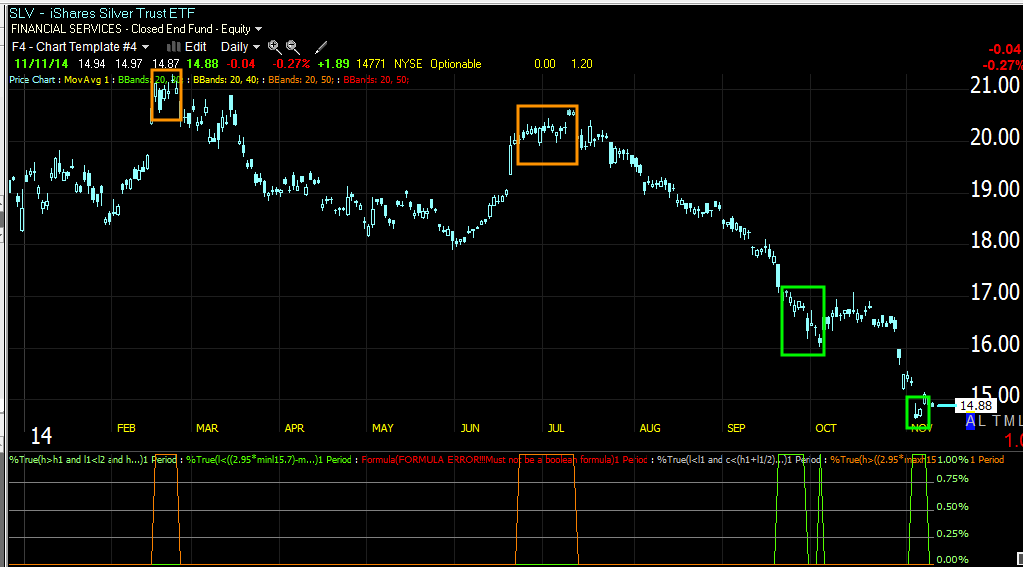
Recently after a range formed there was a high volume break (stops hit) in SLV, I suspect this is the start of a change in not only character, but trend for Silver broadly.

Silver Futures...
 This is a day chart during the same period, since about July, note the change in character from the previous 3C downside confirmation

The negative at the July pivot is clear, here the change in character since confirmation is less clear, but it's there to a lesser degree.

 The more detailed 60 min chart shows the period since price moved below that range on large volume with a positive divegrence through the entire episode of stop runs.

The DeMark inspired buy/sell indicator shows previous sell signals and buy signals, although I'd like to see a little more improvement before calling this a high probability, low risk trade. I would definitely call it a probability that silver moves to the upside, but we need a bit more than that.

 The daily Trend Channel has held the entire trend down including the consolidation just before prices slipped below support and triggered huge volume in stops/sell/short orders.

The current stop on a daily close is right at $15.50, but it will continue to move lower hour by hour.

 SLV 30 min should show a clear trend from distribution to confirmation to accumulation.

The 15 min chart is the same, I don't think you even need annotations on the chart.

Confirming assets showing the same trends....

 This is PSLV 60 min showing the same distribution at the July pivot and in line or 3C price/trend confirmation at the green arrow before a change in character with a sharp leading positive 60 min divergence, they rarely move this sharply on this long of a timeframe. I suspect a lot of volume was created on the move below the range and it was accumulated in large size.

 AGQ 2x long silver shows the same confirmation at the green arrows, distribution at the July pivot, confirmation on the downtrend and a change in character with a large relative positive divegrence.

 GPL, Great Panther Silver also shows the same trend, except this is a lot sharper as an individual company rather than an ETF, I may be looking at the companies more than ETF's it depends on how much stronger their signals are vs the leverage of some of the ETFs.

This is FSM, Fortuna Silver mines again showing the same trend, but with a stronger set of signals earlier, it seems the miners may be leading as they have recently been doing with gold, an old correlation from before QE.

SIVR Silver Trust again with the same trend story and recent change in character.


SLW's trend...

Like I said, there's definitely something going on here and probabilities are there for a move up in silver, there's tons of confirmation via multiple assets, I'd like to see more confirmation in multiple timeframes and then I think we have a high probability, low risk trade.


NASDAQ Getting Hit a Little Harder Than it Apppears

Looking at the QQQ in regular hours doesn't really show the extent to which it getting was hit this morning, nor what a soft spot it's in.

 QQQ 3 min used for timing with a very soft spot, almost like the top of an egg that is soft.

I used this 10 min chart  to show where the trend was under accumulation and building a study, solid base in white, the trend starting where it is in mark up and sold in green and in yellow where it's still strong , but starting to show some weakness/distribution and red a very weak area that can really break at any time, full on selling/distribution/short selling, but remember for every seller there's a buyer, this is often called churning in which strong hands sell shares to weak hands or retail. You'd have to be weak hands to be buying up here.

 This is the NASDAQ futures since before the cash open, this is what  I meant in that the NASDAQ is actually looking worse than what the Q's show.

As far as the strongest probability charts, these are the 60 min charts for QQQ, QLQ and QID (the last two are leveraged long QQQ and leveraged short QQQ). These leveraged ETF's do move in similar price fashion, that's what they are meant to do, but not necessarily in similar 3C fashion, because volume is not the same, that's not what the ETF is meant to recreate, only price, thus these are excellent confirmation assets.

 QQQ 60 min

QLD 2x leveraged long QQQ

And the inverse QID, 2x short QQQ, which should look like the mirror opposite for confirmation.

These are very strong charts at 60 minutes, they are the highest probability resolution of this area where we have a rounding top.

Happy Veterans' Day

Thanks for your service, I have to thank my Veteran Andrea for her service as a medic and Blackhawk pilot in the Army with 15 years of service...
The beautiful Andrea in her BlackHawk.

Interestingly over night we had another rumor out of Reuters, from an unnamed source close to the Prime Minister's office saying that PM Abe will likely hold off on a planned sales tax increase, the ironic thing was Reuters reported this story, the exact same story over the weekend, but they run it again two days later while the algos are running and just at the European open sending the USD/JPY ramping higher to 116, just about 200 pips higher. In any case, there's your Reuter's ramp job which is far from the first over the last two weeks alone, not to mention years.

Also the F_E_D's Rosengren said the F_E_D should aggressively fight low inflation as aggressively as high inflation and should be patient in rising rates until there's more certainty, but he added there are a number of forces conspiring against that...?

Today being Vetrans' Day will see the US Bond market closed (no checks and balances), Chicago pit trade is closed while NYSE and NYMEX remain open and CME FX and Interest Rate open outcry markets are closed, but CME's Globex electronic market is open.

We start the day with ES and NQ intraday in line, but TF/Russell 2000 is showing a pretty sizable negative divegrence right now.

TF 1 min at the open.