Tuesday, December 16, 2014

Quick Futures Update


Despite the early gains in the averages shrinking since just after the European close, there are positive signals in the daily charts, while not all yet at traditional reversal (bullish) candles, as I said, there are promising signs (in the context of the IWM bounce/head fake scenario we have looked at).

As for 1 min charts, like this morning there's little of note or excitement...
 ES 1 min in line, positive, in line, nothing too exciting.

 Similar NQ 1 min action with a more clear negative intraday divergence at the intraday highs, but otherwise very similar.

 And TF with its own chart, but the end result the same, rather dull intraday 1 min charts.
At the 5 min charts, this is where we have had a deficit of positive divergences to bridge the ones on 7 min charts and bring the market to action as HYG, TLT and VIX futures are suggesting as well as other assets, the short term oversold condition, short term oversold breadth and the general concepts of head fakes and mass psychology.

On other 5 min charts, Gold is about in line, Crude oil is as well as are ES and NQ index futures,  however take note that these could flip to positive 5 min charts easily overnight with strength in the 7 min charts.


 ES 5 min nearly perfectly in line just as NQ mentioned above, however,  the one average I expect to lead, the IWM/Russell 2000 has a much different looking 5 min chart.


TF 5 min Russell 2000 futures, clearly positive.

With just about all index futures positive on the 7 min chart, as I said, the 5 min chart could go positive between now and the overnight session in a snap, thus these 7 min positives are of interest.

While I don't have a great feel for the 4th ramping lever, USD/JPY, I can see that there's some 5 min and 7 min 3C weakness, which would help USD/JPY higher and the index futures along with it. $USDX divergences are much less noteworthy, but all that is really needed is a weakening Yen to push USD/JPY higher.

ZB/30-year Treasury futures are also negative in the 5 min space, add that to the signals in TLT.

And VIX futures are negative in the 7 min space, also to be considered with the earlier VIX update/s. Thus it's still the 5 min charts that are the only thing that I'd want to see before making any decision as to whether piggy back longs are worth the risk. However as noted earlier, the 5 min chart can and often does go positive in a short period, often during the overnight session and don't forget tomorrow we have the F_O_M_C at 2 p.m.

While I'm not going to presume to have any idea what the F_O_M_C policy statement will look like or the market's reaction to it unless a clear leak is obvious as we have found on about 3 occasions, I will remind you as always, BEWARE THE F_E_D KNEE JERK REACTION AS IT IS ALMOST ALWAYS WRONG.

While the knee jerk reaction is typically faded within hours to a week or two, it is nearly always faded meaning the initial move is often the wrong move. Seeing the recent developments since late last week, I find it interesting they are coming to a head the day before the F_O_M_C, right about the time the market expects the Santa Claus rally and among still bullish sentiment within the "Buy the Dip" crowd with manipulation lever assets coming on line like Yields/Treasuries, HYG, VXX and possibly USD/JPY with a weakening JPY.

It could be that no matter what the F_E_D says, they've already set up the market to respond favorably and market participants will buy that no matter what the F_O_M_C says if they see prices moving in the correct direction, THUS WHILE I HAVE NO PROOF THAT OUR ANTICIPATED IWM HEAD FAKE MOVE IS LINING UP TIMING WISE WITH THE F_O_M_C, IT WOULD MAKE SENSE BEING THAT THE INITIAL KNEE JERK COULD BE THE STRONG MOMENTUM THE IWM NEEDS TO MAKE THE BREAKOUT AND THE FACT THAT THE KNEE JERK IS NEARLY ALWAYS WRONG AND FADED, WHICH IS WHAT WE EXPECT TO HAPPEN TO THE IWM AFTER IT HAS MADE ITS $118+ BREAKOUT ABOVE THE 6 WEEK RANGE.


Gold Update

In this update I'm not considering the longer term probabilities in gold except in passing, I'm more focused on near term probabilities as we do have an open trading short in GLD which is near break-even despite some strong gains last week that had it at a bit more of a loss, it has come back nicely to us.


There are a lot of dynamics in gold right now, the big one is central banks buying it up, notably China.

Typically gold is bought on expectations of inflation, note I said "expectations", meaning before inflation has already started as gold is a natural hedge against inflation. However, as near sited as it may or may not be, inflation expectations right now officially are lower than the F_E_D would like, which is not being helped by lower oil prices.

This is the current GLD short position, down about a half percent so not bad at all.


In 2011 after a near perfect uptrend since QE started which caused inflation initially, we had extensive gold analysis and called a top at the highs of 2011 and further called an Intermediate to primary downtrend to follow, this was a very unpopular call at the time as EVERYONE was a gold bug. I even had non-investor friends buying gold and silver off the Internet, which as I pointed out to them were fakes to some extent as gold coins are struck from a single piece and these had a clear seam at the edge in which two separate sides of a coin were joined. 

Whatever their real gold/silver content I have no idea, but they were not authentic coins. I mention this just to illustrate how insane the precious metal frenzy had become and thus calling a top in gold was not a popular thing to do at the time, but not only was it correct, the years following also proved our primary downtrend correct as well.

 The yellow area is where we called the top in gold based on 3C charts and a dramatic change in price's rate of change to the upside, remember changes in character lead to changes in trends and seemingly bullish moves are often red flag warnings that something big is about to change as we recently forecasted on a smaller basis with BABA's Channel Buster upside move.

I suspect the descending-looking triangle through the last year and a half or so, is a long term base in gold getting itself together, but this is another subject for another time.

 Note the daily Sell and buy signals in GLD and their following trends. Also that GLD was below long term support at the buy signal. Gold had outstanding performance on the week last week, but I suspect our short trading position in GLD will hold its own.

 This appears to be long term capitulation or a selling climax at the yellow arrow. As I often note, this doesn't mean there's no more downside or that an upside reversal is imminent, it just opens the door to a new base and usually sees additional downside in reaching that new base area. This concept holds true for nearly all selling climaxes or "Capitulation" so I'd keep it in your tool box (the way the asset acts just after).


 The daily chart in GLD with the buy signal from our custom indicator at the lows (white trendline).

The long term 4-day GLD 3C trend shows confirmation of the uptrend in to 2011 and a clear, large negative divergence in to the 2011 highs followed by downtrend confirmation and what looks like a large year+ base in the works.

I don't want to get caught short when this moves, but I don't think it's there and GLD short is a trade, not a core position.

 The 60 min chart seems to show much recent improvement, although very recent problems near term, that's what I'm looking to trade with GLD short.


 The 30 min chart adds more color. Note the positive divergence at the same time our custom buy/sell indicator based on DeMark principles gave a buy signal at those exact lows. Since though, we have seen a near term negative divergence and it has sent GLD down off last week's lofty run.

The 5 min chart gives even more color to the near term expectations with a leading negative at last week's highs suggesting they were used to sell in to. This may be because GLD will drop back as equities bounce as we expect and not be used as a flight to safety asset or it could be in response to tomorrow's F_O_M_C in which any change of language toward deflationary pressures or diminished near term inflation expectations could send gold significantly lower quickly, the trade I'm looking for.


 And the 2 min chart adds more color, again, distribution through last week's very strong performance.

As for confirmation among Gold Futures...
 The long term weekly chart holds the same positive long term bias as GLD/3C charts do in the long end.

The 4 hour chart shows accumulation at lows and a building positive chart so I do think gold and likely gold miners do resolve to the upside ultimately, but I'm more interested right now in more immediate trends.

 The 60 min gold futures 3C chart show the same distribution in to last week's highs as the charts above, suggesting we do have additional near term lower prices making our gold short look like it will be a profitable endeavor.

The 5 min chart is in line with the recent losses off last week's highs.

When I see a reversal and a probable move building to the upside in near term trade, I'll update gold again, but for now, I expect near term weakness to continue and our GLD short to profit from it.

VIX Update

While I'm addressing the VIX and VIX futures specifically, I don't want you to miss the larger point of the post. The VIX trades opposite the market, it is sometimes called the "Fear Index". A low VIX reading indicates complacency, usually as markets are rising or there's little fear of a drop, when VIX rises it indicates rising levels of fear which usually accompanies market declines.

We have had our eye on VIX since November 10th's custom buy/sell indicator's buy signal and subsequent Bollinger Band pinch which indicated a highly directional move was near to beginning, thus a market decline as well. With last week's worst weekly performance in the Dow in 3 years and the SPX's worst weekly performance in 2.5 years, there was certainly good reasons for the signals we were seeing indicating a higher VIX and lower market so try to think of the current update in the same manner.

I expect the IWM/Russell 2000's 6 week trading range that has already been broken to the downside to gain market momentum on an upside reversal as new shorts are squeezed, thus creating the head fake or second part of a Crazy Ivan shakeout, not only offering excellent short side entries with less risk, but one of the best timing indicators we have for a stage 4 reversal/decline and I know we already saw that start last week, but without a head fake move in the IWM with such a clear range, I honestly don't think we've seen the actual stage 4 decline reversal to the downside yet, meaning the resulting downside should be quite a bit stronger than last week's and last much longer, erasing all of the October gains and moving to a new lower low for the year. With HYG and TLT in place, VIX is the 3rd of 4 major levers (the USD/JPY being the last) used to ramp the market as it doesn't have the strength to do it on its own represented by a 6 week range in the IWM, unable to break out of it.

It is in this light that I present the VIX update and to be considered in such context.

First odd behavior in the VIX itself.

 Yesterday I pointed out the strange intraday volatility in the VIX one day after a Star closing candle with long legs appeared in spot VIX. There were several options exchanges broken yesterday so one could have said such volatility intraday was a result of these options exchanges down,  but the activity continues today with no option exchanges off line so far as I know.

I don't claim to know what this is beyond volatility and a change of character, but I don't believe that it should be overlooked, I think it will lead to a change in trend, even if only a brief one.

 The closing candle on Friday was up, but a Long-legged Star, which is a cause for momentum concern, it's basically indecision and the next day (yesterday ) we have a lower VIX close despite all of the averages in the red, all 9 S&P sectors in the red and most of the Morningstar groups in the red as posted in last night's Daily Wrap, a deeply oversold short term condition in the market averages that would normally see the next day (today) close green.

Today's candlestick (daily) in spot VIX above is doing little to inspire faith in a run higher in the fear index which has inverse market implications.

HOWEVER I DO NOT BELIEVE THE VIX'S UPTREND IS DONE, I DO THINK IT WILL TAKE A BREATHER.

Turning to VIX Futures ($VX)
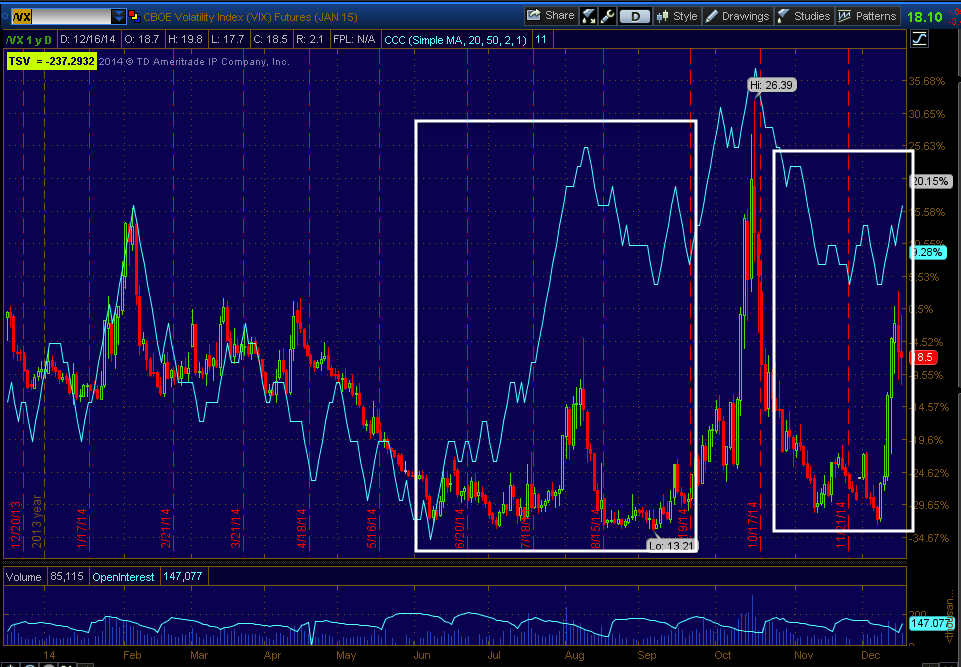
 The daily 3C VIX chart shows two massive positive divergences, the first already completed a run higher in to the market's October lows, the second is leading positive and has started a move higher.

This is the big picture and the resolution of highest probability despite short term market action in the coming days, VIX should head higher shortly after some weakness and the market much lower after some strength which I believe specifically will see the IWM above $118 (the top of its 6 week range).

 The 60 min VIX futures has shown a positive divegrence and run up, but now shows a near term negative divegrence in to it's highs.

The 30 min chart gives even more detail of the area seen above. Thus I do believe VIX comes down, just as I believe the market bounces up around the IWM's range.


Longer term, VXX Short term VIX futures confirms the highest probability resolution in showing a huge leading positive divegrence, thus I expect a head fake move in the market, some near term VIX downside and it all to be followed with VIX moving to a new high and the market to a new low for the year.

This is the 3rd of the 4 major levers or usual suspects.


Averages, HYG, TLT Update

I think we are probably very close to the IWM move I have been theorizing about and that I mentioned in the last post.

Some of the levers like HYG that have been a bit slow to come around to the area where they are needed to be effective, usually at least the 5 min chart, are now moving much more quickly.

Tomorrow's F_O_M_C's typical knee jerk reaction could be the perfect cover/catalyst for such a move. Again, whether or not this can be or is worth the risk of trading long I suppose depends on your risk tolerance, your ability to react timely and some further chart strengthening, but the trade I think you don't want to miss either way is to sell short in to any price strength. MArket character has changed dramatically, market trends follow.

As for the averages...
 SPY 1 min leading positive

SPY 2 min

The SPY 5 min is just starting to come around, I suspect it will show a stronger divegrence by day's end.

Although make no mistake about where the highest probabilities are and just how badly this market is falling apart- 30 min SPY.

QQQ 1 min

QQQ 2 min

QQQ 3 min

And just barely the 5 min, I also think this is positive in a bigger way by day's end, interestingly just in time for the F_O_M_C tomorrow.

 IWM 2 min

IWM 5 min, note there appear to be two accumulation areas, generally you'd think to average them, but price on a 3C divegrence will almost always far surpass the first divergence (the higher one), so it can easily break above the range. This may "seem" like a bullish event, believe me, it's not.


HYG 1 min which hasn't been a problem.

 HYG 2 min leading positive

HYG suddenly strongly leading positive and we were missing the 5 min chart that would be needed for market support.

Now HYG's 5 min leading positive.

So we are close to ready to go.

TLT on the other hand, 2 min negative

3 min negative

And for the first time the 5 min chart that has been in line is going negative.

These are two of the 3 or 4 main levers that will be used to get IWM above the $118 level where a head fake/bull trap should be set leading to a true stage 4 decline, much sharper than anything from last week.

IWM Still VERY Much Within Striking Distance

Looking at the SPX it's hard to imagine any significant bounce any time soon and I say significant only because in order to undo last week's worst market performance in 3 years, any move to change sentiment (and if it doesn't create motion by changing sentiment, what good is it?), needs to be impressive which is exactly what the IWM breakout above it's range would be as it's such a long range never penetrated on the upside.

From a conceptual point of view, it's also a long top/range without a head fake move, meaning I don't really even consider this the real fall of the market.

For example...
 The IWM's larger top that is over a year long and is at a loss year to date put in the same initial head fake breakdown and shakeout of shorts as the SPX did.

SPX made the same larger top head fake/Crazy Ivan shakeout on a larger scale . However looking at the SPX, it appears it has lost more ground, partly an illusion because of the IWM's long term range.

Here's the IWM range and the first half of a Crazy Ivan shakeout below the range, note all momentum has dried up as the stops and orders were hit below the range, it's in perfect striking distance for the upside head fake (second half ) of the Crazy Ivan shakeout and setting up the head fake move for the actual stage 4 decline, sharper than what we saw last week.

The charts of the averages themselves look more impressive very near term than the futures, while the futures have a better bird's eye view of the entire area and process.


I'll be updating this morning's charts, but notice IWM is making a Tweezer Bottom so far today off of yesterday's extremely short term oversold condition with 9 of 9 S&P sectors red and something like only 38 of 239 MS groups green, the rest red.

Our thesis of a Crazy Ivan/Santa Claus rally head fake/shakeout or bull trap is still very much within reason.

Index Futures This Morning

Thus far index futures are not immediately inspiring for any thing to the upside, which in my view is fantastic since I'm nearly all short and have been holding that position which is working out great.

You may recall the SPX Broadening Top with a CrazyIvan Head Fake on both sides of the top pattern...
 It was just about a week ago we were sitting on top of the broadening top in a head fake move above the pattern to nullify it, before there was a move below it at the October lows giving it the momentum for the upside breakout.

This morning however, the market doesn't look inspired to make a move toward that X-Mas rally and possible bull trap.
 TF 1 min overnight is largely in line.

The 5 min charts are largely in line and until HYG meets a 5 min positive divegrence I wouldn't expect any bounce.

 HHowever at 7 min charts you can see the slow process of accumulation of some shares has started as early as last week. For a bigger view...

Even on a 60 min chart you can see where and when it started, you can also see in comparison to the negative divegrence that has brought us this far down so far, it's a fly on the wall, thus the reason I think when it comes, it is a head fake move/bull trap that fails and moves back to new lows and my target of the bottom of the Broadening top, below the October lows.

I suspect the market may make its stand around SPX 1950, perhaps timed with the F_O_M_C tomorrow? We'll know more in a few minutes, until then, keep managing those short positions and raking in the gains.