Friday, December 19, 2014

Leading Indicators Update

Everything is moving just about as perfectly as I could hope for and nothing ever goes perfectly as you'd hope for in the market, but it seems that our theory is coming all the way around to fruition.

After this I see little reason not to be looking at individual assets for positions.

First,

 Our SPX/RUT Ratio indicator in red had been leading the market all of this week and part of last week, giving a bullish signal in tandem with our VIX Term Structure indicator below with buy signals in white, on the whole these signals were no where near the size of the August lows or October lows when we last saw any such signal, but they were more evidence of the theory first put forward a week ago today as to the market's direction, first up above the IWM's/Russell 2000's 6 week trading range and then to be followed by a sharper move down continuing the week before's action which was the worst weekly action in 2.5 and 3 years for the SPX and Dow respectively. It's little wonder that the market needed an immensely strong move to counter that bearishness, much like the rally off the very bearish sentiment of the October lows which was called up to two weeks in advance with evidence a week in advance, calling it a monster move up a week before the market even bottomed, again based on mass psychology followed up by technical evidence, this is the same, but on a smaller scale. To change sentiment after last week's extreme losing streak, you need something that will make traders forget that bearish move just as they have all forgotten the near 100% bearishness of the October lows, it's simple mass psychology analysis combined with technical evidence and the head fake concept which the IWM was the onlyAVERAGE THAT HAD NOT MADE A HEAD FAKE MOVE (OFTEN SEEN RIGHT BEFORE A REVERSAL).

In any case, the same indicators above, after nearly a week of posting positive signals before the market took off, are now not confirming and posting negative signals as I'd hope to see during a head fake move.

 High Yield Corporate Credit, HYG which is one of the easiest ways to know what Wall St. has in mind via either accumulation or distribution, but especially accumulation as it is in a solid downtrend is also fading fast from leading the market in to Wednesday's open and most of the first half of the day until the short squeeze took over, it's now showing signs of failing and is no longer leading, at least not positively leading.

TLT as expected has turned, actually it was more yields expected to turn as they trade opposite TLT and Treasuries, but they exert a magnetic force on equities, pulling them toward yields so with TLT/Bonds moving higher this is what has happened to yields since 3 p.m. yesterday when the bond market closed, yet we could still get an idea of what yields were doing from TLT and Treasury futures, they were reversing.

One of the 4 levers we expected to help ramp the market, yields , did so as you can see with the 5 year yield pulling the SPX higher with it, but since yesterday's last hour of trade, it has reversed and is not negatively dislocated from the SPX and will exert a downward gravitational pull on equities.

The same is true of 10-year yields, but the most important and the strongest leading yield has been the 30 year, which we saw under distribution in 30 year bonds just days before Wednesday's move up making it obvious they'd be a lever as well.

Ironically the last 2  F_O_M_C meeting's knee jerk moves higher lasted only days as yields disconnected from stocks exuberance and shortly after that dislocation between yields/bonds and the market, the knee jerk moves not only reversed, but took back more than they gave, moving the market lower in the wake of the meetings, the same is happening now as seen below.

30 year yields no longer leading to the upside, but leading to the downside.

Then finally there's yesterday's very odd SPY trade 4 seconds before the close, a $200 million dollar trade according to NANEX that was broken up in to 1147 individual trades in the span of a single second, there are few High Frequency traders of that size and caliber who can pull that off, one is Citadel, the NY F_E_D's choice executioner of their positions, whether you want to call them Plunge Protection or consider my theory that they work in both directions, so long as the stealth bank bailout continues and banks are on the right side of the trade, preventing the kind of very politically unpopular bailouts of the 2008/Lehman/AIG era. In fact my opinion is that QE was never meant to fix the economy, if it was such a powerful tool to do so I suspect we would never have had need beyond QE1, but the banks had need beyond QE 1 and many posted entire quarters without a single day's trading losses, an interesting way to transfer money to the banks who were and are still in need of capital in a form that no one outside the market and few inside the market can understand, Quantitative easing.

If you look back to the F_E_D's initial fooling around with QE concepts in the form of Open Market Operations led by Benjamin Strong in the 1920's after World War 1 had destabilized the US economy, which Bernanke was a ardent student and apparent supporter of, you'll know that despite their initial success leading to the "Roaring 20's", Benjamin Strong dies in 1928 before he could see the full effect of his "Open MArket Operations " revolution when in 1929 the stock market crashed and the Great Depression followed.

I have written about this at length, if you'd like the link just let me know. However the point as I got a little off track, was about yesterday's odd trades in the SPY within a second, 4 seconds before the close. 1147 trades in a second for $200 million, lifting the SPX to $2130, currently at $2065 making this trade a massive loss.

The NASDAQ swiftly put out notices of a potential fat finger / erroneous trade which they'd investigate.

From NASDAQ yesterday re: the SPY trade at the EOD...
First at the bottom NASDAQ says Direct Edge is investigating potentially erroneous transactions involving the SPY between 15:50 and 16:00 (as I said, over 1 second, 4 seconds before the close). Then A Note that these are potentially "Clearly Erroneous Trades" and that traders should review their trades for any possible fat finger trades.

If NASDAQ found these to be erroneous trades, they have the option and probably would have busted up the trades, letting the fat finger off the hook as they did for Goldman Sachs a couple of years ago under similar circumstances. A later update from NASDAQ said, "All Trades Will Stand".

It would seem under normal circumstances that someone made a trade that lost a significant amount of money in a second, however no one came forward complaining of such. Thus all is not what it seems and while a large trade for sure, in the world of institutional money, it's a drop in the bucket.

While no one knows exactly what happened here yet, this is what it looked like.


 That's the trade at yesterday's close in the SPY, the one not busted up and with no one coming forward to complain of massive losses on a trade they'd like to be busted up.

This reminds me of something I was watching last night, the series finale of Spartacus which is a portrayal of the 3rd Servile War in Rome when some 120,000 freed slaves, led by escaped Gladiators from Capua led a revolt, the most serious slave rebellion Rome had seen of the 3, one which threatened the very city of Rome itself. After defeating numerous Roman legions, the Roman Senate dispatched Marcus Crassus to lead an army of EIGHT Roman legions to deal with the slave rebellion that had defeated and killed some 40 to 50 THOUSAND Roman soldiers (including militia and non-regular troops, but also regular legions).

After forcing Spartacus' forces in to a mountain valley pass, they found themselves trapped by a large wall spanning the narrow pass with a deep moat which was impassable on its own in front of the wall which had Roman soldiers on top of the wall, In the series at least (there's little contemporary evidence from the losing side, Spartacus's forces as all were killed) the Slave Army was caught in a narrow mountain pass with this wall and "apparent" Roman legions on the other side and the rest of Crassus's army on the other- caught between a rock and a hard place so to speak. However Spartacus who is said to have served in the Roman Auxiliary before being forced in to slavery and becoming a gladiator, was well versed in Roman tactics and figured that the Wall was not there to conceal the troops that were behind it, but rather the troops that were not, a facade or deception giving the image that his forces were trapped between two Roman armies. Again, in the series at least, the breached the wall to find only a small contingent of Roman forces who were easily overwhelmed allowing the Slave army to escape.

The market is not that much different from the deceptions of Marcus Crassus, for example if you have not seen this video yet, you should watch it as this is the most honest and informative interview with Jim Cramer you will ever see in which he talks about how the market is made to look one way to force a particular result, for instance maybe buying $8 million in AAPL puts in a morning to give the impression someone knows something about the impending original I-Phone release and it's not good news, when in fact no such news existed, but the number of puts bought, which Cramers says could be done with 8 to 10 million, create that image and its used against traders and he goes on to say he did this often when he managed his fund, that it is "Fun" and if you're not willing to do it, "You shouldn't be in the game", CREATING DECEPTION.

Check out the video and remember this is from just before the original Iphone was released.


Here's the LINK

In any case, after watching the video, you'll understand why I often say, "Price is deceptive".

Like Crassus' facade wall spanning the mountain pass, this trade which comes with very strange circumstances, has the effect of standing as a wall against shorts, implying someone knows something that is worth buying the SPY in such size that it caused a move like this...
This is not how any normal large trade would be filled, smart money goes to extraordinary lengths to hide their transactions and doesn't put them out there for all to see UNLESS THEY WANT IT SEEN FOR SOME REASON.

In this case, it serves to bolster the bulls thinking whoever was willing to pay this much and not ask for the trades to be busted up, must know something that would send the market significantly higher than their entry cost which is obviously excessive and at a huge loss right now.

HOWEVER FOR EVERY BUYER, THERE IS A SELLER OR SHORT SELLER, IT DOESN'T MATTER WHICH AS BOTH ARE SELLING SHARES SO SOMEONE ALSO MADE A LOT OF MONEY IN THIS TRANSACTION AS OF NOW. 

The popular view is that this is the work of the New York F_E_D through their conduit, Citadel.

In any case, what we know is that someone wanted this seen and right now. It stands as a wall as short sellers are nervous someone knows something and longs are bolstered in the same thought. However you can never forget , as Cramer's interview will make plain, that this kind of activity happens every day creating false facades to move the market in one direction or the other.. I don't see the confirming indications one would expect to see if this were the case and someone were actually dumb enough to put out such a large trade all at once, driving prices insanely against their position, starting off at a massive loss and letting the predatory algos know where they are and how to corner them. Again, don't forget that for every buyer there is a seller which is the one thing few seem to be considering in looking at this "construct".

This also reminded me of a very similar pattern, on a different scale, but the concept is EXACTLY the same, it's the very concept that led us to forecast this move since Wednesday and what comes next, the head fake.

Looking at the SPY with yesterday's late day trade, we have a common sight at tops/reversal points, the rounding top and head fake that take on the shape of an Igloo with a chimney, the chimney being to the right as the head fake move.

This is the market right now. The last time we saw a similar event was at the August rally's stage 3 top, also a rounding top that had a head fake move in to the September highs where it promptly failed and led to the sell-off to the October lows, a new, lower low as we had predicted ,in early August before the rally had even started.
This is the August cycle's rally and rounding top, the "Igloo with a Chimney " or head fake move. After that last candle you see, the market fell straight to the October lows, the most bearish sentiment in years and in some cases, on record.

Be careful with taking price at face value, it's often not what it appears.


USO Update

With our January Call options in USO, I think we have a good position for a short squeeze in USO as a nice base (mentioned yesterday) has formed in USO. While I keep hearing media referring to it as "knife catchers" and "bottom pickers" trying to find a bottom in USO/Oil, I disagree that this is a major trend change, but with the base that's in place which is sturdy for the kind of move I have anticipated, I think it is ripe for a short squeeze.

You saw the charts of $USDX weakening,m with a weaker $USD, dollar denominated assets tend to rise (The $USD Legacy Arbitrage) so I wouldn't be surprised if a dropping dollar contributes to USO upside, short squeeze momentum, but again I stress I do not think this is a trend change and if it were even the start of one, USO would have significant work to do to put in a base/reversal process that could support such a trend change short of OPEC coming out unexpectedly and cutting supply which Kuwait said won't happen , at least not until the June OPEC meeting.

 USO's second bottom in a "W" base. I'd normally expect a lower low here, a stop run before an upside reversal, but that's a probability, not a certainty.

Here's the "W" base and increasing 3C support (2min)

And the same with what looks like an obvious push of USO lower to accumulate at lower prices, the "W" base.

15 min chart's confirmation trend of the downtrend until the gap, which looks to be a short term exhaustion gap.

 The 60 min chart shows how much work would have to be done to even get a respectable base in place for a trend reversal, this is no where near even a start.

Ultimately the 4 hour trend which has some of the strongest distribution over a 3 month period I've seen in just about any asset (someone knew something long ahead of the decline and was acting months in advance) shows that even with a sharp short squeeze off a respectable base for the task, it will amount to little more than a brief pause in the downtrend.

A second trade thought is shorting a short squeeze rally when it looks to be near completion and go short USO. This would probably be a safer trade, but not as profitable in such a short period of time.

Additional Futures Color

It's hard to say just exactly what underlying trade will do on quad-witching, at least until the late afternoon (after 2 p.m. when most contracts seem to be settled), however if we continue on the trajectory and at the rate that we have seen since just after the F_O_M_C on Wednesday, all of yesterday as well as last night's and this morning's futures, I'd say we could be looking at the Crazy Ivan shakeout being complete and ready for a downside reversal as soon as Monday.

Here are some additional charts after having looked around a bit more while I wait for the morning averages to go through their normal morning games and start posting some reliable information.

While I believe TLT looks like it needs the most work to reverse what I'd call a pullback (actually a lever for Wednesday's move), the 30 year Treasury futures seem to be moving at a faster pace of repair.

USD/JPY is probably just about the last ramping asset of use and the $USDX and Yen futures keep moving closer and closer to a downside reversal there.

I also looked at some longer Index future charts and realize just how much damage has been done to them (distribution in to price strength just as Monday/Tuesday's accumulation in to price weakness powered through the strongest short squeeze in 3 years on Wednesday, mostly small caps meaning mostly the Russell 2000 as expected.

This morning's price action is far removed from the last 2 days and looks exactly like the type oof percentage gains/losses expected for an options expiration maximum pain pin to ensure the greatest dollar amount of options expire worthless. The bottom line is that all indications continue to move along the expected path to completing a Crazy Ivan shakeout /  head fake move in the market which sets the bull trap and downside momentum to carry on last week's move down in the markets.

Charts...

30 year Treasury Futures
 These were showing improvement yesterday and last night, they are now moving higher off those initial divergences, although I'm having a little difficulty reconciling the faster pace of repair in 30 year Treasury futures vs the 20+ year Treasury bond fund, TLT.

 30 year T'-Futures 7 min chart with the negative divegrence pre-F_O_M_C / Market move with the negative divergence that would send treasuries lower, yields higher and the market following yields higher as one of 4 major levers we identified earlier in the week being prepped for use early Wednesday.

 TLT's 1 min chart looks good, it's the 2, 3 min chars that aren't on the same level as this one or as 30 year T-Futures.

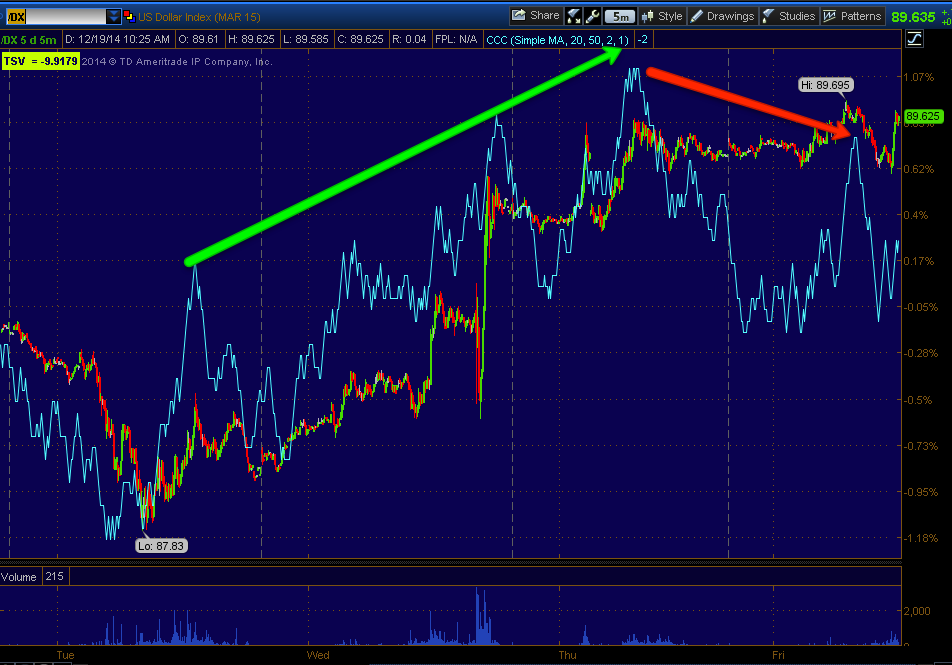
 $USD 5 min chart going from in line to negative, with the main purpose of pointing this out being the near term future of USD/JPY as it has been a ramping lever, but one that is pretty badly dislocated from Index futures, thus there's a soft spot or bubble where there should be support for the market.

 The Yen futures (5 min) started their positive divergence just about the same time as the F_O_M_C came out which should tell you something about their use and now their repair as well as USD/JPY's near term directional change probabilities.


$USD 7 min negative  which is getting sharper.

I looked at the longer 15 min charts for Index futures as they have a cleaner underlying trend, less detail, but a clearer picture and found as expected, underlying weakness/distribution in to the price move, which is part of the confirmation of a head fake move or Crazy Ivan shakeout being the specific type of head fake move.

ES 15 min- these charts really didn't see accumulation like the 7 min charts, meaning accumulation wasn't strong enough to show up here, which is one of the ways we could see this would be a high probability head fake move, you can inly go so far with a half tank of gas. However the negative divergence between 3C and price is showing up quite clearly suggesting much heavier distribution activity.

The same is plainly clear for Tf / Russell 2000 futures.

As it is for NQ / NASDAQ 100 futures.

This is why I say, "If we keep on this trajectory at this pace, we could be looking at a very nasty move down by Monday", which would also tie perfectly in to my theory that this move would be used to draw traders in to what they think is the Santa Claus rally (the last week between Christmas and the New Year in anticipation of the January Effect.

If we were to see a sharp reversal early next week, the expected Santa Claus rally will have failed, leaving numerous longs at significant losses as they will buy the Santa rally just out of expectation that it will be there every year like clock work.

A very interesting potential set up / Bull Trap.


Opening IWM Plunge

That was quite an opening plunge in the IWM/Russell 2000 and TF/Futures, taking out all overnight gains and eating in to yesterday's afternoon gains.

 TF / Russell 2000 futures in to the cash open with a steep sell-off.

At first I thought it to be related to max pain options expiration positioning as it was moving near to the upper range limits in the $118 area (IWM) .

For a better perspective of just how much it gave up and just how quickly, here's a longer view of TF from the overnight session to present.
 Although making gains most of the night, it also carried the same negative divegrence posted last night, thus the move this morning was quite steep, easily eating in to yesterday afternoon's gains.

Although the Russell did bounce back, interesting, especially compared to yesterday and even more so the day before, intraday breadth is extremely light as the NYSE TICK shows below.
 Yesterday's range with some deep downside ticks was also spending a lot of time above +1500, even on the recovery bounce this morning in the IWM, TICK is in a VERY narrow range of only +/- 500 (yellow), which is even more interesting compared to Wednesday's range, a very thin, small range for such moves.

 The ES 1 min chart is closer to in line

TF is in line as well, but with a much uglier start.

 And NQ/NASDAQ 100 futures is also in line with a very negative overnight 3C chart.

The 5 min charts are not of much interest, closer to in line right now than anything, but just as seen yesterday, then to a greater degree last night, this morning's important 7 min charts continue to see the negative divegrence/distribution of gains deepen.
 ES 5 min after being in line with the last 2 days or at least day and a half.

And TF looking much worse.

However NQ 7 min looks even worse.

We shall see soon if the charts of the averages continue to deteriorate today.

So far an interesting start.

Futures Update

As promised, here's a look at your futures update.

The long and short of it so far as I can see, the IWM needs a bit more upside, the Crazy Ivan head fake has to be clear, it needs to be a clear breakout, that's the entire point of a head fake move around such a visible range such as the one we have in place. However, the charts showing the distribution in the levers which I expected to see first and today wasn't such a surprise as well as the charts showing distribution in the Index futures (are more of a surprise being the IWM hasn't made a clean head fake move yet) as well as distribution in the averages which also came as a surprise this early is a process well under way as well as accumulation in assets like the leveraged inverse market average ETFs which typically give signals first and more clearly, this I found somewhat surprising.

I think some people are surprised by the strength of the move, but I'm not sure why as IWM $118+ was the target from the first day this theory was mentioned before we had any objective evidence. The head fake move concept is the mass psychology reason behind the move, thus after a week like last week, it has to be strong, it has to be convincing, it has to pull the longs in frenzied fashion, that's how the head fake move works, much like the downside break which provided the biggest Small Cap/Russell 2000 short squeeze in 3 years, it's the same concept although in reverse.

 Russell 2000 makes a head fake move or failed break down which occurs the day after we notice some things and use mass psychology analysis to forecast a breakout above the 6-trading week range, but a breakout that ends as a head fake move or failed break-out creating a bear trap. Monday/Tuesday's break below the range was a bear trap, remember the market was continuing last week's worst weekly performance in 3 years for the Dow and worst weekly performance in 2.5 years for the SPX, so Monday's break below the IWM's clear range would have been shorted as the move below serves as confirmation for technical traders, one of the easiest bear traps and the reason we avoid shorting initial breaks of support like the initial break of a head and shoulders top's neck line.

The levers we saw being accumulated Friday, Monday and Tuesday started the initial move as you can clearly see in HYG as it made a higher low as the SPX made a lower low, leading the market higher until short stops were hit and the squeeze was on which is exactly what we forecasted would happen. So distribution in the levers is not surprising to see first.

However this does not look like a clear, clean and unquestionable breakout in the IWM as we forecasted even though it hit the $118 level, the move was to be > than or ABOVE the $118 level as that represents (roughly) the top of the range.

The higher this moves, the stronger the bull trap and the more opportunity for distribution which we are seeing tonight in some strange ways, well what appear to be strange, although it's something we see quite often.

 ES/SPX Futures 1 min chart tonight. Note the very flat range in the ES chart since the close, this looks odd compared to the cash market just before, however as we often say, when the market seems a little too quiet as it does tonight, "It's like the kids in the room next door being a little too quiet, you know they are up to something".

Beyond that, these flat, seemingly dull price ranges are where we see the strongest underlying trade, whether distribution at a top or accumulation at a bottom and 3C is showing a large negative divergence in to the overnight session, which doesn't mean the SPX is going to fall immediately, the divergence needs to migrate to longer timeframes, but that process too is underway which is a bit surprising being the IWM hasn't made the upside breakout move that will gain the attention of longs, although the percentage move certainly has, they love to buy "confirmation " or short it which is dangerous as shorts found out early this week under the Russell 2000's range, catching them in a bear trap.

 TF 1 min is also in a latter range with an equal negative divegrence.

NQ 1 min also in a flat range. This may be op-ex related as the max pain pin is most often right at Thursday's close, yet the distribution signal is clear, smart money is selling/shorting this price strength.

 NQ 5 min's accumulation earlier in the week and a negative divegrence growing stronger on a strong chart. I expect this will be a much sharped divergence tomorrow and close to the area where we would make a short call for a downside reversal.

 Ultimately the 7 min chart matters the most, it was the longest chart to go positive before the move thus it has to be torn down and so far we have moved from the weaker relative divegrence to the stronger leading negative divegrence as you can see, gaining strength on the chart that matters the most.

As for Treasury Futures, they should continue to see accumulation and I'm leaving the 2x long TLT position open (short TBT) as the 1 min chart is showing clear accumulation of 30 year treasury futures.
 ZB 1 min 30 year treasury futures. Remember that yields which tend to pull price toward them trade opposite the Treasury itself so a move up in the 30 year Treasury is a move down in 30 year yields, thus exerting downward pressure on equities so this positive divergence is important , especially as this was one of the 4 ramping levers.

 ZB's 7 min chart which is also its most important timeframe is seeing migration of the divegrence from the shorter timeframes and has thus far put in a relative positive divegrence. "Relative divergences" are the weaker form, but being the divegrence is just migrating to a much stronger 7 min chart, it will start as relative and start to lead just as the NQ 7 min chart above began with a relative negative and is now in a leading negative divergence.

Another of the 4 ramping levers, USD/JPY...
 There's a 1 min negative divegrence in USD/JPY which doesn't mean a lot overnight on a 1 min chart so we look at the single currency futures for more guidance.

USD/JPY is already losing its ramping ability which is strange so fast as yesterday or rather Wednesday it was nearly perfectly in line and leading the SPX/ES.
USD/JPY 60 min candlesticks vs ES (purple line), note the relative performance as ES and USD/JPY have dislocated, they typically revert back to the mean which leaves ES over-extended without the support of the carry pair.

 $USDX 1 min showing a negative divegrence which it wasn't earlier today.

The divegrence is now showing up on the 5 min $USDX chart as well which it also wasn't early Thursday. Downward pressure on the $USD puts downward pressure on USD/JPY and the index futures which are already dislocated from its support.

 Additionally the Yen 5 min is leading positive, indicating a move up coming which also pressures the USD/JPY lower.

 And now the $USDX is showing a 7 min negative divegrence in to a lot of parabolic price activity, which as you know, I never trust parabolic moves up or down to hold.

The Nikkei 225 Futures.
 I had forecasted a move higher in the Nikkei Tuesday as well, the Nikkei remains strong for the moment, in my opinion the US markets will break down first and the Nikkei will follow so to see it also seeing distribution is good confirmation of the broader concept or theory which has already proved itself to be more than half correct, the other half is the days ahead and the initial signs are that the entire concept/theory which is based on the 3rd type of market analysis, Mass Psychology (with Technical and Fundamental being the other two). This entire concept and forecast started as a Mass Psychology on Friday of last week during a VERY ugly market, the worst weekly performance in 3 years, the call was followed by technical confirmation Friday, Sunday night, Monday and Tuesday with price confirmation Wednesday and Thursday right to the day as we predicted the F_O_M_C knee jerk reaction, which is almost always the wrong move and is almost always reversed within a matter of days (like the last two F_O_M_C meetings were) would serve as the "front" for the move. Anyone who listened to the policy statement and Yellen would not have called that a dovish or bullish meeting, however, as also predicted, price tone would set the initial interpretation of the F_O_M_C. Reality will reverse it.

Also of note as we have a long speculative call position in USO, it seems to have put in a solid base, the thing the market was missing on a "V" reversal which is why I decided not to trade it, not because I didn't believe it would make the strong move, but because I don't believe the move can be trusted in that I believe without the strength of a solid base, it could fail suddenly and quickly, maybe too quick to get out of the way, especially on a gap down and I'm not going to jeopardize my core short positions which are the highest probability.

As is often said, do not make long term decisions based on short term events.

 The 15 min USO positive divegrence, but more importantly as I believe it will be a short squeeze, it has a solid base or such a move which can support an extended move higher.

The typical and solid "W" bottom. Watch for a head fake move below support, this would be an area in which I would consider raising the call position from speculative to a full size position as that would be an excellent entry. Also note on this more detailed 2 min chart the increasingly positive divegrence at the same price level (the second bottom in the "W") indicating a stronger base that's likely very close to lift off.

I do NOT see this as a trend reversal, but a short squeeze, thus the use of leverage via options (calls).

Tomorrow (Friday) is an options expiration day, so watch for the max pain pin, but it is also Quadruple Witching  we could see some crazy volatility as Quad witching is the expiration of stock index futures, stock index options, stock options and single stock futures. 

See you in a few hours.