Monday, January 26, 2015

IBB NASDAQ Biotechs Follow-Up

I'm really updating the intraday charts here and the cycle or broad market mini cycle / base from Jan. 14-16th, but I did notice something similar to AAPL, both assets (NDX Biotechs & AAPL) are influential in the NASDAQ (even though Janet Yellen specifically came out and essentially said, "The rest of the market is fine, but Biotechs and Social Networking stocks are frothy".

In any case, it's a little bit interesting that our charts from last week suggested that the Russell 2000 outperform and the NASDAQ is the laggard today. From The Week Ahead on January 23rd...

"I think the IWM/Russell 2000 outperforms the other averages early in the week as it has not met minimum targets and has some better looking charts relative to the others."

I did add some longer term IBB (NASDAQ Biotech Index) charts just because of the similar situation described in the AAPL Update just posted and more broadly, the head fake concept.

 This is the daily IB (NASDAQ Biotech Index) chart. Note the same resistance level that is present in AAPL. There were a couple of pushes above intraday that failed, but the a breakout above the area in yellow, also take note of the volume on the "breakout", not exactly inspiring for a breakout,

 This is a 4 hour chart (3C) of IBB, I drew in the same trendline, it looks a little different because you are seeing intraday activity rather than the trendline across closing activity, but the same area. Also note that 3C is generally in the same place between points "A" and "B", which is essentially confirmation that nothing big has happened between those two points in similar price, however as we have been talking a lot about even before this most recent bounce got moving, because of the large size of positions and the supply./demand dynamic and a market that is seeing some really thin liquidity, especially in futures, we only expected to see negative divergences in to higher prices and just as soon as price crosses above the "breakout" area (yellow trendline), look at the very obvious change in character of 3C, a leading negative divergence. 


I actually like this indicator a lot, Don Worden's Money Stream. I don't use it a lot because often it's not very detailed or misses some stuff, but when it is giving a good signal, it's really like 3C in that when a divergence jumps off the chart and you don't need to search for it (as with any indicator), those tend to be your best signals, especially if you can confirm them in multiple assets, multiple timeframes and multiple indicators that you trust. Again, at the breakout level Money Stream (daily) leads negative.

I'm really just trying to show the bigger picture, but this is generally the kind of head fake move and confirmation that I like to use to my advantage.

 The 60 min chart has a bit more detail with a negative divegrence in to the October lows which is the same divergence seen at the head fake levels in the averages in September that led to the October lows and of course that base that formed that we described as leading to a "face ripping rally", but again it's the large leading negative divegrence to the far right.

And on a 30 min chart that was mostly confirmation in the timeframes, again a leading negative divergence at the same trendline/resistance area and break above.

This is just to establish a larger picture view as a refresher.

Perhaps some of this upside in bios that can really move (despite Yellen's warning on the Industry)  is due to the NASDAQ Composite's breadth which is not good. Below is the NASDAQ COMPOSITE, not the NASDAQ 100 (in red) ad the Composite's Advance/Decline line (green).
 Note the leading in the A/D line through 2013 and the start of 2014, then look at what happens, the A/D line not only can't keep up with the Composite which is a much broader measure than the NASDAQ 100 or even the SPX, but it is leading lower, essentially more stocks are moving lower than higher. We've seen this same thing in a number of breadth indicators around the same time in 2014, in fact the percentage of stocks above their 40-day and 200-day moving averages has been well below 50% for a lot of the time, sometimes significantly below.

Now that a little bigger picture and the head fake concept and how we try to confirm whether a move is a real move or a head fake, it's really the intraday charts I wanted to update, I just thought that this situation was so similar to the possible scenario offered in AAPL, that it was worth posting as a concept.
 As you have seen numerous times over the last week+plus, the base area in the overall market has been around the 14th-16th of January and largely on 3-5 min charts with a few exceptions. You can see the positive divegrence (base) in white to the left and at the green arrows, the 5 min chart's in line status, which is what I was talking about Friday in saying,

"I suspect it probably won't take too much longer (in to next week) for the bounce to start to fail, leaving us some good opportunities to set up some nice short positions or add to.

I am still waiting on a few leading indicators to give clear signals , but this can happen very quickly."

For example, I'd want to see this 5 min chart fail, note we've already seen a negative divegrence above on this timeframe which seems to be the most important for this particular cycle.

On intraday 2 min charts we've already seen the divergences getting ugly, looking a lot like the January 8th (and the next few days) with aggressive selling). As you know, we look for the divergence to gain enough strength that it migrates to the next longest timeframe, and in this case, since the positives are largely out to the 5 min charts, that's what I was talking about above in watching for this week.


The 2 min divegrence above this chart is migrating to the next longest chart, the 3 min, also showing a negative divergence at the same place earlier around the 21st and leading today. The next move would be for this to strengthen and move to the 5 min chart, that's what I'm essentially looking for as well as a number of other indications like leading indicators, the levers, etc.

 As I have often shown, the leveraged ETFs seem to give stronger signals earlier, this is BIB, the Ultra-long NASDAQ biotech ETF, note its 3 min chart looks a bit worse.

And the long term 4 hour BIS, leveraged Ultra Short NDX biotechs has a strong 4 hour positive divegrence.

When the 5 min chart fails, I think IBB short or BIS long will be very interesting, however as far as the divergences, they aren't too different than the broad market as you might expect as the broad market accounts for the greatest directional influence on just about any stock with Industry groups being the second most influential, the point being is the broad market updates are probably going to be showing just about the same thing as something like IBB.

AAPL Update

I'm covering AAPL, not because I really want to and see something I really like here, but because we have earnings tomorrow for their fiscal Q1 after the close and it's an influentially weighted stock on the NASDAQ 100 / QQQ.

 Looking at AAPL's chart with a 200-day moving average (blue) and a 50-day moving average (yellow), you'll probably notice the 200-day moving up and the 50-day as of right now, moving laterally, that should be a giveaway in itself if you didn't already pick it out on the chart, "Range".

Taking a closer look, you have a pretty clear resistance "area" around the psychological magnet (whole number) of $115 which just adds to the case for a head fake move.  If we went no further than this chart and didn't have any idea where the probabilities were as far as AAPL perhaps being accumulated for a much larger run higher or distributed and an expected move lower, the fact would still remain that Technical Traders are predictable in their actions when faced with certain situations like a clearly defined range and the more popular the stock, the higher the probability that some kind of head fake move will take place based on the range and using the predictability of Technical traders' reactions against them. I could dole out a scenario in which a head fake move could be used here in either an accumulation or distribution circumstance.

A lot of technical traders will only enter positions on price confirmation, say a breakout ABOVE the range at the coincidental psychological level of $115 (as a whole number that tends to attract our attention subconsciously). Professionals are well aware of Technical Analysis and how technical traders will rect long before the orders even show up in the book.

On a fundamentals basis, I don't have much to add as to AAPL, but I will say that the market is largely driven by perception, whether smart money looking at a great earnings report and poor guidance and selling off the asset because it looks like no matter what the company "did", the only thing that's important are the perceptions of what they will "do" moving forward.

From a dumb money point of view, earnings can blow be horrible and the perception that the instantaneous price reaction creates, defines the perception, the awful NFLX earnings recently are a great example of that. If you read the entire earnings report, at least I would not have expected NFLX to rally like that on that kind of a report, but as we have recently discussed, often the perception of the earnings report is created by the instantaneous price reaction, again see NFLX.


 Looking at the Trend Channel (weekly), I'd say a move below $104.65 on a 5-day closing basis, would be a significant changes of character in the trend. Otherwise, the Trend Channel has held the entire uptrend of 2014 without a single stop out.

From a multi-day 3C chart basis, we can see the 2012 distribution and top call we made back then that led to a -45% decline and we can see a double "W" bottom with a positive divegrence. The inline nature of 3C during the uptrend has been on the strong side, but recently it has moved to near exact reversion to the mean, still an overall positive looking trend, but clearly a change in character.


On a very long and strong 6 hour chart, we can also see that change in character from a relative negative divergence (weaker for vs leading, but still very strong on a chart this long) and a leading negative divegrence developing just after. This is a longer term look using multiple timeframe analysis, however if you look within the leading negative divegrence, you have a weaker, but still important relative positive divegrence at an area that also forms a "W" base and is in the range which draws a lot of attention and is ripe for a head fake move. Overall it would seem to me that there's a definitive change in these very long term charts toward the negative, however that head fake move above the range would be very enticing to me if I were pushing the buttons on short term price action. This "could" also set up a nice short trade that comes to you, of course we'd want to see evidence that there's distribution in to a move above the range, but that range sitting there is such a popular stock looks like a very high probability set up.


 On a 2 hour chart which is still exceptionally strong and important, the same change of character is seen as we saw above on the 6 hour chart and to a lesser extent, the slower to react, but very strong 2-day chart.

Note the relative 3C divergence in to the recent highs and a new lower low in 3C (leading). However we also have the same relative positive divegrence at the same area as the 6 hour chart above forming a "W" like base.

My suspicion would be for a head fake move above the $115 range, I would also suspect distribution in to higher prices and demand as technical traders buy on a confirmation breakout move.

 Looking at a 15 min chart which is far more detailed and still a very strong timeframes, it looks like there's a clear "W" base set up in that range, there's a slight negative as the $115 area is approached. Unless something has recently changed in AAPL expectations that were causing distribution of the base area that appears to have been put in place, I'd suspect this is to just back price off and not have a psychological trigger like $115 effectively trigger an early start or false start before earnings.


I see this same signal to an even stronger degree in the more detailed, shorter term 10 min chart, the white positive divergence would be the second base in the "W" bottom, again, unless something has changed since the 16th, I suspect this is to prevent a false start on a move > $115.

The 5 min chart shows the same thing as well.

Even the intraday 1 min chart shows a leading negative trend, but again, I suspect this is to prevent any false start above a psychological level.

The one thing that bothers me about these charts are the 10-15 min charts, those are pretty serious timeframes, not typically the kind of "steering" timeframe one would normally see to prevent a move just over $1 higher. I still suspect the highest probability is a break above $115. 

I also suspect based on the longer charts like the multi-hour (2 hour/6 hour) that there's a good chance the breakout is used as a head fake move, meaning sold in to. We can only get that kind of confirmation once we see such a move, but if that were the case, then depending on how strongly the charts moved, there could be a good case made for a trade that essentially comes to you. If those changes of character which are even evident on the Trend channel and price itself are telling us something, I'd lean a lot more toward distribution in to a move above $115 and potentially a trade (short) that could be entered in at a better price and as such, lower risk.

As an aside, we have seen some pretty unbelievable moves right in to earnings, GOOG gave a very strong signal only 15 minutes before earnings several years ago that ended up being key to the direction it took, call it a leak, call it price manipulation, but it was screaming.

I'd rather sit back with AAPL and let it tell us what it is doing and from there, make a determination as to whether there's a high probability set up that comes to you.


USO / Oil Update

You may have seen the piece in the A.M. update regarding OPEC's general secretary Abdalla El-Badri said oil prices could reach $200 a barrel if there's a lack of investment following this price slump. This sent oil up a bit early this morning, however I don't think this is what we have been watching develop.

Again, I DO NOT think this is a primary trend change in oil/USO, I think it would need a significantly larger base and have quite a bit of work to do to get there, but as a counter trend move/short squeeze, I suspect we are very close to that possibility.


 On a daily USO chart (very strong timeframe for a 3C chart), you can see the leading negative divegrence (which on a daily chart is a strong signal) and that is followed by a downtrend in oil. It's interesting how "Insiders" seem to be prepared for large moves like this months in advance. In any case, the point really is the current 3C action vs price shows there's just not enough evidence or any evidence to suggest that any move higher, no matter how strong it may be if a short squeeze is engaged as I would expect to happen, is a major tend change. You've seen how long a basing process can take and how much work goes in to them, this is no where near those kinds of examples we have seen over and over again.

However, I do think USO has a very strong probability of a move to the upside , engaging a short squeeze and that may be taken by some as something more than what it is, which in turn could set up the next position (back down), but I'm getting way ahead of myself, we'll have to see what the charts look like when/if we cross that bridge which I expect we will.

 As usual with changes in character, we often see changes in trend and the increased ROC to the downside which is evident in strong leading negative 3C action on the chart above this one (daily), leads in to the gap down and then the increased downside ROC in price which leads to a trend change, at least short term which would be lateral.

The increase in volume around the gap down and after also looks like a probable short term capitulation event or short term selling climax.

 On a 60 min chart we can see the lateral price action and what looks like a "W" base that is near maturity, which I actually prefer over an earlier "V" base and potential move off a "V" base which I don't think would offer the kind of support USO would need to get of a sound counter trend move, knocking shorts out in a squeeze.

I did mention last week that the flat range is likely going to attract a head fake move below local support as we see this about 80% of the time, roughly speaking, just before a reversal for a number of reasons. I do not see the recent penetration of support as a head fake move, volume didn't respond in such a manner to suggest stops were hit or that a significant bear trap was created on a break of local support so this is something to be on the look-out for, it obviously doesn't have to happen, it just tends to be a higher probability the more defined a support area/range becomes and it tends to happen right before a reversal (to the upside in this case).

We do have a pretty significant positive divergence out to 30 min charts...
The 30 min chart transitioning from in line with lower lows in price to a positive 3C divergence with a higher 3C leading low.


 However it has ben the more detailed 5 min charts showing the more interesting action, especially recently with a leading positive divegrence.

On a near term (timing) basis, the 5 min chart looks to have put in another positive divegrence, looking like it's getting ready to start a move higher. It's difficult to say how much larger the divergence "could" become, but I still suspect this move for now is going to be a counter trend short squeeze before we get in to anything potentially more serious and longer term in nature.


Also the 3 min intraday chart which has been in line on what looks like a "steering" divergence to create the "W" bottom is positive in the area. I still like this as a speculative long play, looking for a short squeeze, but again I'd warn that even with very strong short squeeze price action, not to be fooled in to thinking there's a significant enough base to support a primary trend change.


Quick Market Update

So far since Friday's The Week Ahead post, we really aren't far off track early a.m. / early week projections,

"As for early action next week, it looks like early weakness on Monday, although I think it will regain some strength in the later part of the day or some time afternoon-ish."

Of course this is just very short term intraday forecast/expectations,  going a bit further from the same post, 

"While I do not think we are done with our bounce we have been expecting and are really only a few days in to, I think we are seeing more aggressive than normal selling like we saw on the attempted 1/6 bounce that was prematurely but short on 1/8.

I suspect it probably won't take too much longer (in to next week) for the bounce to start to fail, leaving us some good opportunities to set up some nice short positions or add to.

I am still waiting on a few leading indicators to give clear signals , but this can happen very quickly."

And...

"Finally I think the IWM/Russell 2000 outperforms the other averages early in the week as it has not met minimum targets and has some better looking charts relative to the others."

So far we aren't too far off. I'll use the SPY as a broader look thus far although not too much will have changed this early on some of the longer charts, it still gives some feel for action.

 This is the intraday , late day weakness in 3C last Friday and that weakness picking up where it left off this morning, but based on the charts, I didn't expect it to hold too much past noon time. You can see an intraday, small positive divergence at the SPY lows this morning and pretty much in line since. We have been seeing negative divergences in to HIGHER PRICES, there's not much point in selling in to lower prices from a smart money point of view and as we had already known and as you'll see below, this bounce cycle was set up in advance, clearly suggesting (based on short and longer term charts) that it would be used to sell in to. Thus, with the SPY barely green or vacillating around the unchanged mark, there's not much to sell in to intraday.

 On a longer 3 min basis, you can see the failure of the bounce off the lows of the 6th, which started with some unexpected negative divergences on 1/8. The next small base area is a small "W" bottom on the 14th through the 16th and this is what we are currently tracking as I have suspected that these two bases are separate events with the second one forming because of the first one being cut short. SPY has not even made it to our minimum target on the upside posted over a week ago which would be the intraday highs around the 8th (minimum target projection).

The point being, you can see the small stage 1 base (white), in line (green) as the SPY has not crossed above the minimum target which is where I'd expect to see stronger negative divergences pick up and for the first time since this second small "W" base has formed, we are seeing a small negative divergence starting to unfold as we approach the minimum target area.

 This is a closer look at the same 3 min chart above and the first negative divergence starting to form since the "W" base's positive divergence.

On the slightly bigger picture (with a multiple timeframe analysis perspective), the 5 min chart shows the negatives off the first base/cycle from the 6th which went surprisingly negative prematurely on the 8th and our next base area from the 14-16th, yet look at the slightly longer term perspective with a much deeper negative divegrence on a 5 min chart, which also happens to be where I consider there to be a big difference between the 1-3 min charts and the stronger trend charts (starting at 5 min).

 The 10 min chart shows a bit more history with the negative divergence at the rounding top area from December, remember our forecast for a failed Santa Rally and a failure in the "January Effect".

The divergence on this chart is a much stronger one and is what I believe will be the next short term trend as soon as we go negative on the current cycle started from the 14-16th "W" base.

Of course I think we'll need to see the SPY at least take out the minimum target area before we see that happen.

Also remember last week the weakness we were seeing in some of the obvious ramping levers, HY Credit, there was some VIX futures strength, Treasuries and yields of course and don't forget about last week's very sharp and sudden elevation in the SKEW Index (or Black Swan Index). Other leading indicators have not given a clear negative signal yet which is not surprising given where we are at in this process (specifically the latest "W" base- 14th-16th).

As for the Q's
 On the 1 min intraday, they too saw early A.M. weakness and a similar intraday positive divergence like the SPY 1 min above and are in line as of this capture as they have not crossed in to the green on the day (above Friday's close).

The 3 min chart on the Q's like the SPY, which has been where the positive divergence for the small "W" base has largely been seen, is also starting to see the first negative divergence, but in this case the Q's have at least crossed above the minimum target that we were looking for over a week ago.

 IWM intraday is leading and showing a negative divergence in to higher prices above Friday's close, the relative outperformance in the IWM/ is what we expected to see from Friday's, The Week Ahead...

"Finally I think the IWM/Russell 2000 outperforms the other averages early in the week as it has not met minimum targets and has some better looking charts relative to the others."

So far this morning, that has been the case. Note the small intraday negative divegrence in to higher prices which is what we had expected to see on this small cycle.


Intraday breadth is not exciting, pretty much contained to a very mellow +/- 750.

Until I see enough objective evidence to suggest otherwise, I think we still are in the bounce cycle and will try to make higher prices, but I also expect they will be sold in to and likely, as posted Friday and as has been the expectation since before the bounce even started from the "W" base, roll over to offer some new opportunities and set-ups that come to us, rather than chasing anything.

I'll be posting some broader analysis as the a.m. trade burns of and we get a better feel for Leading Indicators.

I'll also be covering AAPL considering earnings tomorrow after the bell. That's coming...


The 3C Next Day Concept Hold Up

Beyond the USD/JPY intraday negative divergence, right up until the cash open we didn't have anything other than "in line" or 3C price trend confirmation , however the concept of 3C charts picking up where they left off during the cash market, worked once again. For newer members, this is the link to Friday's The Week Ahead post and the early A.M. expectations based on how the 3C charts closed Friday,

"As for early action next week, it looks like early weakness on Monday, although I think it will regain some strength in the later part of the day or some time afternoon-ish."

Almost amazingly to me even though I've seen it so many times, price action picked up right where it left off on the intraday negative divergences in place at the close Friday.

 SPY and its closing intraday (Friday) negative divergence...

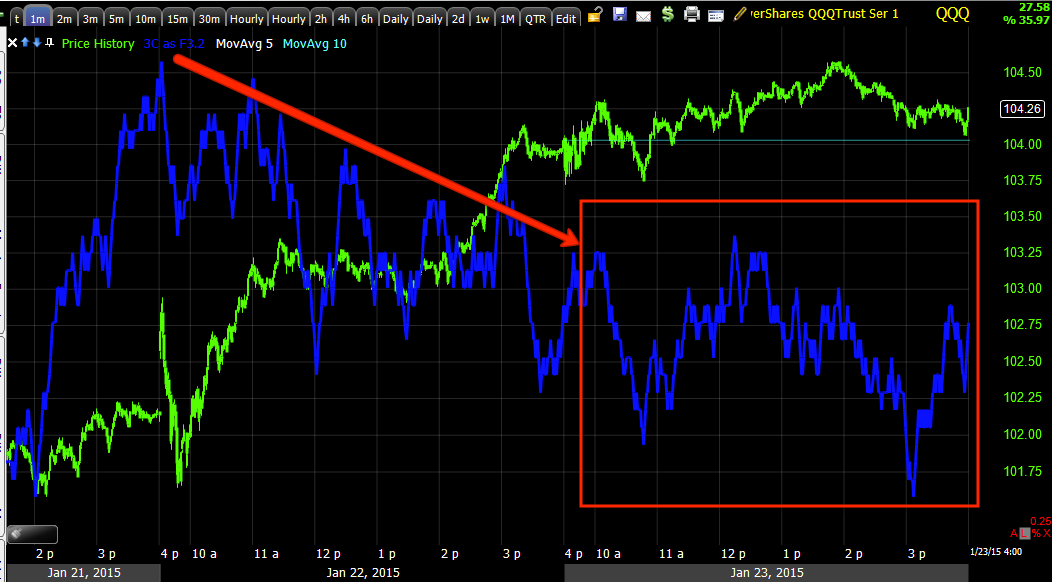
QQQ and its closing negative

And IWM and its closing intraday negative divegrence.

Amazingly they all picked up, literally right where they left off on Friday. For newer members, this is a "Cash market" concept, although we have seen it happen in futures activity, it is really seen most often in the cash market hours.

So once again, the concept pulls through and we start the A.M. session off with early weakness.

The rest of the The Week Ahead post from Friday afternoon can be found here. I did expect early weakness to give way later in the morning, however we are still watching for what I expect will be continued deterioration in to our bounce off the 1/15-1/16 lows.


A.M. Update

Good morning, 

I hope you had a great weekend.

Overnight futures sold off sharply, erasing all of the Draghi QE3 gains on an event that was probably just as widely anticipated if not more than the ECB's QE, the elections in Greece and the anti-austerity/anti-bailout party, Syriza, winning and going on to form a coalition government with another anti-bailout party setting the stage for a Greek exit from the Euro-zone.


How the market didn't discount this I have no idea, but the sharp drop in futures overnight was evidence of the concern about a clash between Syriza and the Troika and Germany which will likely not end well for European banks.

Since then, Index Futures have recovered just about all of the overnight losses with an in line 1 min intraday chart thus far, I've been trying to wait as long as possible to see if it turns negative as the intraday charts closed negative Friday, suggesting a negative or weak a.m. session this morning, followed by some later strength.
ES 1 min and all of the other intraday 1 min Index future charts are in line this far as they have regained the overnight losses. They appear to be staying in line for the moment, but as you have often seen, 3C charts pick up where they left off so I'm still anticipating some early weakness in the market during the early a.m. session even though we don't have the Index future divergences yet.

We do however have a negative divergence brewing in USD/JPY which as you know shares a tight correlation with the Index futures more often than not and has seemingly been futures' savior this morning, but we know how the market often pops a knee jerk surprise at the cash open, this may be it....
USD/JPY intraday negative divergence starting around 5 a.m.

Oil saw a jump when  OPEC's general secretary Abdalla El-Badri said oil prices could reach $200 a barrel if there's a lack of investment following this price slump.

Our larger picture is still calling for a decent bounce in oil that likely sets off a short squeeze, but I don't see this as a trend reversal, there just doesn't look to be enough base to support anything like that at this point.

I'm also still expecting a pullback in GLD, one which I think is tradable, but what has become more interesting recently is the possibility that gold is starting to look like a longer term long as we have been watching a base develop there for sometime that seemed to go quiet for a bit. Thus a pullback in Gold will be looked at very carefully.

As for the ongoing bounce, nothing has changed since Friday's The Week Ahead post which can be summed up as,

"I suspect it probably won't take too much longer (in to next week) for the bounce to start to fail, leaving us some good opportunities to set up some nice short positions or add to.

I am still waiting on a few leading indicators to give clear signals , but this can happen very quickly.

As for early action next week, it looks like early weakness on Monday, although I think it will regain some strength in the later part of the day or some time afternoon-ish.

The important base-charts are seeing damage so I think we are getting very close, I'd still be patient.

The next trend in multiple timeframe analysis continues to deteriorate so it's already set up for a much nastier move to the downside.

Finally I think the IWM/Russell 2000 outperforms the other averages early in the week as it has not met minimum targets and has some better looking charts relative to the others."

I'll be checking on intraday charts in the futures right up to the open, if anything changes and suggests the weaker a.m. tone that I expected from late Friday, other than some evidence we are seeing of weakening in USD/JPY, I'll post it.

As far as the market bounce goes, nothing has changed since Friday's post excerpts from above.

I'll see you shortly.


Friday, January 23, 2015

Broad Market Update

I'd say judging by the overall tone of the market today, last night's Daily Wrap Dominant Price/Volume relationship and the Sector indications, were right on...

"The Dominant Price/Volume Relationship was Close Up/Volume Up which is the most bullish of the 4 relationships, but ironically it also tends to lead to a 1-day overbought condition most often seeing the following day down....

Eight of nine S&P sectors closed green led by Financials at +2.47% with the safe haven Utilities lagging at -.43%.

We also had 227 of 238 Morningstar groups close green, overall not bad at all, but both imply the same thing as the Dominant P/V Relationship, a 1-day overbought condition."


As for the example charts mentioned in the Week Ahead post, here they are (the SPY is a good overall example).


 Since 3C charts most often pick up where they left off in the cash market (even over 3-day weekends), I'd say the intraday 1 min negative should see Monday open weak. However, right behind that is the 2 min chart...

This isn't weak and this is why I said I think by noon-time some strength will filter in to the market, but this is really small potatoes.

The same thing is apparent with the QQQ 1 min, negative

And while the 2 min is a little negative, it should lead to mid-day or late day strength.

The IWM is the same (2 min).

And while the 3 min is a bit negative, not enough to keep it from pulling it back together, especially given the IWM hasn't hit the minimum targets and for that reason (I believe) has better looking charts relative to the other averages.

Here's where we get in to the more important trend changes. The 3-5 min charts have been where the based formed and about as far out as the divergence (positive ) went... 
 You can already see damage on the SPY 5 min and just compare it to the last top areas and divergences in the SPY (5 min).

While we are not there yet, we are not far at all.

The same is apparent in the QQQ 5 min, deterioration on the most important chart for this bounce.

The IWM went a bit further out to 10 min, as I said it has better looking relative charts, there's some damage, but it still has a bit more to go to at least hit the minimum targets posted last week.

At the 10 min chart where the next trend is lining up (down), you can see clear and heavier damage, certainly in line with the divergences that sent the SPY lower from each of the previous pivot highs.

The QQQ 10 min needs no commentary.

And the IWM 15 min is again stronger relative to the other averages, the minimum target is the yellow trendline, After that I think we see heavier selling in the IWM and more deterioration along the lines of SPY and QQQ.

 SPY 15 min is already or still leading negative, this is the intermediate or sub-intermediate trend vs the current short term trend, we should return to this trend and lower highs/lows.

The equivalent for the IWM is the 30 min chart. Remember the range in the IWM and Crazy Ivan shakeout we were looking for above the range and the fact we expected it to be a head fake/failed breakout, there it is in the yellow box, since then ther has been even more damage done here.

Finally the HYG positive went out to the 5 min chart, you saw the HYG charts today so no need to post them again, but I did want to show how much damage has been done and how quickly. I suspect early next week HYG will be leading to the downside in actual price and at that point, the market shouldn't be far behind.

I may post some additional information after taking a quick look around, but I think this is a pretty fair summary of expectations in to next week, we've had a pretty good bead on this market so far with the bounce and what is now showing up as more aggressive than usual selling.

Have a GREAT weekend!

The Week Ahead

While I do not think we are done with our bounce we have been expecting and are really only a few days in to, I think we are seeing more aggressive than normal selling like we saw on the attempted 1/6 bounce that was prematurely but short on 1/8.

I suspect it probably won't take too much longer (in to next week) for the bounce to start to fail, leaving us some good opportunities to set up some nice short positions or add to.

I am still waiting on a few leading indicators to give clear signals , but this can happen very quickly.

As for early action next week, it looks like early weakness on Monday, although I think it will regain some strength in the later part of the day or some time afternoon-ish.

The important base-charts are seeing damage so I think we are getting very close, I'd still be patient.

The next trend in multiple timeframe analysis continues to deteriorate so it's already set up for a much nastier move to the downside.

Finally I think the IWM/Russell 2000 outperforms the other averages early in the week as it has not met minimum targets and has some better looking charts relative to the others.

I'll post some example charts just after this.

In addition, don't forget the damage already seen earlier today on Index Futures which is just additional confirmation.