Tuesday, February 10, 2015

Leading Indicators Update...

Unlike yesterday where watching the market was literally painful as it was "trying" to put in a positive divergence for a bounce, but was just shut down at every turn, yet Leading Indicators refused to give in, apparently at least until that bounce got some wind under its wings, today is much more exciting and enlightening.

Yesterday, last night, the Monday and Friday I said that I won't be hypocritical and say that a head fake move isn't a probability after preaching how common they are and in what environment we most often see them which would include this environment for at least the SPX, see last night's Daily Wrap for a more comprehensive explanation of the concept in current circumstances, but visually it's easy to show with a simple chart.

After our upside target of the descending triangle's upside breakout was hit, we have to redraw the trendlines giving us a range above in the daily SPY/SPX that is a very enticing trap, there's a more extensive discussion in last night's Daily Wrap of the concept in this particular circumstance.

As you can see, the market is moving toward that area as if it is trying to get a head fake move off, there are mitigating factors which again are covered in the Daily Wrap from last night, but the drop in volume and the internals are certainly not broadly supportive of a true breakout, but a head fake move which I often estimate at 80% probability no matter the timeframe, no matter the asset as long as there's an obvious range, technical level, moving average, etc. that will cause traders to take action.

This morning's EU / Greek rumor gave the market a head start via USD/JPY which is yet to come down, but as we have seen all day, there's little to no confirmation in today's move which is exactly what defined a true head fake move or "false move".

For instance, just looking at Index futures...

 As mentioned earlier today, it looks like someone front ran the trial balloon of the Greek 6 month extension rumor that was not sourced and even denied by some official sources, but it got the market giddy thinking there may be an end to the Greek /Troika stand-off. The retraction from Germany sent the Futures lower, but they seemed to have capitalized on their breakout which they couldn't pull off yesterday,  however nearly every where I've looked today from Index futures to averages to individual stocks, there's no support for the move which looks to be desperately trying to hit some target before it is rejected lower, I'm guessing that's the SPX range, but it could be just a move higher and the sentiment shift that comes with it.

 Here's NQ Futures, the most important part of the chart is to the right, the lack of any intraday confirmation of the move, it doesn't have long with no confirmation and it's getting parabolically desperate.

The IWm or TF futures looked the worst well before today and still do.

As for Leading Indicators, they are not yet "screaming", but they are improving i the direction expected which is toward negative dislocations.

 The red custom indicator is our SPX:RUT Ratio and it was not confirming yesterday, but today is far worse.

I showed the Pro Sentiment leading indicator during the cash market yesterday which was leading positive, by the close which was in last night's Daily Wrap, it deteriorated in to the close which is not so visible now, but you can see the chart in last night's post.

This looked like a clear effort to get something going yesterday at the SPX afternoon lows and then fading in to the close, it's certainly fading in to today's price action which is finally some movement in Leading Indicators that I have been waiting on.


 In addition, HYG is lagging the SPX today, this is more Leading Indicator confirmation or at least a good start to it that we have not had the last several days, now in place.

HYG's 3C trend is and always has been one of the most telling indications we have, whether to call bottoms like the October lows almost a week in advance while everyone was as bearish (in some cases new record levels of bearishness in some measures) as you could get or whether to warn of impending HYG/SPX divergences calling tops.

The intraday noise is here and there, but the trend is clear, remember the base for this cycle started 1/29-2/2...
The base for this chop/bounce cycle is to the left in white on the time axis, the 10 min chart is a clear, clean trend with little noise telling us what HYG's most probable intentions are, LOWER.

 Here TLT outperforms the SPX intraday, normally it "should" be making lower lows as the SPX makes new intraday highs, but it refuses to which effects yields, one of my favorite leading indicators as they act like a magnet for equities. The last several days, yields have been leading the market, supporting an upside move toward them, today that changed.

This is what I meant about yields leading to the upside (in red vs SPX in green) and the SPX followed, which is why I like them so much for their dependability, but here's the change today...

 The SPX (green) reverted to the 30 year yield's upside on the Greek rumors and early strength, but then because of TLT's relative strength, yields fell and are now for the first time in several days leading the market to the downside, not just the 30 year either.

 The 5 year is doing the same, now the pressure on the market is to the downside, taken with no 3C support intraday, it starts to become very dangerous, especially if a head fake move is achieved.

And one of the most stubborn indications, PIMCO's HY Fund which has been leading to the upside for the last nearly 2 weeks shows its first major break with the SPX, not only not leading and not in line, but leading to the downside. It's about time we get some movement.

More on the way.


NFLX Trade Set-Up/Follow Up...

This post from Jan. 28th shows the trade set up we put in place for NFLX to come to us on our terms, the trade set up and related posts are linked in this post, NFLX Follow Up.

From where we first started looking at NFLX for a trade set up, it has hardly moved, we are about +2.5% higher today than we were at the first mention of the idea and that idea was a set up, looking for some future events to occur including letting the trade come to us a bit more, but was also more or less the area that I expected we'd likely be looking at a NFLX short new or add to position, probably the most important part of being patient and waiting for the set up on the gap up on NFLX's cruddy earnings, was timing for the trade.


 The gap up was on earnings that were defined by price action long before anyone would have time to read the full earnings report and see the grey lining of the report. The gap up looked to me at the time and still does as if it were planned in advance because of the gap down and inventory held by professionals at that level that needed to be relieved (the gap in yellow), but as I had discussed in the linked NFLX posts and even before the earnings came out, often it's price action that determines the perception of an event and that is why I think NFLX was set up in advance and was going to gap up no matter how good or bad the earnings, perception rules the market at least with knee jerk reactions.


 This 2 hour chart shows the positive divegrence set up in advance of earnings. One of the things I wanted to see was for this 2 hour chart which was in line at the time, to go negative and it is starting to lead negative which can take some time for such a long term timeframe, but it is doing what I hoped to see.

 The 30 min chart also shows the advance accumulation/ set up and the distribution of NFLX which has been choppy, but range bound.

From the short term charts like intraday, today's action looks like NFLXX could roll over intraday from today's gains shortly, similar to the rest of the market and no support for any upside moves.

Here's the 3 min chart in the gap up range and it is deteriorating on a larger relative basis as well as intraday today.

As is the 5 min chart and through the range. We often see the strongest 3C activity in the seemingly most unlikely places like flat ranges with little movement otherwise.

This 10 min chart of NFLS is broadly negative, I'd like to see it hit a new leading negative low, but honestly at this point, I think NFLX is probably just about as good a position (short) as you'll likely get, it's the timing issue and that means the broad market updates, the Leading Indicator updates and the market ramping lever updates.

As soon as the broad market looks like it's done and it looks very close to that point now, I don't see anything that would hold me back from taking a good long look at NFLX as a short. Make sure you see the past posts that are linked in the post above, especially about their earnings.

Market Update

This morning's rumors of Greece being extended a 6 month extension, although unofficially and with some Finance Ministers denying the rumors is what gave rise to this morning's risk on pop early on, the one the Russell 200 promptly retraced and then some.

It may or may not be news by now depending on how much of this junk you follow, but it is official, Germany's Finance Minister, Wolfgang Schauble has shot down the "trial Ballon" ahead of tomorrow's emergency meeting of EU Finance Ministers, back to the Russian / Chinese narrative which may not be so far fetched, although it may not agree with Greek voters who want a resolution, but also want to remain in the EU. Apparently testing the political and market reaction before any meeting with trial balloons like this is now standard operating procedure for the EU, good to know they make their decisions based on the finicky market's opinion (at least in part), which means the ramp in pre-market on the initial rumor "should" be discounted and retraced, but it's not quite, although there are clear signs that it's no longer supported either as it was which brings us right back to yesterday's expectations of a market move higher to move VXX/TLT lower to allow them to be accumulated and HYG to be distributed.

So far here's how the Greek drama has played out in Futures...

ES with a suspicious looking dip and accumulation BEFORE the rumor was floated, the ramp in futures is obviously when the Greek extension rumor was floated, then the German Fin-Min clearly and unambiguously shot it down, however it seems the market used this head start to continue what we were expecting yesterday, VXX and TLT have to be lower to be accumulated which means the market needs to move higher as they move inversely to one and another (except on some occasions, bonds will do their own thing).

However, note the lack of 3C support since the retracement on the German Fin-Min clarity and bounce again.

As I have posted several times in the last several trading days, ES still has the best looking chart relative to the other Index futures.
 NQ also has no support on this move and has generally been the second best looking of the Index futures while the R2K futures...

clearly look the worst and have no support on the afternoon bounce after the German Fin-Min shot down the trial balloon.

Yesterday there were some positive divergences in the market averages, the weakest was a late day IWM position a 1 min chart, that's about as strong as it was and if you saw the Russell 2000 update earlier today, you can see that one has already been shot down.

Unfortunately, as has been the case recently, I can't get a complete market update (short term) in to one post because things change so quickly, part of the volatility associated with transitions between stages even though a choppy zone through 2015 may not look like volatility, the size of the swings in that range are actually quite volatile.

As for the averages, they look like what they were setting up for yesterday, again as I said yesterday, although most people have a hard time viewing the market in this manner, I believe as I did yesterday before any upside move, that the upside move is the means to an end and that is accumulation of the Flight to protection and the flight to safety as both were too high for Wall St. to chase them and they come at just about the right time considering the Russell 200 charts posted earlier today.

 SPY 1 min which did put in some intraday positives yesterday shown in the Daily Wrap and market updates is losing the intraday support of 3C now like Index futures.

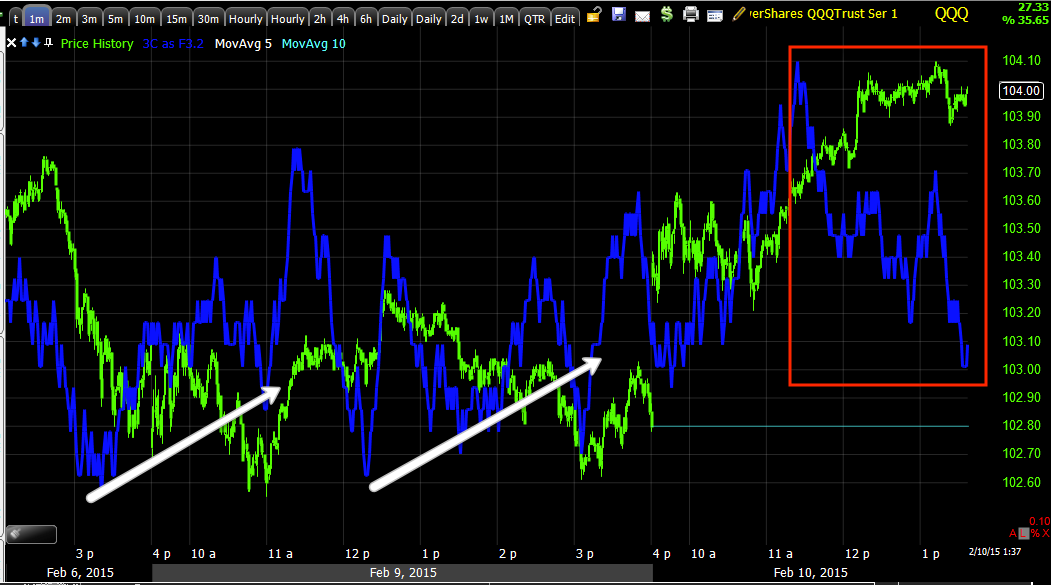
QQQ also put in a weak intraday positive yesterday, it too is losing 3C intraday support -1m.

As you can see, it never had more meaningful 2 min intraday support today, this shows the fragility of this move, which has largely been carry sponsored (USD/JPY).

 This is a longer view of the QQQ 2 min with additional leading negative lows being added today at a similar relative price level (highs), not good news for the average.


 The IWM shows the small late positive of yesterday has already been run over and is in line on the downside with the slight bounce having no intraday support as well.

 IWM 2 min is confirming the same confirmation on the downside and lack of support today.

And I probably already included this yesterday, but the rapid downturn in the 15 min chart is a serious move.

The only average holding some intraday support is the Dow...

DIA 1 min in line or a little better, but...

There's nothing different on the 5 min chart vs any of the other charts in the same timeframe.

As for the leading indicators, I'll get to those next. TLT is moving in the right direction, although the move lower sends yields higher which usually supports the market, however temporary. HYG is also moving in the right direction, a bit more slowly today than yesterday, but VXX hasn't made much progress yet.


Quick Update

I wanted to get this out as I am working on a more detailed Market Update, but it won't be done quickly enough.

Since the Greek 6 month extension trial balloon has been shot down by German Finance Minister Schauble, the market has continued to bounce after the initial pullback, but there's almost no support here intraday and I'm expecting a move to the downside any moment.

A more substantial market update is almost done.

UNG Update

Our last update for UNG/Nat. Gas was Feb. 4th, UNG Update,  in which I suspected we had just seen a head fake move as the charts since the move below support, looked fairly good...

 This is what I suspect was a head fake/stop run (yellow), note the increase in volume as the support trendline is taken out. Today's move, while a bit parabolic intraday and Thursday being the EIA Nat. Gas inventories, otherwise seems to have good support, not only intraday, but for this entire section of a suspected head fake move allowing accumulation of UNG on the cheap.

This 60 min chart makes the point of this entire section looking like a stop run in order to accumulate UNG on the cheap. A break above the trendline which is now resistance should create stronger upside momentum, but it needs to be a clean break above on a closing basis.

 The intermediate charts like 10 min also show an increased ROC in 3C's positive divergence since the stop-run (red arrow).


And the 5 min chart shows the same with sharper detail so I'd have a hard time believing today's move is a false move , it looks pretty solid to me overall.

On an intraday basis, as I said, it may not be aparent on this chart, but today's move looks a little parabolic, I'm not too concerned with it though at this point. We have near perfect intraday (2m) confirmation.

Don't forget, there is the EIA report Thursday, but I';ll set some price alerts and we'll check in on UNG again , if it can break out above resistance, it should create some nice upside momentum in addition to today's move of nearly +5%.

IWM/TF Charts

Several times over the last several trading days including yesterday, I noted the SPX futures had the best looking charts on a relative basis, then NQ and TF the worst looking.

Technically speaking from a bear trap perspective, although I prefer to have all of our ducks lined up which means clear leading divergence signals and the rest of the averages showing an imminent pivot , IWM/Russell 2000 looks very close to completing a bull trap which creates an immense amount of downside momentum with the general rule of thumb being, "Failed moves produce fast reversals" and a bull trap is a failed move. While a lot of things "could" happen like this morning's fundamental surprise of the Greek/EU news, I have to say from a charts' perspective, IWM/Russell 2000/TF looks about as bad as I could ask for considering I'm a fan of SRTY, 3x short IWM up here.

IWM has had a different look to it than the other averages, but the concept is the same.

 You may recall the long range in IWM and our call for an upside /head fake breakout that wouldn't hold (to the left) and with the 2/2 base forming a hammer at support with the other averages basing at the same time, another small chop cycle was expected. The first yellow arrow is the breakout of the range which sets up the bull trap as bulls buy on a technical break above resistance, then in orange we have a great looking set of reversal candlesticks and this morning thus far we have a move back inside the range which should hit stops of new longs and create downside momentum if enough stops are hit. Once we are below the range, we are in the deep fear stage.

I'd say if we have similar signals in the other averages, Leading indicators cooperate and the levers like HYG continue to fail, this should be a nice area for a longer term trend position short.

From shortest to long time frames...
 IWM 1 min

IWM 3 min leading negative especially since that strong damage done Friday.

The same is true of the 10 min chart.

The 15 min chart's leading negative divergence looks horrendous.

And the longer term trend...
 30 min trend since the October bottom.

As for the Index futures /TF charts...

This morning's 1 min

The 7 min chart's I posted last night rolling over.

The larger 10 min trend clearly negative

And the 30 min

As well as the 60 min.

I really couldn't ask for better looking charts, we'll se what leading indicators and the other levers look like, but so far, so good.

USO Update

Interestingly, in front of this afternoon's API oil inventories (not to be confused with EIA's Wednesday 10:10 a.m. inventories), oil /USO have dipped despite bullish comments from the EIA overnight including a forecast that the build in inventories should end by mid-2015 and supplies should tighten substantially.

Nonetheless, USO looks like this as of right now.

USO breaking below an ascending triangle, bullish technical price pattern on a daily chart.

What is of notable interest is yesterday's USO Update with these excerpts as the Mass Psychology aspect of technical analysis is so predictable, we were able to forecast this move yesterday and Wall St. certainly knows it better than anyone...

"

 Intraday today (1 min ) USO, there's a negative leading divergence in place, a gap fill would be an obvious target based on this chart alone, but we have more.

Note the shape the consolidation is taking on, a bullish ascending triangle, which would be the right consolidation pattern for continued upside, however if technical traders are picking up on this too, look for a head fake move below the triangle, this would be a high probability / low risk entry in USO long for the next leg, but as with any pullback we'd want to confirm the accumulation of a head fake move.

If we saw a head fake move and I'm suspecting it more and more as this ascending triangle becomes more evident, than it should look something like this and the highest probability / lowest risk long entry would be in the head fake move's area.

The white arrow is the expected path from a technical analysis point of view, a breakout to the upside as the apex of the triangle closes, the yellow arrows would be the higher probability head fake, below the triangle where any stops would be placed and turn traders bearish on USO, followed by the accumulation of lower prices and an upside breakout, it's the move below the triangle we'd want to verify as being a head fake move and that would be the highest probability/lowest risk entry, all based on the predictability of Technical traders and how Wall Street uses that against them."

And thus far ahead of the inventories this afternoon, less than 24 hours after the post above, that is exactly what happened.

In a previous USO Update, this is the area I suspected USO would consolidate around...
This is our daily X-Over Screen and the area I thought a consolidation would take place would be around the 10-day yellow and 22-day blue moving averages, you can see we are a lot closer.

Right now there's no accumulation of the lower prices, but that's not too surprising this early, first they have to pullback to whatever the downside target area is.

However if we can confirm accumulation of lower prices in this area, this would be exactly the head fake move, high probability/low risk trade entery that was posted in yesterday's  USO Update.

Keep an eye peeled for updates if you are interested in USO / Crude long, there's still plenty of gas in the tank.


Opening Indications

While USD/JPY hasn't lost any ground, the one Index Futures with the largest negative divergence post Greek news on the pop up pre-market was TF/Russell 2000 futures and they easily dragged the Index futures right back down.

 ES 1 min with some deterioration

NQ with some deterioration, but nothing compared to TF's divergence that was in place at the moment of the jump...

TF, note the divergence that was in effect almost immediately.


The IWM late day positive divegrence yesterday was shot down on the open.

SPY 1 min is in line.

If you look at the ES chart this morning before the Greek news came out, it almost looks as if there may have been a leak that was front run.

Still, VXX, HYG and TLT should tell the story more thoroughly although they'll need some more time to settle in.

A.M. Update

After a quiet overnight session with more bad Chinese data , this time in the form of CPI inflation data at .8 Y.O.Y. which is essentially deflation, this morning's ramp is brought to you by none other than Greece.

Specifically it was the pivot to Russia for funding or rather the threat, but the one I didn't see coming was the additional threat of funding from China. It is said the EU is working frantically on a bridge loan to ward off this possibility, although likely a trial balloon , it was enough to get some risk in the market, although this hasn't been confirmed officially and some have even denied it, Greece knows how to p;lay chicken.

Now what will be interesting is to see what VXX does with the downtick it looked to be trying to create yesterday, accumulation? I suspect we will see accumulation in VXX and likely TLT.

Here's the ramp up on the news, although not as enthusiastic as you might expect...
ES 1 min

There are already some negative signs in NQ and TF and USD/JPY which lifted Index futures has a negative divergence in it, although because of the sudden fundamental nature of the news, it's not surprising.

USD/JPY ramp this morning on Greece with a negative divegrence.

Like yesterday, TLT, HYG and VXX will tell us how close we are to making a turn lower, at least today should be much more exciting than yesterday.