Wednesday, February 25, 2015

XLF/Financials/FAZ

The thing about a top is many times you don't know it's in until after the fact. We live at the right edge of the chart, that's the one that doesn't tell you what happens next in the plot so if we were to take for instance the 2007 top at the right side of the chart, how many of you would have been able to identify this as a top?

 Judging by price action alone all you would have known at the 2007 top is the SPX just made a new high, this is why we need help from indicators (ideally the kind that shows us what the market missed), breadth indications, etc.

There's a lot of psychology involved in investing/trading, which is why I consider it one of the most spiritual exercises you can engage in, "Know thyself" or die in the market. For instance, did you know that most retail investors will lose everything they made in a bull market? There have been numerous studies, I've read several. I think one reason is they truly believe, "This time is different". It's easy to fall in love with stocks or a market when you've made money, it's hard to accept that it's over and bear markets move approximately 3.3 times faster than a bull market which doesn't leave you much time to make a decision. Also once losses start acruing, there's a cognitive bias that retail investors use which sounds something like, "well as soon as the market gets close to where my break-even point is, I'll get out", this is the basis psychologically of resistance and the truth is, the market almost never does what they hope. In fact most investors will finally give up and sell at the bottom of a bear market. Even professionals are not immune to this. You may recall me sharing with you the interview I saw on CNBC at the market top by the author of a book called "Dow 20,000", even then no one including (if we are to believe it), the F_E_D including Yellen saw that bear market coming.

From a Professional Fund's site, note the date...


July, 2007 — S&P 500: 1503

Market Outlook Memorandum

TBP Advisors, Ltd. Professional Staff

Our “Top Ten” Reasons the Bull Market Is Far From Over

Since the Fed finished raising interest rates a year ago, stock prices have risen by about 20%. In this Outlook we review ten reasons why we think this bull market can last at least two more years. These include: (1) market history of bull markets generally lasting about two years following mid-cycle economic slowdowns like we currently are experiencing; (2) the world economy remains healthy with contained inflation; (3) bull markets generally do not end until 6-12 months after the Fed resumes a tightening program; (4) stocks are fundamentally undervalued; (5) there is an estimated $1.5 trillion of private equity funds awaiting investment; (6) corporate share repurchases will continue to boost stock prices; (7) the active mergers & acquisitions market will help to raise stock valuations; (8) investor sentiment generally remains cautious, which is a positive factor; (9) the recent market advance has been quite broad, indicating much strength left in the market; and (10) weakening home prices could attract retail money back to stocks from real estate investing. Consequently, we think stock prices have the potential to advance by roughly 15% over the coming year.


 Sometimes we need some extra help, this is the daily chart of the exact same SPX 2007 top with one small difference, the 3C divergence at the very top.

Breadth was horrible as well, not as bad as it is now, but it was a screaming red light.

If we look at the SPX now, we see a very similar divergence, this is far from the largest, but a timely one on a daily chart.

Do you see the change in character? The Broadening top and the concept of common technical price patterns like a Broadening top being head faked just before they reverse ? The top formations are real, it's the head fake moves that are used to convince traders that they are not real, that they have been nullified, it's the ultimate bull trap whether on a 1 min chart or a weekly chart, the concept is exactly the same.

Here's a 30 min chart of XLF/Financials. You can see a positive divergence and the distribution of a common cycle in the red box, but take a broader look at the same chart...

 The October lows, a time and just before the October lows WHEN EVERYONE WAS CALLING A MARKET TOP IS THE ONE TIME I DISAGREED FOR THE SIMPLE REASON THAT TOO MANY PEOPLE WERE CALLING A TOP AND ALL ON THE SAME SIDE OF THE BOAT. Wall Street will almost always flip the script as the market is a zero-sum game, if everyone's on the same side of the trade, how can anyone make money with no one to lose it?

In any case, the broader picture is that XLF looks to have topped in December.

If we look at this as a common H&S top (and they never look like the textbook which is why we use volume confirmation), we see the 3 areas I'll short a H&S top and the one area I will now. This isn't something I just made up, I've held this as a major concept for over 2 years once I identified the pattern that plays out over and over and it's all based on the predictability of technical traders and TA dogma. Technical Analysis teaches to wait for confirmation, ideally according to Technical Analysis which identified H&S tops almost a century ago so they are well known, the break of the neckline at the red X is where you want to short a H&S top or if it bounces back toward the neckline, but does not cross above it.

I'll short a H&S at the head (1) if I can identify it that early, at the right shoulder (2) and NEVER at the break below the neckline, this is exactly what everyone else does and gives Wall Street every reason to shake those traders out as their positions and stops are as predictable as the sun rising in the morning. We identified the "Shakeout which takes prices back above the neckline after the initial break below it, which is where the shorts' stops are, either right above the neckline or right above the right shoulder. Additionally TA teaches that if a major price pattern like this fails on you, reverse your position so as they are stopped out of their short they are entering a long that they'll soon be stopped out of as well. 

The H&S is real, it's the shakeout that confuses things and often makes traders 2x losers on the same price pattern, actually 3x as they often miss the short so the last place I'll short a H&S top is after the shakeout has run its course above the neckline and after the initial break of the neckline as traders are starting to go long the asset again.

 In 2010 there was a large H&S-looking price pattern that a lot of traders were taken in by, but it was not a real H&S and shot up to new highs.

The reason they fell for it is they only looked at price as the art of volume analysis is long gone. A true H&S should show increasing volume on declines and declining volume on advances. This is a custom indicator that cumulates volume so it is easier to track, as you can see volume rises on declines and falls on advances like the right side of the chart now.

 We also formed an Igloo/Chimney price pattern here this week. You may recall my FAZ pullback set-up from last week, Leveraged ETFs / FAZ.

In other words, we were looking for a bounce in XLF (chimney) and pullback in FAZ, that's the trade set-up from last Thursday.

The intraday XLF charts aren't looking very good here.

However, some of you have asked if I still like FAZ after all this time and the answer is yes, this is a daily chart and it's not often you see a leveraged inverse ETF give a leading positive signal on a daily chart.

The 4 hour chart is just as interesting and inspiring, note the October market lows (highs for an inverse ETF) and what has happened with 3C since.

On a closer term 60 min chart, this is the area of the FAZ pullback I have been watching, note both divergences and the stronger second which usually means that both are part of one larger base.

FAZ 30 min on the latest cycle, not only has price flattened out and formed support, but the 3C indicator is calling this an area of accumulation.

 In last week's FAZ trade-set-up I said the 17th looks like the low, but look for a pullback and a positive divergence in to that, that's exactly what has happened since last Thursday.

Intraday, everything has gone sideways for the market, but FAZ's chart is leading positive, thus I think we've pretty much hit the area of the trade set-up we were looking for , otherwise I have no problem with FAZ long term as a trending trade.

FAZ Head's Up

Our Trade-Set-up for FAZ (3x short Financials), Leveraged ETFs / FAZ,  has triggered, I mentioned this yesterday as well. I'll be posting the charts as the market just turned sideways pretty quick since our last market update when most everything was green.

Transports (IYT)

IYT has been one of our longer term core positions, a position I'm quite willing to be patient with. It's also a former momo darling and as such, I can imagine there's quite a large unwind that would be necessary and I believe we have evidence of that. The current IYT position which I'd love to add to, but risk management rules won't allow for that as the position is already at max position size.

I think the charts speak the best to the subject...
 The daily chart of Transports with a clean stage 2 trend (Mark-up) through 2013 and most of 2014 sees a Channel Buster. You may recall several stocks we have traded on this set-up, typically a break to the upside followed by a downside break. This is the opposite, first a break to the downside and then a break above the upside of the channel, it's really the same concept as a head fake move, stops, momentum, etc. However while the Channel Buster is certainly a red flag warning, what is really standing out...

 Is the very clear change in character which inevitably leads to changes in trends. The uptrend is clean, but on falling volume until the Channel Buster business, after that, what do you see that has significantly changed in IYT's character other than volume? A choppy range and one that's quite a bit larger than your typical consolidation, any way consolidations aren't known for increasing volume, tops and churning are.

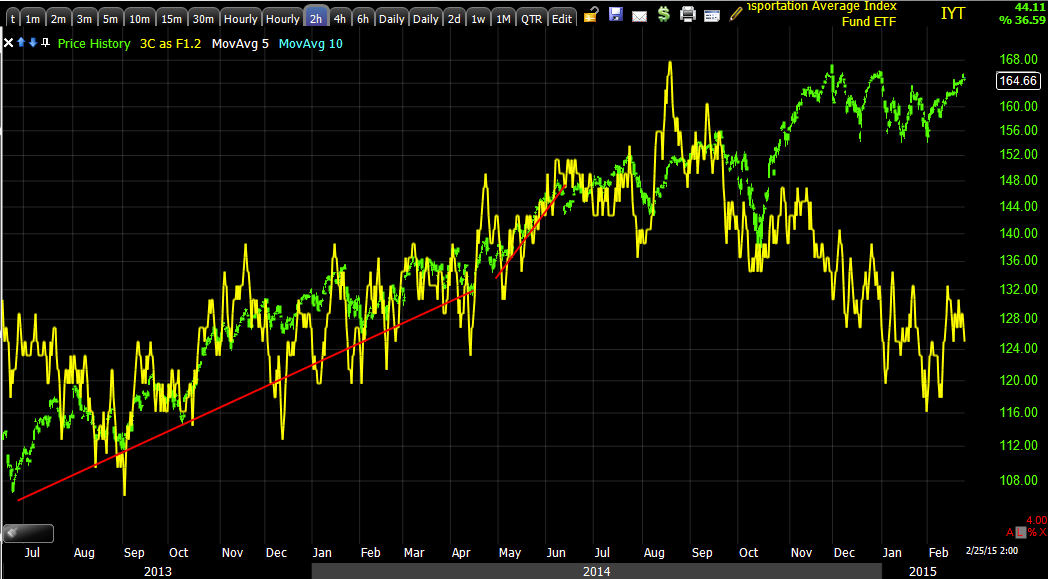
 This 2 hour 3C chart tells me all I need to know to confirm the 2 charts above. The chart goes from upside confirmation to, well I think you can see the divergence quite clearly as it is unrelenting and significant in size and timeframe.

 The 60 min chart which I can't quite properly scale as 3C should be lower along the uptrend with price, is also confirming the exact same and is where we first saw signs of trouble in transports.

As to smaller cycles, this is the most recent which is also clearly negative, 3C distribution in to higher prices, which are really just part of a large zone of chop.


The more recent timing charts like this 3 min are clearly deteriorating. In other words, as I said above, if I had room to add, I would, otherwise, I have no problem holding an asset like this short as a longer term trending trade.

Market Slipping/AAPL down on volume

After last night's list of 5 stocks that alone have been responsible for all of the NASDAQ's 2015 gains, AAPL being the chief among them and also one of our short positions, it is pretty clear that AAPL down on volume over the last few minutes is taking its toll on the averages... I'm sure you've heard of the Chinese action against US companies over spying, AAPL included. I'll just say that while this may be news to us, there's little that the market is not aware of an actively discounting well in advance of the news becoming public, yes it's illegal, but this is why we watch underlying trade. You've seen the examples of home builders being accumulated in 2000 during the bubble in tech as it imploded, who would have ever correctly guessed that after the tech revolution, one of the most boring asset classes, housing, would lead the next bull market? Well someone knew and they knew 2-years in advance.

 AAPL intraday confirmation on the downside move on volume.

Since, the QQQ intraday leading negative, obviously market makers see what's happening in AAPL and anyone else with half a brain and are moving out of the Q's.

The IWM just hasn't caught up to even intraday confirmation as the Chimney portion of its price pattern has been leading negative as well as longer charts.

And the SPY.

I'm looking at quite a bit now, I know some of you have questions and I'll get to them ASAP.

USO Follow Up...

Yesterday I posted USO Trade Set-Up which is an ongoing forecast not only since last week, but over a month now since we hot a low and popped higher as we had expected.

I don't mind saying that this is a bit of a head scratcher for me and I don't have all the answers, I wish I did, but looking at options for different trades and risk management should help clear things up and present some scenarios that may fit your goals or perhaps you'll find they are not in line with your goals.

Lets take a look...

Last night the API Inventories came out just after the close, there was a massive build of 8.9 mm barrels for the week. This morning's EIA Petroleum Inventories was posted last night as "perhaps" being the event that would give us a head fake run below support in the $18 area DURING CASH MARKET hours as last night's drop in crude futures didn't help our head fake situation with the stops we needed to hit on a head fake not trading normal cash market hours.

Sure enough, this morning's EIA Petroleum report came in at a build of 8.43mm barrels for the week above consensus of 8mm on the nose, yet crude is higher right now. Our stop run/head fake level was hit, although not hit as I expected, but my expectations really don't matter much beyond the fact that the expectation of a head fake move occurred as expected, how it happened are details that are just my opinion, not based on objective evidence.

I'm sure at one point or another you've heard me talk about what moves the market, it's not P/E's, it's not value, it's perception. While I'm taking a shot in the dark here, you know how companies report bad earnings, yet rally or great earnings but sell off, that's because what they did is of little consequence moving forward, it's the PERCEPTION of what they'll do next that matters. If earnings were bad, but it looks like things should improve, you have a positive perception and a stock rally o bad earnings. If earnings were great, so great that it looks like the company might not be able to top them next quarter, the perception is negative and the stock can sell off on spectacular earnings, this is generally based on the company's guidance which I think is the only part of an earnings report worth looking at.

Here are some factoids...

This is the 7th consecutive week of crude inventory builds which are now at a "Total Inventory" record high. Current inventories are 5 times higher than the normal 5 year average of inventories.

US oil production is at a new record high despite the falling rig count week after week.

Something doesn't make sense to me. Earlier it seemed simple, Saudi Arabia and OPEC were trying to crush the US Shale drillers as oil was /is being sold for less than most shale drillers can produce it. Previously the low prices in oil were said to have been to punish the Russians for getting involved in the Ukraine as Russian oil exports are big business for the country.

However, I suspect there's something else going on that we are not aware of. I could guess, maybe a showdown between the West and ISIS and we want to have plenty of supply on hand. Maybe something else.

Whatever the scenario, we know the perception is different than what we might expect. After 7 consecutive weeks of build at record levels, why has oil not moved lower and rather sits in our consolidation range after actually moving higher? Forward looking perception is obviously different than the current facts or what HAS occurred.

 As proposed in last night's Daily Wrap, the EIA report this morning may come in at a miss and give us our cash market head fake move below $18, the area I suggested you set price alerts at. While this doesn't look like the typical head fake, which tend to be stronger looking moves as different traders have different risk tolerances and they generally want to run them all out before a reversal, which means the head fake moves are extreme and believable, it is a head fake move in the form of a stop run and right at the psychological level of $18 as proposed (whole numbers attract the human mind and we subconsciously place stops and limits at whole numbers, which is probably why support was purposefully built around that level.

 On an intraday basis, you can see the 10:30 EIA report and USO drop below $18 on volume which are the stops being hit, that's what we were looking for.

From yesterday's USO Trade Set-Up, one of the two things we were looking for today...

"From here. if you are interested in the trade set-up, I'd set price alerts for a break and close below the psychological whole number of $18 (currently at $18.05). A break below $18 alone is not cause for an entry, it is our trade plan going according to expectations, after that we look for 1) Volume on the break below $18 where traders will naturally have placed stops and limit orders being the whole number is a psychological magnet."

As for the 3C charts intraday on the move...Well it's a positive divergence/accumulation of the hit stops.

The 5 min chart improved this morning as well on the stop run.

And the 1 chart I've been watching the most, the 10 min chart that signaled the probability of a lower move/head fake, is showing improvement here.

As for Crude Futures...
 The 5 min chart started going positive on the API inventory build after the close yesterday and continued to a greater extent on the EIA miss this morning, not what you'd normally expect, but exactly what we expected.

The chart closest to the 10 min USO which is kind of the line in the sand, also shows improvement. Yesterday's post had the longer term Crude Futures as well all the way out to 4 hours where there's a strong leading positive or what I'd call, "Gas in the tank" for continued upside.


Here the USO 30 min which has been in line since we called for a consolidation after the first leg up is now leading, a change.

And the 2 hour USO chart that has a wickedly nasty negative divergence BEFORE crude fell, has an interesting and strong leading positive divegrence.

My opinion has been this is a counter trend rally setting up, but we are now seeing signals that are approaching large enough to be a viable bottom in USO for a primary or Intermediate uprtrend, to be precise, we are not there yet in my view and would likely have to come down a bit to recent lows to build out the base, but that doesn't mean we can't have a counter trend rally and then a pullback and finish building a broader base that can move higher as a trend change.

So if I were considering Crude and I think I will put USO long in the tracking portfolio today, I'd decide on which trend I'm looking to trade and if it's the larger one, I might be a little more patient or phase in to a position, if it's a counter trend rally then I'd just have some stops below today's intraday low. One of the key signals will be the close and whether we have a bullish candlestick and increasing volume, if that's the case, then we are likely right in the front door of the continuation of the first leg of the move higher. 

For now, I'm putting a half size position in USO long in the tracking portfolio as a trade on the counter trend rally, if I had more time I'd wait until  just before the close and look for a bullish candle and increasing volume over yesterday, I suspect we get it.

If you are thinking of a longer term trend trade and a real bottom, I'd urge some patience, while bottoms are almost always tighter than tops, I still don't see this as large enough to support an intermediate or primary uptrend.


USO Head's Up

Our trade set-up conditions were met this morning, I'll be posting a more comprehensive overview, but although not exactly what I expected, the fundamentals of our trade set up came to pass exactly as we had expected.

Crude is up on a big (bearish) build.

AAPL Update


This week I noted that along with the Q's the SPY and later the IWM all made an Igloo with Chimney price pattern more often than not, one of the best topping indicators for a particular cycle, not necessarily a primary top which is much larger, but there's no reason it can't be the end of a primary top.

I also noted that AAPL has made a similar, well exact price pattern. I liked AAPL as a short/Put on Feb 12th, about 3.5% lower, but since over the last couple of days, AAPL looks like it could start coming down any time. Again, it's not my favorite in terms of core short positions or trend positions, but it does look like an interesting opportunity for a trade. I don't bring AAPL up today because it's down, in fact I brought AAPL up yesterday as it was near ATH's as this Igloo/Chimney price pattern formed. It should not go unsaid that when numerous averages and assets, especially huge market movers like AAPL (shown last night to be 1 of 5 stocks responsible for all of the NDX's 2015 gains) all start doing the same thing, there's a trend there and this looks like the topping of the Jan29-Feb 2nd base/stage 1 trend or cycle.

Here's where the charts stand with AAPL, again, this is far from my favorite as a longer term trend short position, but there are all kinds of opportunities.

 After breaking the 2015 range the same as the broad market, AAPL looks to have put in the same rounding Igloo top with the right side chimney, just like the rest of the market and that's to say nothing of AAPL's weighting pull on the market and NASDAQ specifically.

 At the chimney area this leading negative divergence was not leading as AAPL declined, it was leading as AAPL was still at its highs before the decline started today.

This 5 min chart, if you look closely was also leading negative BEFORE today's decline.

As was the trend of this 3 min chart, all in the area of the Chimney portion of the price pattern which has been the head fake area that has been distributed in to in the past so often that we named the price pattern and it became one of our concepts.

Obviously I am not crazy about AAPL long here and believe we will see downside in AAPL beyond today's, if that doesn't matter much to you as you may not be in AAPL, it should tell you something about the broader market considering AAPL's weight and ability to single-handedly move the averages.


Bullard

 I'm watching the Yellen Congressional testimony (as much as they have provided) and heard none other than market mover, the F_E_D's Bullard will be on CNBC for 2 hours tomorrow morning. As you know, when the market in the past has been either set up at a stage 1 bottom like the October lows or a stage 3 top like the September highs, Bullard has been the catalyst to moving the markets which is one of the pieces of evidence I had discussed in my article, The Plunge Protection and Market Correction Team. Note that my article is not only along the lines of the notorious President's Working Group on Financial Markets, created by Reagan by executive order and the Plunge Protection everyone has been so keen to accuse them of and probably rightly so, but add "Market Correction" as that's what the evidence seems to show.

You might say there's a time to reap and a time to sow, otherwise known as the business cycle or the transfer of wealth. I was discussing this with another member. In 2006, the F_E_D lifted rates from 1% in 2003 to 5.25% in June of 2006. One of the things that held up the 2002/2003-2007 bull market was Consumer Spending which was made possible by equity in people's homes taken out via HELOC's and 2nd mortgages, etc. In my own personal experience, I had bought a home in 2003 after seeing prices in our area jump by 30% in two weeks, knowing this was a bubble in housing, but it was a bubble that was likely still a ways off from popping so we rushed out to buy a house after looking every weekend for 8 months and after 5 contracts that we backed out of after inspection for various reasons like termites, we ended up with something far from what we wanted at $205,000, which was only on the market 1 day.

A year or so earlier, that same money would have bought a home on a deep water canal with a boat dock, which were now $500k just for a lot. By 2005 or so, our home was appraised at more than double our purchase price, over $450k. My point in my discussion with one of our members yesterday who was of the opinion that the F_E_D can't let the market fall was that this is part of the wealth transfer mechanism, i.e. "A time to reap, a time to sow".

I don't know how many people you may have known who had homes valued at more than double what they paid for them, but suddenly when the music stopped (for home builders that was around 2005, for home prices that depended on the area, but generally before the 2007 market top although different pockets around the country diverged. I know very few people today who are better off for having bought a home and for a while, having tons of cash in their pockets, most have lost them or can't nearly afford what they are paying for them now and at some point will likely lose them. WEALTH IS NOT DESTROYED, IT IS REDISTRIBUTED.

I'm not going to go any further with opinion on this matter, but I think it's a fairly well known fact that there's a growing disparity between those with and those without. It seems to me that since the more active central bank policies, these cycles are more predictable and more pronounced, take the 2000 tech bubble, the 2007/2008 sub-prime financial crisis... 

The point simply being, I don't doubt the invisible hand of the Central banks in the market, in fact in 2009 myself and David DT who many of you know were actively posting when the PPT would be active right down to 10 minute accuracy. What I doubt is the narrow view that wealth creation is a one way street in which markets can do nothing but go up. How is money transferred from the layman or in today's vernacular, the "Buy the dip" crowd, amateurs in investing that have never seen a rate hike (in fact it is estimated that 1/3rd of professionals have never seen a rate hike) I have seen quite a few, to , well the wealthy? 

Food for thought, I'll obviously be very interested in what Bullard has to say tomorrow as the timing giving market circumstances is quite interesting.


A.M. Update

Your almost at the half-way point Janet!

However today should be the much more difficult of the 2 days in front of Congress. Yesterday was a warm up with really only Elizabeth Warren pushing her on whether the F_E_D via its general council is letting big banks like CITI draft policy (specifically swaps pushout). If Yellen struggled to defend the F_E_D against the "Audit the F_E_D" push yesterday and came off as having something big to hide, her buttons are really going to be pushed today.

As for the other story, Greece continues to be a matter of pure downside risk.

Last week I mentioned part of the process is not only the Greek draft of additional reforms which was easy for them to write because the Troika wrote it for them in their name. Seriously, how stupid could you be to put your name on the draft document you are ghost writing for another government?

I reminded you that the Troika would have to accept the measures which I suspect there was a first draft that they did not accept given the rumors of the Greeks not having met the deadline and the Troika draft being written in the 11th hour, literally 2 hours before it was due. Next the various EU governments would have to ratify the bailout through their respective parliaments and Greece will have to show that it is doing something before a single Euro is paid out and thus far on the tax collection front, they aren't getting very far.

This morning Schaueble summed it up, They don't trust the new Greek government, but despite his misgiving's the German FinMin asked German lawmakers to pass the bailout for Greece on a vote I believe this Friday, but apparently they have their reservations too. Apparently at least 60 members of the Bundestag plan on voting against the bailout plan, that would mean Greece's largest creditor would not participate, and on and on it goes, the point... PURE DOWNSIDE RISK.

I'll be watching the Yellen appearance again today and keeping an eye on market responses, this is when I have found some of the best data and information in the past, but I'll also be covering the usual stuff as well.

Have a great day.


Tuesday, February 24, 2015

Daily Wrap

What can I say that really captures the essence of events that seem to be under control, that are very far from that seeming reality?

This morning many of you may have seen the Troika accepted Greece's weekend homework assignment which was to write up a list of additional and "substantial" measures the new government intends to take to not only abide by the bailout conditions accepted in 2012 by the hated Samaras government, but to expand them.

The indignities the Greeks have suffered (not saying they are not without fault, but if you make a huge loan to a borrower you know is not credit worthy and will default, I say that's on you Troika) from mass government sector lay-offs, 60% youth unemployment to Greek national treasures to be sold off as demanded by creditors right down to a Doctor's act of self-immolation because he could no longer make a living and was forced to eat out of dumpsters and could no longer stand the indignity.

Indeed, the Samara government came in to power after former PM,  Papandreou dared to suggest that Greece should have a referendum as to whether they should stay in the Euro, 48 hours later the ex-Goldmanite employee was running the show and doing the Troika's bidding (how do you think he came to power in the first place?).

Finally, the rise of Syriza who voted against all Troika bailout measures with credible promises that they'd remove themselves from the bailout and harsh austerity measures. The actions and tone of the new Syriza government that nearly won a majority of parliament in recent elections (only 3 seats shy) had put the EU on notice. The PM's first official act was to visit a shooting range in which Nazi troops had executed 200 Greeks during WWII. Tsipras's first meeting with a foreign dignitary was with the Russian ambassador. Syriza's leadership had promised to restore Greek pride, to undo the bailout and even "dismantle" the Troika. As Tsipras said only days before capitulating, all talks of the current bailout were off the table, they would not accept it, there would be no compromise on this and to do so would be driving the final nail in Greece's coffin.

Yet days later the leaders of Syriza had rolled over on every signle point and ended up with an even worse set of conditions than when they took power. Their only claim to victory was to change the terms of "Troika" to "lenders" or something of that nature and "Bailout" to "program" which is what caused the now infamous well respected Syriza veteran to pen an open apology to all Greeks for having anything to do with Syriza whom he said only accomplished changing the word "Fish" to "meat".

When I read the news that the initial draft from Greece contained numerous campaign pledges that Germany was sure to say Nien to, I thought ,"This is just getting started", then hearing that perhaps Greece didn't submit the list of measures by midnight Monday, then to hear they were not only submitted, but accepted with no changes by the Troika, I just couldn't believe it was that easy.

While I have no proof at all, I suspect the initial and official reports of the original Greek draft did contain some campaign pledges such as re-hiring government workers, protecting primary residences from foreclosure and I suspect that the reports Greece had missed the deadline for turning in the reforms was in fact the original draft being red lined by Germany. As we now know thanks to someone who simply looked at the data included in the leaked Greek draft, we know that it was an 11th hour submission written just 2 hours before the deadline and written by a Troika representative not the Greeks.

This is sure to set ablaze the already smoldering mutiny Syriza's current leaders have on their hands as one after another high ranking member writes or speaks openly of Syriza's betrayal of the Greek people and how "It's not too late" with actions they must carry out. The bottom line is the seemingly peaceful acceptance of the Greek reforms has now turned in to a potential firestorm showing that Germany is in fact the puppet master of Europe as all have suspected and we can only guess what this leads to as already very sour feelings toward each other only intensify with the fact that the Troika wrote the terms that the Greeks were suppose to propose.

I have one Google alert set and the keywords are "Greece" and "Troika", this will not end that easy. I suspect the uncovering of the real author of the additional reforms, showing the Greek people and everyone around the world that Syriza's current leadership is no better and in fact maybe much worse than the hated Samaras regime which was a Troika puppet.

Mark my words, mark this post, whatever comes from this, it is not going to be good, it is likely well beyond our immagination, but it is far from over.

As for Yellen today, there were dozens upon dozens of soundbites on every subject the market was interested in, but she managed to come off neutral and essentially, "Do no damage". The only fireworks were her very panicked defense of the F_E_D and complete opposition to any kind of audit, which strikes me as odd being the power they wield is constitutionally only suppose to be held by Congress, it was delegated to the F_E_D, yet they emphatically oppose any accounting of their actions. Yellen's way, demeanor, tone and maybe inexperience in front of the camera made her sound like she was desperately hiding something and it came off badly; she may have been the worst person to make a case to oppose the "Audit the F_E_D" movement.

Ironically just after fighting off "Auditing the F_E_D" in her answer and using political interference as her main reasoning, the closest thing to an ally she may have had in the form of Chuck Schummer, came out with a prepared statement not asking, but demanding that the F_E_D keep current accommodative monetary policy in place and she answered this with delicate respect, although this was the very political interference she had been railing about in her answer of the PREVIOUS question!

Still, she gave the market nearly nothing and thereby did her job. One of the better cat fights was between her and Senator Elizabeth Warren (D) who questioned her on why there had been no consequences/punishment over a leak of inside information that was traded on from the F_E_D to big banks in 2012 had been under investigation since by the F_E_D's general council, yet had produced no conclusions and no updates since 2012. Warren asked why after repeated attempts to get an update on the case from the investigating council, she received no reply and no status update. CLEARLY ILLEGAL and obviously being buried. When Yellen tried to side-step the question and danced and danced, Warren kept coming back to "It's a yes or no answer!" Finally as Yellen was tongue twisted from the repeated, "It's a yes of no answer" and her attempts at verbal gymnastics she started to say "Ye..." and Warren immediately jumped on it and said, "I'll take that as a yes". Yellen had shaken her head just after, but not as in disgust, as in she had just been hit with a right cross and was trying to shake the cobb-webs out.

A second dust up occurred when she was asked about the F_E_D's General council making statements to a lobbying firm that was working on repealing legislation from Dodd-Frank that was unfavorable to them and asked whether the General Councel's comments represented that of the governing council of the F_E_D and if not, why senior staff are making comments not consistent with the governing council, again she danced and danced, clearly not a question she wanted to answer and came off very badly as far as honesty and credibility. After seeing what I saw today, I think an audit of the F_E_D, like any other organization in the US including government, is well past due. One wonders what they are really so defensively trying to protect.

As to the market today, the NASDAQ closed up for a 10th day, but just barely as again, like yesterday it was red going in to the close as AAPL had seen poor relative performance, ironically it was AAPL right in to the close that lifted the NASDAQ out of the red for its green close.

In fact we have talked numerous times about the NASDAQ 100's weighting and the NASDAQ's proprietary formula that will cost you a $10k a year membership to get the information. I thought you might find this interesting...All gains in the NDX for 2015 are due to only 5 stocks...
This is why, as mentioned in the market breadth section of last night's Daily Wrap I mentioned that NASDAQ's Advance / Decline line was not doing well, nor was the R2K's or the R3k's and many other measures of market breadth had not advanced in 12 or more days, many declining. This is the magic of weighting an Index, when 5 stocks can gain and 95 can be at a loss and the index can still close green on the day.

However AAPL may not be as helpful in the near future...
 AAPL IN WHITE VS THE QQQ IN GREEN, THE W'S WERE JUST GOING RED IN TO THE CLOSE BEFORE A LITTLE BOUNCE IN AAPL HELPED THEM BACK ABOVE YESTERDAY'S CLOSE.

AAPL's daily chart not only has the Igloo/Chimney formation like all of the major averages now, but today's price action on volume was not a good sign. Tomorrow we'll cover the 3C charts/Update. However at the least, AAPL's relative performance today was poor.

Bond yields moved the most over the last 2-days in a month and a half...
 This 15 min chart of 30 year yields (red) vs the SPX (green) shows what a divergence between yields and the SPX can do and why we use them as a leading indicator, the current divergence (remember recent TLT analysis) is pointing to a move lower in the market along with other things such as the Igloo/Chimney price patterns popping up everywhere.

Here's a closer look at yields intraday vs the SPX.

And this is a daily chart showing from left to right yields leading the market lower, yields moving down with the market or pulling the market lower and again yields leading the market lower and to the far right the largest dislocations of 2015 with Yields screaming as a leading indicator, "Market lower!".

 This shows TLT inverted in blue vs the SPX in green and the normal movement of what would be TLT or in this case, 30 year yields would move almost exactly the same as the blue line and the "Red flag" that something is changing and the leading indicator divergence now.

In fact interestingly today as the 10 year yield just crossed under 2%, you can see HFT's or some other algo selling instantly as 10 year rates slip under 2% intraday.

 Again today our SPX:RUT Ratio custom indicator did not confirm price action. I include the green custom VIX Term Structure indicator as well just to show how far it is from a buy signal, even though we don't have a specific threshold for a sell signal.


This longer term 60 min chart of our custom VIX Term Structure shows when we have received buy signals in the past in white.

However once again as we don't have a specific threshold for a sell signal, you can see how far the indicator has moved away from the last buy signal earlier in the year inside the 2015 range.

 In addition to the AAPL late day save, it appears the VIX was slammed , note the SPX's Igloo/Chimney pattern as well.

Short term VIX futures seemed to accumulate the lower prices on the VIX knock-down.

The USO trade set-up should be pretty clear, USO Trade Set-Up however it looks like support was broken after hours on a bigger than expected API inventory build, however tomorrow's EIA status at 10:30 should give us additional information and perhaps a cash hours break below.

As for gold I think we are coming near a bottom, but not quite there yet.

 This is GLD (red) vs the SPX, I can't say correlation is causation, but there does appear to be at least some inverse correlation.

 The 5 min chart is improving. Thursday I updated GLD here, GLD Next Set-Up and posted a potential set-up.

I said I have charts that look even better, but I didn't want to put them out too soon as I didn't want to give the wrong impression that GLD was at a reversal as I see it as having a little more work to do, but not much.

Here's one of those charts.
 Here's the GLD 30 min chart since the pullback/correction we called for.

Very near term on the inrtraday 1 min chart it looks like GLD will do some more lateral base building which is exactly what I was looking for last week, I think we are getting very close.

There are some indications in SLV as well, my least favorite asset to analyze, but here are a few charts.

 SLV 10 min showing a pullback divergence and a positive building.

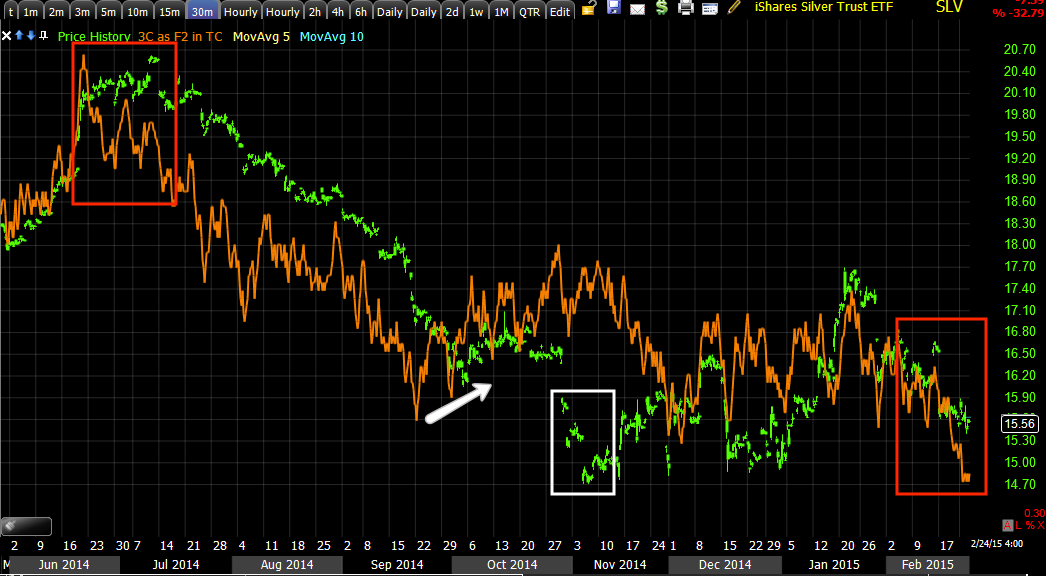
It's a bit more complicated here though as it looks like SLV is close to a bounce, but perhaps may see some more downside after as the 30 min chart remains leading negative.

We'll keep a close eye on both of these for opportunities as they look very close.

As for the averages, most of the day they seemed to trade along with the news with few surprises in underlying trade, but there was a negative tone to the day overall.
 SPY 1 min and the decline around 12 pm as 10 year yields broke below 2%.

 The Q's intraday...

The intraday IWM is in line...

However lets not forget the bigger picture- 15 min IWM since this most recent cycle from 1/29-2/2 started.

Last week we were also looking for a pullback in FAZ, 3x short financials (bounce in XLF), here's where we stand with that trade set-up , Leveraged ETFs / FAZ...

 This is FAZ and the time when last week's trade set-up/FAZ pullback was posted and the pullback itself with a clear positive divergence in to the correction.

The bigger picture 15 min chart for FAZ is flying so this is another as well as other inverse leveraged ETFs we'll be looking at over the next day or so.

As for internals, somewhat amazingly (not when considering today's price action, but when considering how long it has been) again we have nothing even approaching a Dominant Price/Volume Relationship.

However coming closer to an overbought bias, 8 of 9 S&P sectors closed higher with the defensive Utilities leading (yesterday's laggard) at +.74%, the laggard today was Health Care at -0.12%.

163 of 238 Morningstar groups closed green, better than yesterday, but still mediocre at best.

I just checked for the first time in a couple of days, but the CBOE SKEW Index or the Black Swan Index is elevated and in the red zone at 136.26, this means there are more traders bidding up deep out of the money puts which would only make money if the market saw a sharp drop, thus the Black Swan indicator, which is interesting given the overall environment, price patterns, Treasuries/Yields. etc.

It almost felt like the market took what I interpreted to be a pretty dovish Yellen testimony more hawkishly than I'd expect, maybe they heard something that they didn't like or is out of line with the whisper numbers on the street. In ant case, as usual, I'll check futures before turning in and let you know if I see anything exciting, otherwise I'd expect another slow day with Yellen in front of Congress tomorrow.