Wednesday, March 18, 2015

Leading Indicator Update

We'll take pieces of the puzzle wherever we can find them, but it might be worth revisiting the February cycle which was very well aware of the March and June F_O_M_C meetings before it began as well as a rough idea of when to expect the first rate increases. Being we have seen homebuilder stocks under accumulation nearly 2 years before they gained nearly 5000%, I think it's safe to say the market has a pretty good idea where it's going and when in the very near term, especially when were talking about a bounce in to the F_O_M_C.

Quickly revisiting the February cycle, these were and I see no reasons to change opinion, expectations...
 Since 2013 and even 2014, the market ha largely been lateral, you can see this in how many times we have posted since the start of the year that the market is either at a gain year to date or is once again at a loss year to date as the Dow is at as of right now ( a loss year to date) and the SPX is just a fraction away from the same. The longer chart/trend 3C chart through this flat-ish range is the same concept seen on intraday charts or even daily charts, distribution and accumulation tend to occur at flat ranges more than anywhere, despite the large volatility in the range.

As for the Feb cycle, again this was a move to the upside we anticipated as the 2015 range was not going to allow the market to move lower until all of the goodies above the range were taken out in a head fake move, one which the SPX and other averages have already completely retraced. It's the move below the range that really sets the market up to challenge the October lows and break them. I think the market can and does set up cycles that in turn end at key points such s today's F_O_M_C. 

We have stage 1 base/accumulation, stage 2 mark up, stage 3 top and have entered stage 4 decline with a counter trend bounce which is common, we saw the same last September/October. in the stage 4 decline.

There's little reason to doubt this cycle continues and as it was meant to take out the 2015 range before the market could head lower, it has done that now. I see no reason to expect the cycle process to just halt here, the market knew darn well what was coming and I believe plans cycles out far in advance, in some cases, more than a year.

The general Broadening Top and the new normal reaction inside it are what we seem to be observing in the SPX. Typically 5 points of contact are made before a break of the top. The October low set the higher high/lower low of the broadening top and the late stage's head fake move has already occurred.


Since yesterday's Leading Indicators and Perhaps a Surprising Change in Dollar Direction update, this is what has changed...

As for the F_O_M_C, you probably know I have a dichotomy of thought between what's reasonable and what the F_E_D needs to do. To me it's not reasonable to remove policy accommodation as we see the worst start to macro economic data on the year , now at a new record low. However it doesn't make sense that we have been sitting at extreme emergency accommodation of ZIRP policy for 6 years when we haven't been in extreme mode. The F_E_D painted itself in to a corner. As most of you longer termers know, I have suspected the F_E_D was starting to look for a way out the same day they announced QE3, in fact maybe we'll go back to those posts. Everything since then has moved us closer and in to that reality. So while it doesn't make sense to tighten in this economic climate, it also doesn't make sense to be at emergency extremes this long, the F_E_D painted itself in to a corner and I think realized that some time ago and has been moving to undo that since.

I suspect the F_E_D is more afraid of something they see coming and their ability to respond than the damage of a rate hike as the macro economic data for 2015 comes in at the worst start of a year on record, whatever they are afraid of, it sounds pretty scary.

Updated Leading Indicators...
 First Pro sentiment indicators have fallen off a cliff, they were supportive for a bounce, but since it didn't happen with the R2K last week, they have been moving out of the market and today there's a sharp move in one of our 2 sentiment (Pro) indicators.

The second is doing the same over the past couple of days as the market just couldn't get the counter trend (normal) bounce off.

Commodities are still leading negative in the general and specific area.

High Yield Cirp. Credit had been supportive of the "W" base, but then fell apart.

And High Yield Credit has done the same.

In fact, PIMCO's HY Fund has done the same as well. This is what I was looking for, all 3 of my credit measures (broadly) confirming.

It doesn't look good.

Remember though, Q1 window dressing is coming up, we'll see what we can, it may be a bit too early, but there will be window dressing on the quarter as always. Now for the F_E_D in 15 minutes.

Market Update

Keeping in mind the Levers post from earlier and yesterday's Leading Indicators which I'll be updating in a few minutes, for the most part the intraday 3C /price action has been in line, however like the overnight fuel dump, there are some larger divergences that would indicate to me some larger chunks going through, again this is more of an event rather than a process which is not the norm.

First the EUR/USD as it has just made a pretty nice move, I'm not sure on exactly what yet, but it looks more $USd related to me than Euro related at least as far as the charts go.

EUR/USD pop on a still negative overall divergence.

Note Es (purple) didn't follow the FX pair.

The Euro itself barely has any divergence that would explain the move.

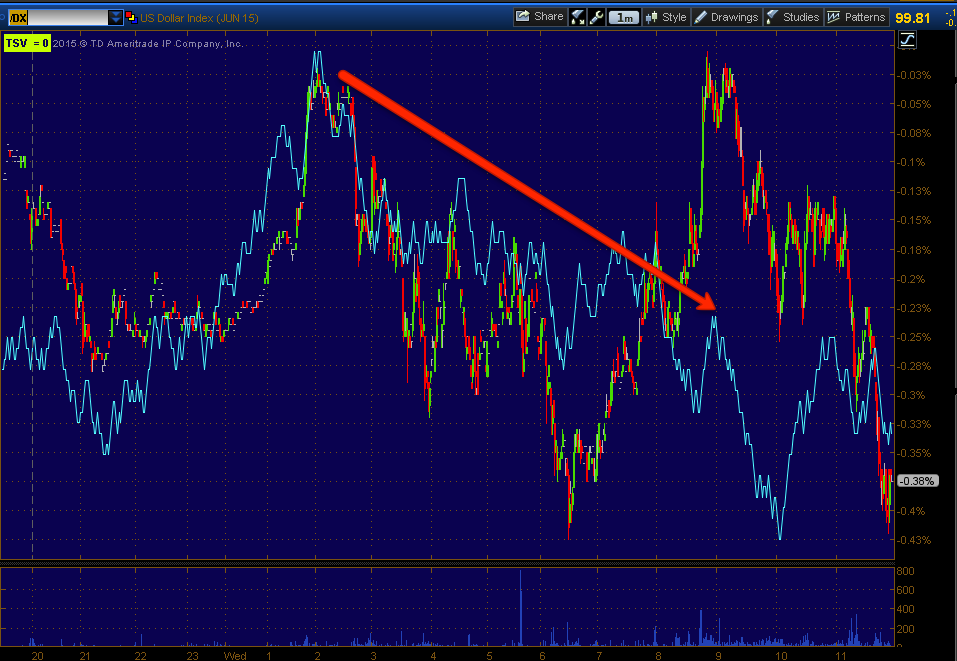
However the $USD does. There are a lot of dynamics around the $USD right now, but on a F_O_M_C day, this is a bit of a strange divergence in my book.

The fact the market doesn't seem to be interested is also a bit strange.

For the most part, across intraday timeframes in the 1-3 min area, the market has largely been in line, for instance 3C 1 min moving lower with the SPY this morning is inline or confirmation.

On a 3 min chart we see Friday's positive divergence that led to the call for not only a bounce in the SPY early in the week (price strength), but rotation out of the IWM which we also saw, but since then, inline.

I'd think there's be some signal of what the market thinks in a distribution or accumulation process, but there's virtually no process, rather moves seem to be showing up on the longer charts that would reflect bigger trades going through or rather than a process, a distribution event. I speculated this might happen if there was still gas in the tank that had not seen a bounce coming in to the F_O_M_C. I suspect the bounce was meant to occur at the same time and for whatever reason (I don't think it can be good), there was huge relative performance divergences between the major averages since the Russell 2000's move last week.

Here the 10 min SPY still has what I'd consider "gas in the tank", but we are seeing larger divergences in longer timeframes like 10 min.

Here's it's more evident on the QQQ 5 min, below 5 min QQQ is largely in line, above where larger transactions would show up, we are seeing stronger divergences and without the process of migration of a divergence or the distribution/accumulation process, indicating larger chunks and more of a distribution event.

We're still not at a divergence that I'd be taking action on at this moment, but we do seem to be getting movement.

The QQQ 10 min which has made a lower 3C low is another clearer example, especially vs the intraday charts that really look to be in line.

Or the IWM15 min from leading positive and a good start on a leading negative.

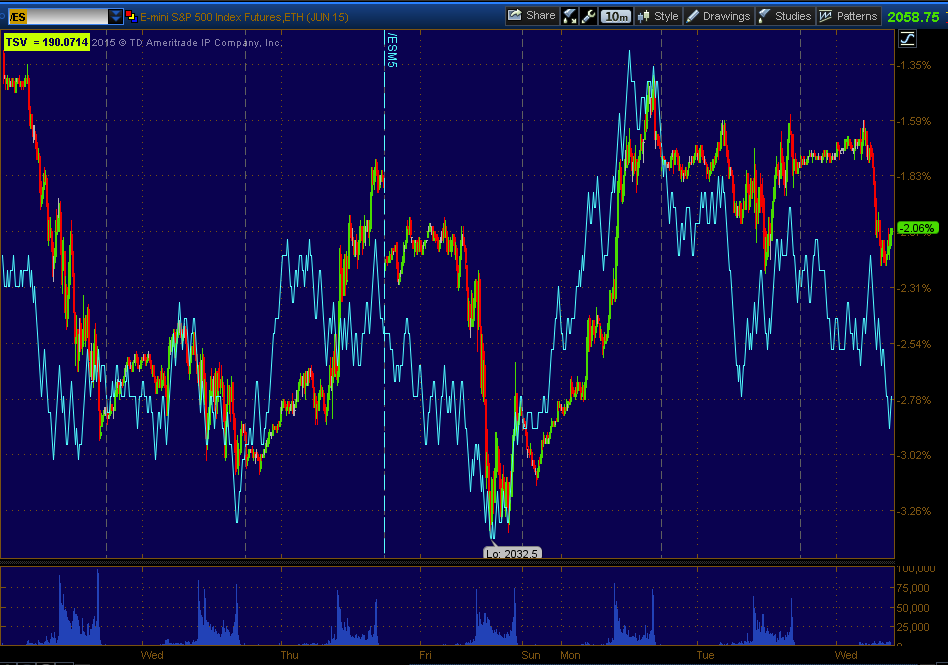
Also while not as pronounced in the other Index futures, ES 7 min, again a stronger timeframe shows a leading negative divegrence since the cash open.

You know what I've though about this bounce since last Tuesday and I haven't changed my position. Leading Indicators seem to have been in line with that position as well, that this is a bounce and not one I'd want to trade from the long side.

I'm going to check Leading Indicators again because a bit ago I saw some stronger signals that were a bit surprising.

I'll also try to get some pre-Window Dressing updates out like NFLX, USO, GLD, etc.


Levers

I'm doing my morning rounds, I just saw USO knee jerk on inventories so we'll get to that after the massive build in API inventories after the bell yesterday. The VIX also flash crashed momentarily near the open this morning...

VIX Flash Crash this morning...

TICK has been moving, but nothing too extreme.
NYSE TICK since the open 1 min.

I'm more interested in the levers, HYG, VXX (and its derivatives) as well as TLT as there's been more curve flattening since last night between the 2 year and 30 year.

The very near term indications on the 3 SPY Arbitrage assets are interesting in that they seem to be calling for more near term volatility which wouldn't be much of a surprise as we get a F_E_D/F_O_M_C sponsored knee jerk reaction about 90% of the time they have an event.

However I've always advised with 3C and other indicators, "When you aren't sure, go to longer term charts", they reveal more trend and higher probabilities for near term choppiness or volatility in shorter term charts.

The quick reference on the 3 assets is generally HYG up / TLT down / VXX down = market up. Or HYG down, TLT Up and VXX Up= market down.

Thus the short term charts may be left overs from the earlier anticipation of a solid bounce that seems to have just fallen apart in terms of timing and the market showing some degree of relative performance, or they may still be reflecting volatility and choppiness ahead. Unless the F_E_D has leaked and that information is discounted in to the charts, it may not matter, as the F_O_M_C is by far the major market fulcrum today which will easily run over anything below 5 min charts and depending on how big of a surprise they may deliver, can run over charts even longer although that's usual;ly less likely or the market finds a way back to those charts after the knee jerk is over.

In any case, I don't want to confuse you too much on speculation, lets just look at what we have using multiple timeframe and multiple asset confirmation.

 VXX Short Term VIX Futures is in line on the 1 min chart, thus closing UVXY for short term gains made sense from last Friday, but there's no extremes here, that could be because there's no solid short term opinion, but typically we'd see some stronger hedging to protect long positions against unforeseen events going against long positions. I wonder if there isn't a lot of hedging because there's not a lot of need by pros to protect longs, after all some of the biggest funds or most respected like Appaloosa sold 60% of their equity positions in Q4 2014 alone and they had been as Tepper put it,  "Selling everything not nailed down" since a symposium in May of 2013. $ trillion dollars in QE is a lot to unwind out of a market, it doesn't happen over night. Soros is another with his last filing from Q4 2014 showing he increased his SPY put position by 600% in the quarter to the largest level he's held since Lehman.

Of course I'm just speculating , but I'm also going by experience in front of these events which usually will have pros hedging any long risk they may have just before a wild card event.


XIV is the inverse of VXX and moves with the market, it's 3 min chart is in line with a very slight leading positive divegrence.

However there's a theme and it's along the indicator advice of "If you are unsure, go to longer term charts".
 At 10 min charts there's a dramatic, solid and confirmable change such as UVXY (2x long VXX/VIX short term futures) which shows a leading positive divegrence.

Like UVXY 10 min above and VXX 10 min (not shown), the stronger 15 min VXX chart has a very clear, chart popping leading divergence and in what I have suspected has been an accumulation range. Normally with a range like this that's fairly obvious we'd expect a head fake stop/run before a transition to stage 2. Remember VXX up= market down. As for a head fake move? I can't say I have evidence of it and I am not sure it would even matter if the F_E_D says the right or wrong thing today.

However this chart is not so easily dismissed as noise or volatility, there's intent there.

XIV is the inverse of VXX and usually moves with the SPX or market, it has shown a little better relative performance and I suspect for the same reason VXX has shown a bit weaker relative performance, to create a range in which XIV long positions can be sold at the best price, like VXX positions being picked up at the best price.

Either way, VXX, UVXY and XIV all confirm each other on 10+ min charts and they all point to lower prices in the market. It doesn't look so much like event risk hedging, it looks more like position taking.

 HYG / High Yield Corp. Credit which tends to lead the market led the ,market to the downside and in many cases pulled the averages low enough to retrace all of the February cycle's head fake move/failed breakout above the 2015 range. Recently though on this 1 min chart there's a clear positive divegrence over 3 days or so, sort of along the lines of short term VXX.
 HYG's 5 min chart shows the 2 trends at once, a larger leading negative trend that sent HYG lower with the market right behind it as HY Credit typically leads and stocks follow, thus the reason HYG is one of the best leading indicators we have.

The minor trend on the chart is a positive as well. This formed about the same time as the positives last week of which only the Russell fired, this week the SPY/QQQ got in a day of upside in rotation, but a day was it. I suspect this is left over from that planned bounce that has maybe gone a bit awry.

 What I do know is just like VXX/UVXY/XIV above around the 10-15 min timeframes which are by far stronger, is leading negative which is confirmation of every 10-15 mi chart above and below.

 TLT (typically trades opposite the market (20+ year bond fund). Remember yields move opposite bond prices, thus lower bond prices=higher yields=higher market prices typically.

This negative 1 min divegrence is quite small not only on the timeframe, but as far as length of time.

The TLT 3 min chart is similar to the VXX / HYG charts in the same timeframe, slightly negative on a relative basis.

However once again, move out to the intermediate term charts and...
TLT 15 min has a large base and leading positive divegrence, even though I'm not so sure about bonds longer term like last year. Once again, it looks like the market is either ready for some short term volatility or is in the midst of confusion or maybe even a transition.


The only thing that looks clear are these stronger, longer term signals all pointing to a lower market, I suspect that would be the case even in the face of a positive F_O_M_C initial knee jerk reaction.

However additionally since I've been looking at these charts, Leading Indicators seem to be slipping so I'm going to get a look at those as well. You may recall from yesterday, they were probably the strongest signal calling the overnight weakness in Index futures and beyond.

As for replacing UVXY, it's more or less a bonus position, not a core position so if I see a good opportunity I'll take it, but it's not necessary to follow the longer term signals that are already taken care of with trend positions (mostly short). I would however, love to have UVXY back as long as the charts are showing a strong edge.


A.M. Update

Good morning.

If there was any confusion in the market with yesterday's weak Russell gain of +.20% and the Dow's relative weakness above and beyond normal at nearly 3/4 of a percent loss, then this morning's futures ad bond action has cleared that up some with an clear RISK OFF across most every risk asset possible.

This is actually pretty lose to our forecast from last Wednesday of bouncing in to the 2 p.m. F_O_M_C or thereabouts.

There still seems to be gas in the tank for QQQ and SPY, not so much for the IWM and that may be why we saw some panic selling as expected yesterday, kind of a last minute emergency fuel dump, but as I said, there's still some gas in the tank and I expect we will still see volatility both ways right through the rest of the day and probably week.

Index futures...
 ES 1 min overnight

NQ 5 min overnight, this was less a distribution process and more a distribution event, like a fuel dump.

NQ 7 min. With 5 and 7 min charts negative, I usually have the all clear to trade from the short side, but I'd like to see the divergences during the cash market hours.

 TF 10 min shows it burnt its fuel last week as we have known.

ES 10 min is about in line so that damage overnight was to the 7 min chart, again more of an event than a process.

And NQ 10 min with some gas in the tank still.

Macro data across the world has come in very shabby with European risks rising, additional US yield curve flattening and not only the Greek situation coming to a head, but austerity in general as there have been thousands of protestors outside the ECB with some violent clashes.

However, today is all about the word "Patient", we'll have to be patient, in the mean time we'll be looking for leaks as we have found at least 3 over the years as well as opportunities.

So far, we're right on track.

Tuesday, March 17, 2015

Daily Wrap- Just Couldn't Pull the Rabbit Out of the Hat

Amazing, just about every ramping lever in the book thrown at the market today and we still close with significant market dispersion and mostly red.

Right around 11 a.m. (band the typical ramp time as the European markets close) HYG and VXX are activated in an effort to ramp the market higher. Around the same time the NASDAQ pulls a short squeeze until just after 2 p.m., then the NASDAQ options market breaks and BATS declares self-help vs NASDAQ options in what  was another short squeeze / end of day ramp attempt and still 3 of 5 of the major averages close red with dispersion or rotation between the RUT and Dow of nearly a full point with the RUT green at a paltry +0.20% and the Dow down -0.71%%. This isn't as bad as what we saw last week, but it has been virtually non-stop since last week. As posted before, rotation among industry groups.sectors is healthy, this kind of dispersion between the major averages is a red flag which was noted yesterday with a Hindenburg Omen.

Beyond the dispersion between the averages, notice anything strange about the price percentage change on this Dow 30 min chart recently?
Remember recent posts about increasing volatility as the market transitions from stage to stage, especially in to stage 4 declines? That's over 2000 points of Dow movement over the last 6 days for a loss of -.84%, pure volatility, I suppose you might also say it has something to do with the F_O_M_C tomorrow and the market's split opinion.

From the 2 year yield to the 30 year yield, there was curve flattening on the week with the short end higher/long end lower by 8 bps on the week thus far (yield curve flattening has predicted US economic slowdowns 94% of the time since WWII). However we barely need anything like curve flattening to tell us the US macro data as well as world macro data is down the drain.

 Bloomberg's MACRO Surprise Index with the worst start not only since Lehman which is what you see to the left, but...

The worst start to a year on record.

As you may know, I find it hard to believe that the F_E_D would start the process of hiking rates tomorrow by removing the word, "patient", at least that's what the market will be looking for as an omen that they'll have room to hike in June. It just doesn't make a lot of sense to tighten conditions as the economy is seeing such horrible performance, but that may be just it.

I also don't think the F_E_D should have rates at ZIRP over the last 6 years as if we have been in dire emergency circumstances since then, I of course believe this has been a stealth bailout for the banks. However the FE_D may see something coming as we all seem to and realizes there's little it can do painted in a corner at ZIRP.

Whatever it is, I believe the F_E_D is much more afraid of something that we are not aware of than they are of hiking rates and sending the economy in to a worse tailspin, what that something is, now that's a truly frightening question.

Despite the horrible looking Leading Indicators and Perhaps a Surprising Change in Dollar Direction, most of the averages closed in line on an intraday basis today, although several had some larger moves in longer timeframes which I mentioned this morning wreaked a bit of panic.

 QQQ 5 min

QQQ 10 min

QQQ 15 min

SPY 5 min

SPY 10 min

IWM 10 min.

While none of these are smoking guns, futures do have some interesting tidbits from last week/this week as this week was the first time the Q's and SPY have had a chance to move out of their base which they did for a day, today I'd barely call it much more than flat.

The ES 10 min chart is inline.

NQ 10 min, notice they look almost exactly the same as this morning, there really wasn't the kind of demand needed to sell in to however the odd man out...

TF/Russell 2000 futures 10 min, this one spent its gas last week, thus the forecast from Friday for a rotation which we saw yesterday with the R2K halving the performance of the other averages.

Today's dispersion was just a mess.

I see volatility, I honestly don't see what I'd consider a market leak, although I wouldn't trust the F_E_D as far as I could get inside the building or an outside auditor for that matter.


Even from a candlestick perspective, it's hard to pull anything out of the market except massive volatility, but it's also interesting where it occurs.
 SPX massive daily ranges in the candlesticks

Dow, also massive ranges as you know. Both are right in the area of the head fake moves that were retraced, a bounce from below that former support level made perfect conceptual sense. The rotations and dispersion since, that's obviously not something you'd call "healthy " in a market, but at the same time, this doesn't look like a market going in to the most important F_O_M_C meeting in years as each one from here on out will be called.


Thus with the way things sit, I'll be very interested in overnight Index futures action and tomorrow right in to 2 p.m. which ironically was our call/forecast last Wednesday, a market bounce right in to the Wednesday 2 p.m. policy statement.

If there's one concept that has been rock solid it's "BEWARE THE F_E_D KNEE JERK REACTION". I don't believe there's been a meeting that has gone by over the last 5 years in which I haven't warned about that in capital letters. More often than not there's an initial knee jerk reaction, sometimes hours, often days, sometimes weeks, but it's almost always the wrong reaction and is faded so be careful on any assumptions immediately following the meeting or the press conference.

While everyone and their uncle has a guess at what the F_E_D will do, I suspect they take a little and give a little, such as maybe remove patient, but perhaps say that they won't be hiking rates in
June. Don't take that literally, it's just an example, but that would be my gut feeling, that would obviously cause some crazy volatility, but I just remember charts like these...
 High Yield Credit (HYG) is not buying it...

VIX short term futures (protection) are buying it.

For the most part, Index futures are in line on the intraday charts except ES is starting to diverge.
It's obviously still very early in the after hours/overnight session and as always, I'll check them again before I turn in to see if there's anything very odd as we sometimes find.

As for some of the assets I'm interested in, you know I mentioned IWM, I just didn't see it today with a market that looked more confused and ineffective than anything, that's not quite the edge I'm looking for, but it is a message of the market and deserves to be put in with the rest of the pieces of the puzzle.

Internally today was a near mirror image of yesterday which had stronger readings in Industry groups. Today 8 of 9 S&P sectors closed red, but not VERY red. The leader was Tech at a not very green +0.02% gain and the laggard was once again materials at a 1.11% loss. Yesterday 8 of 9 sectors were green so the mirror opposite.

As for Morningstar groups, of 238, 106 closed green, that wasn't the mirror opposite of yesterday's 211 of 238 green.

There wasn't a true Dominant Price/Volume Relationship, again the averages are all over the place. The only 2 that got close were the Dow with 20 stocks and the NASDAQ 100 with 57 stocks, both closed at Close Down/Volume Down which is the least biased of the 4 relationships, I often call it "Carry on" as in do what you were doing because it doesn't have a 1-day or next day bias. The R2K didn't have anything even approaching a Dominant relationship, nearly evenly split between the 4 possibilities.

Finally I took a look at the Daily Breadth Indicators which I've been updating you on as we go over the last several weeks.

Last night I posted the readings that showed less than half of all NYSAE stocks (the biggest market average) are above their 40 and 200 day moving averages, more stocks are below them than above.

Tonight...What strikes me more than anything is the absolute lack of movement in any direction on the day, most indicators (breadth) just make a lateral, flat tick across today, not moving either way, which I suppose is appropriate considering the closes among the major averages, but it's as if the market were frozen in time or fear.

Well that's going to do it for now until I look at futures later in a few hours to see if there's any more movement. I'm not going to try to guess at the F_O_M_C beyond what I've already said, although I do have some strong opinions about it. If you can, watch the market as the policy statement and I believe we have a press conference tomorrow, take place, this is where I have found some of the most interesting market reactions, one kept us in short positions the day QE3 was launched although every bone in my bosdy said "COVER!", the reaction to questions and the charts said "Hold" and we did and saw the market move down nearly 10% from there and not recoup for 4 or 5 months to that level which was the highest high ar 2:24 the day Qe3 was announced!

Have a great night, I'll let you know if anything pops up.