Friday, May 1, 2015

NFLX Update

I think most everyone knows what to look for on a downside (or upside) "flameout" (intraday capitulation/short term selling event). We've had this scenario several times this week and I have posted what to look for and it seems you guys are making the concepts your own, which is all I could every hope for.

We have some history with NFLX...

 This 60 min chart of NFLX's two gaps up, both earnings based, shows the long term underlying trend of distribution. At #1 to the left is Q4 earning and the gap up which needed to be done to relieve market makers of underwater positions from the 10/16 gap down in which they likely got caught holding inventory at levels almost 20% higher.

Our entry (short) took place on 2/26, Trade Idea: NFLX Short, the best entry you could ask for, but we had to wait for it since the first Trade-setup, NFLX trade Set-Up, on 1/21, the day of the earnings gap up..We patiently waited for the right signals and finally entered on Feb. 26th, at the red arrow (vertical) Trade Idea: NFLX Short. A short at the highest close of the entire move, but it took patience.

After the most recent earnings (Q1) based gap up, on April 21st we started looking for the NFLX short entry, NFLX Update / Trade Set-Up. Our last short entry on April 27th, Trade Idea : NFLX Short

So why NFLX calls? We use multiple timeframe analysis and try to match the right trading tool (trade) to the timeframe we are trading. For a longer term position, the Trade Idea: NFLX Short is fine, but for a near term bounce....Today's, Trade Idea: VERY SPECULATIVE...NFLX Short term CALLS was the right tool for the time frame and expected move.

This is the 10 min chart showing strong deterioration.

However very near term the one minute chart is showing a positive divergence in line with the market balance we expected. Two thirds of stocks will move directionally with the market.

This two minute chart of Netflix shows a much cleaner divergence although it is only a two minute chart and thus we can't expect much more than a bounce. This is the reason I chose to use the leverage of options.

The three minute chart is also positive, But that's about where it ends.

This is the five minute chart as you can see, negative

At 12:13 PM today, I got this email:

"And there it is a spike below post earnings lows, yesterday low and this mornings low. High volume.
 
Let the short squeeze begin ..."

This is what our member was looking at...

As I have said over and over again, it doesn't matter what the asset is, It doesn't matter what the timeframe is. The best price-based indication of a trend reversal (on this short term trend), is a head fake move. In this case it would be a stop run. This is exactly what our member was referring to as you sent the email at the red arrow as price broke below the intraday lows on surging the volume (stops are being accumulated).

I'm glad to see the concepts being utilized.

Trade Idea: VERY SPECULATIVE...NFLX Short term CALLS

I'm going to open a "bounce" NFLX May 15th $555 call position, but in very speculative size. I expect to be closing it early next week.

More confirmation of our Near-term Price expectations

I have an email I want to share with you and hopefully will have time to, it's fantastic.

In the meantime, I'm watching the market run up right now as the 2 p.m. (approx.) max-pain options expiration market pin expires. While I obviously think we have more bounce to go, there are signals in VXX (VIX short term Futures) as well as the 3x leveraged UVXY (which is at over a +40% gain since yesterday afternoon) and VIX futures themselves that confirm our near term expectations of a market bounce and that's all. When the charts turn negative intraday for the market, we will be making new lower lows and that proof is being accumulated in VIX products right now.

Remember an accumulation signal is not a signal to necessarily go long, it's showing us what is happening under price's surface as these assets pullback. Te only reason to accumulate them (beyond getting in at lower prices) is because you (and by that I mean smart money), expects the market to end or continue with something much worse than what we have seen this week so far.

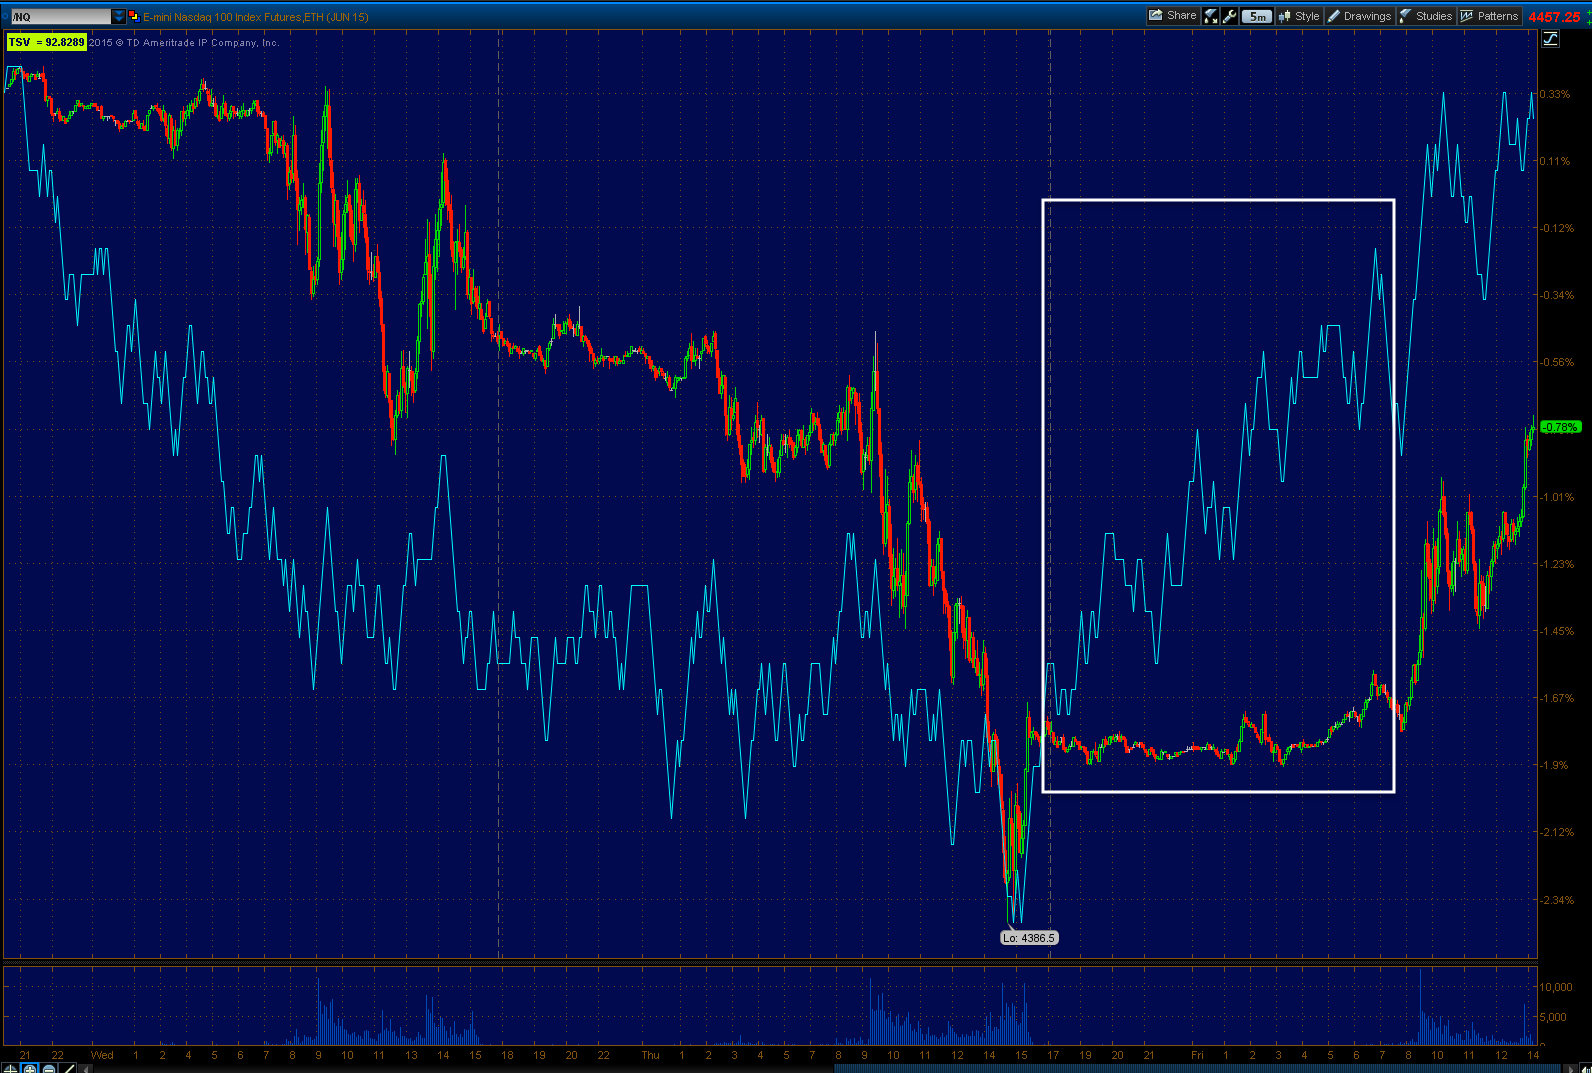
 NQ 15 min still showing a nice positive divergence, in line with out bounce expectations...

The 5 min NQ chart is showing no signs of distribution yet.

Nor is the fastest 1 min chart.

For that matter, neither is the 1 min QQQ or any of the other averages...

like SPY which is in line, confirming the bounce intraday.

However, I'd normally expect to see VXX accumulation once the above assets started to show distribution, but it seems someone with deep pockets is willing to grab as much VXX/VIX related assets as possible on cheaper prices and they got started immediately.

VXX
 1 min leading positive divergence in to today's losses...

That signal has migrated to the longer 2 min chart.

UVXY is showing the same accumulation.

And most surprisingly...
VIX Futures are showing intraday accumulation.

It seems to me very clear that once this bounce ends, we are headed for a much nastier downside move in the market.

Broad Market Update

So far everything is going according to expectations. As I said yesterday, the USD is one of the strongest signals for a near-term bounce that I have, although far from the only signal.

Today I might not be able to make the same statement. However I think it is critical to understand the nature of our expectations for the USD and how those affect other assets and more importantly the repercussions of where we are right now in the USD which I think very few people realize the nature of this inflection point and how pervasive it is and how much influence it will exert across multiple asset groups. 

They have posted probably half a dozen or more USD articles this week, if you don't have a basic understanding of our expectations, then yesterday's post, $USD Update & Market Repercussions is an excellent place to start. Given the USO post today with USD connections, a second post from Wednesday would also be insightful, USO / Oil Update, the Carry Trade ($USD-Broad market too).

I can't update the market without updating the US dollar as well. Or perhaps better said I cannot stress enough the probabilities of our expectations for near and larger term market action, without touching on the US dollar.

As for the normal "Market Update" 3C charts of the averages...

DIA
 2 min 3C chart with yesterday's head fake/stop run move we anticipated and warned to look out for in this post from yesterday, Market Update (I post it because the concept as to how to identify an intraday flameout works in any asset and all timeframes so it's a useful concept for your tool box).

*This is the chart from yesterday and commentary from the 1 pm Market Update if you just need a quick look without reading the entire post as I will be showing yesterday's action in context of a head fake move.

"Something at least like a small "W" base-be on the look-out for another head fake stop run below this morning's lows on the formation of a second low and wider base."

Back to the DIA...
 This three minute chart shows the deterioration this week in three she end price as well as the head fake/ stop run we warned about above which as you can see was accumulated as expected. There has been no V shaped reversal to the upside, which would not last very long, if even intraday. Today we continue to work on the reversal process for this bounce.

 This is the five minute DIA 3C chart showing the forecast since April 2. I believe the distribution in three she is clear. Using this chart in the context of multiple time frame analysis, you get to see the positive divergence for our anticipated bounce, but also its probabilities vs. what has already occurred-massive distribution. In other words I am using this chart to put the expected bounce in context.

 As for the longer term view using multiple Time frame analysis you can see the extent of the damage done at the April forecasted area in which we saw Head fake moves above the various triangles in the averages. The importance of this is we new technical traders would chase it and SmartMoney would sell into it. This is a pivotal area for the market.

SPY
 The SPY 5 five minute chart with a relative positive divergence to the right which shows accumulation of yesterday's Head fake / stop run.

 We even have a relative positive divergence on the 10 minute chart. From left to right, note 3 she confirmation of the uptrend into distribution at the top and a bounce in the works as I already touched on today and in the past, price's affinity for loitering in the area after an initial break. To put a finer point on it, call it a new short seller's shakeout after a day like yesterday.

Most traders chased price.

I didn't want to close UVXY (long) position earlier yesterday unless we got a head fake move below the morning lows which would make it worthwhile to take the gains and re-enter the trade at better prices which is what we did.

UVXY 10 min
 As UVXY trades opposite the market, the yellow trendline and move above it would correlate with the same point at which the market made a stop run/ Head fake. You can see clearly that taking that trade off the table and booking the profits was the right thing to do via the 3C chart's signal above.

As you know we also opened an additional trade on the move, Trade Idea: Extremely Speculative (Options/Puts) VXX

SPY...
 60 minute chart needs to no commentary. This is the highest probability resolution of any upside move from here, a failure and simply a bounce.

QQQ
 1 min with an increased leading positive divergence today. You can see the clear accumulation of yesterdays run of the stops under the other trendline.

 QQQ 3 min showing a relative positive divergence.

 However at the five minute chart 3C is at a new leading negative low with no positive divergence indicating a bounce so it is not that strong as it has not migrated to the five minute chart. We should return to making lower lows as soon as the bounce is over.

 As a reminder of the damage done to the market, a 30 minute QQQ 3C chart. Note where price and 3C are at point "A" compared to point "B". If there is trend confirmation 3C will move higher with price. We have higher prices at point "B" than at point "A" with much lower 3C signals at point "B" indicating extremely strong distribution through this area.

 The same as seen on the 15 minute I WM chart.

As for index futures, ES (SPX E-mini)...
 This 10 minute chart of ES should put everything in perspective for the local area, but I did want to show the positive divergence for our bounce. I just want you to keep it in context of the larger signal on this chart.

 This is a close up view of the exact same 10 minutes ES chart and positive divergence.Once again it is showing accumulation of yesterdays stop run just as the averages above. If you have not read the two articles linked (near the top right side) on the member site,"Understanding the Head Fake Move", you are missing a lot of context here and a lot of great concepts such as the head fake move which we used yesterday to enter VXX Puts which are well over a +30% gain today using May monthly / in the money Puts!

 This is the 10 minute chart of $USDX and one of the first signs that we would see a market bounce soon. It too, much like the market is building a broader base with a stronger 3C positive divergence/ accumulation.

 However, just as we made a market forecast on April second we also made a $USD forecast on the same day which anticipated a large bounce to the upside (green at "A") to be followed by an even larger decline (red at "B") to the downside. At the yellow areas, We have simple, corrective, counter trend bounces just like we are expecting now.

However to put this in broader context, the $USDX (futures) daily chart.
 First the daily chart with 3C showing significant distribution as the trend has changed from upper to lateral in a triangle-like formation.

At #1, the $USDX failed to make a higher high for the first time in this trend, that was followed by a lower closing low.

I suggested that the intraday low at the yellow #3, would be an ideal area for the USD to put on a countertrend bounce.

Almost everything about the USD and the market are interchangeable as if they were one. This is that, "Beauty" or "ballet" in the market that I posted about last weekend and we rarely see but it is one of the most profitable times in the market.

Here are the posts from last weekend on the subject:

Important Market Update Part 1: The Forecast

Important Market Update Part 2: The Forecast Plays...


This is a close-up view of the exact same chart above showing the triangle-like formation which is exactly what we forecasted on April 2. The broad market averages were forecast to develop very obvious triangles and for a head fake move above those triangle to break out and fail. This has already happened and the head fake move has been confirmed.

We will use the bounce to sell in to or to sell short in to as well as manage any trades put on such as the VXX  puts yesterday.

Everything continues to go according to expectations.

USO / Crude Futures Update

I think there can be little doubt that our USD expected (countertrend) bounce, Will have implications for oil as well as the many others I have recently covered.

In that sense, since the $USD is starting to make a break higher, the USO position seems particularly well-timed, although yesterday would have been better.

Here's the latest update for USO and Brent crude futures with a little USD mixed in.
 I post this crude futures one day, base and positive divergence quite often because it is a 3C textbook divergence in an important time frame which I believe will be the primary trend eventually.

We don't get the see these often. Many of you may recall the homebuilder charts I have shown in the past that were under huge accumulation as the tech bubble was bursting in 2000. The point of which, after the tech revolution who would've ever thought that boring housing would lead the next bull market? The point of that being, smart money new at least a year or two in advance and had been accumulating for well over year. That's a pretty lucky guess!!! Especially since many of those charts saw 2000 to 4500% gains!

 The daily USO chart and resistance at the yellow arrows with a stop run / head fake move at the yellow square. This is a tough call forme because I do believe oil is on the verge of a primary bull trend, I just believe that it needs to pullback and gather I head of steam before trying to take out base resistance and breakout to stage two, Mark-up.

 Our X-Over screen to prevent false, whiplash signals using three conditions including a custom indicator in the middle window (yellow). You can see on this three-day chart where the sell or sell short signal was given and you can see USO is very close, if not at, a trend buy signal. This is a trend timeframe so the buy signal does not rule out a correction/pullback.

 USO 60 min after near perfect confirmation from 3C, the divergence should be obvious to the right.

 CL/ Brent Crude futures 30 min

Brent crude futures 15 min

 USO 15 min

Brent 7 min

USO 5 min

 USO 2 min timing chart.

 $USD 30 min rounding bottom and positive divergence for the expected counter trend bounce...

The USD in red/green candlesticks vs. Brent Crude futures (purple) with an obvious inverse relationship. This bounce in the $USD should be just enough to finally knock USO in to correction as outside events such as the Iranian shipping news, recent Inventories coming in better than expected, Russian/Chinese Mediterranean Naval drills, etc. have kept it right at resistance without a pullback.

Trade Idea: USO Puts (May 15th - $20 strike)

As you probably already know, I have put out a USO May 15 $20 Put position as well as a USO short.

I wish I had added to that put position and brought it to full size yesterday, but I will do so today (tracking portfolio).

As mentioned previously, This will be a May (monthly) 15th Put with a strike of $20.

I'll update additional charts next, but I believe you've seen quite a few recently.

Early Update

All news and macro data aside, as forecasted, Japan which was down -2.7% yesterday closed at near unchanged, green +0.06%, this is the reversal process as we rarely have "V" shaped reversals that hold and we should be seeing a bounce in both the Nikkei and the US markets that will hold beyond just an intraday move. This is not to suggest anything that should be frightening in terms of a bounce, it's just quite normal to loiter in the area of resistance before making that solid break.

Some examples...
 The Nikkei 225 futures on a seven minute 3C chart with that typical rounding/ reversal process while 3C is in a leading positive divergence. Reversals are a process 90% of the time and look similar to this, not an event which looks more like a "V" and as you have seen recently they don't hold up well ("V" shaped reversals).

 Depicted on an SPY daily chart, this bullish Harami reversal is sitting right there at former resistance which became former support which is now resistance again. This is not uncommon for price to loiter in the area for a brief time, it's based on human psychology and our unwillingness to adapt.

 On an intraday chart of the SPY, it looks more like this which is an upside downIgloo with Chimney, yesterday's stop run/head fake being the chimney.

 2/3rds of stocks take their cue, directionally, from broad market. As you can see AAPL looks very similar to SPY as price sits in a Harami reversal and right at resistance/support... Loitering.

To prove this, here is the September top which rolls into the October lows...
Again, note the rounding top and Head fake move (Igloo/Chimney) and price loitering in the area for a brief time before collapsing.

Chinese and European markets were/are closed today for May-day. The UK will be closed Monday.

Yesterday's VXX Put position, Trade Idea: Extremely Speculative (Options/Puts) VXX, is already at the double-digit game in addition to the profits taken inUVXY (long) yesterday. Some of our newer members may be wondering why I took out a May monthly expiration for a bounce, it is not because I believe the bounce will be anywhere near this long, I have just found that using an expiration with at least three times more expiration time that I believe I'll need has increased my winning percentage of trades by at least double. Obviously the percentage gain is lower, but the probabilities are much higher (I also like to buy in the money). Overall, after doing it both ways for quite sometime I have found this to be a much more profitable tactic over the long-term. At least that's my experience.

I'll have updates out momentarily, but so far so good.