Friday, July 16, 2010

This says it all

I hope everyone had a great week, this is just the start of great things to come-as I said, Patience and always-Risk management. We have a huge opportunity that just opened up way bigger then I thought. TODAY was PURE PANIC selling, not the kind you see at capitulation, but the kind you see at the start of a big move down.

Thanks keeping the faith, hanging in there. I'd think most of you (from emails I've received) are well on your way to great profits. Remember, most people got knocked around pretty good reacting to every gyration up and down in the market for significant losses (I've seen those emails from non members too). We've had a strategy and today it really kicked into high gear. Congratulations-Have a great weekend and I'll see you on Sunday.

Oh, don't forget to check Trade guild tonight, specifically look for the link to Cramer's recent foot in the mouth. This is why (he's not dumb) you can't trust what you hear on CNBC for the most part.

Take Care!

Brandt

Good Calls Last night?

I told you we'd look at a company before earnings (last night C) and look at it today.

OK-watch for an intraday bounce here anytime. Maybe a good time to add if you want or need to.

Thursday, July 15, 2010

TONIGHT YOU ARE SEEING THE SAME THING AS WOW SUBSCRIBERS FOR THE MOST PART.


Last night I mentioned a few key words, “Patience” and “confirmation”, this is why we don't need to be active in the market everyday. If you are a professional poker player, do you raise every hand? No, you wait until the probabilities are highly in your favor before you push. While we do have a negative bias to the market and it could have very well continued down today to make an extremely bearish close, we can't know that until it happens. Just like you can't decide to bet until you see your cards. This is also why we phase into positions. You could have taken a partial short position on the afternoon strength today, but you shouldn't go swinging for the fences on a day like today, not until we get confirmation.

While the market is decideldy bearish, it runs on its own schedule; there are thousands of reasons a market can do something other then what you thought it would do, and you can still be correct with regard to the final verdict, but the market will get there in its time, not yours.

A bunch of news was out today, from BP to Goldman Sachs and the market didn't take a strong stand one way or the other. Sure, you can see some intraday bullish activity, but this could be institutions setting shorts, so that bullish activity that you see, could actually be bearish activity. Things are never as they appear in the market.  Or it could be the market simply doesn't know how to digest the news. I believe it's bigger then news (unless the news is totally unpredictable, meaning an event that no one saw coming). I believe what we are seeing probably has some reason behind it. The price/volume relationship today showed a market that reflected the price moves which were in effect nothing. The P/V relationships had a slight bearish bias but were largely spread out evenly, very apprpriate for the price action today.

If we look at today's candle what we see is reminicient of a hanging man, which is a negative, reversal candle as the name suggests-the opposite of a hammer. Taken with yesterdays Harami pattern, it wasn't bullish at all. The recent candles actually look a lot like the SPY's top we saw in June; the volume is roughly the same, even the price level is similar.

(*Note that the Harami is much more apparent yesterday in the S&P-00 index then it is in the SPY shown here). Both had Harami reversals, both were followed by an approximation of a Hanging Man candle, the volume was the same in both and price levels were similar. (Harami in the red box, hanging man marked by the red arrow).

Here's some more in depth review of the intraday charts,

Here's the Bear Flag I mentioned in the intraday update-this flag failed as we saw a breakout of the pattern, however, as usual, we have to be on guard for the false breakouts that accompany so many of these obvious patterns. As you can see, the last candle was pretty bearish as was the volume.

15 min 3C SPY chart-Note 3 negative divergences, all led to downside reversals of some degree (in red), then we saw price confirmation of the trend (white) and confirmation of the move up-there was no positive divergence preceding the move up. While the close can not yet be considered a negative divergence, it did not confirm strongly either and as we saw the last candle of the previous chart, here we see a bearish Shooting Star at the close right around resistance where we saw the earlier negative divergences and reversals.

3C v.3 5 minute QQQQ. This is not bullish action. Note the price levels and the dip in 3C correspondingly. 

SPY 5 min 4C chart. Again, we see the same type of negative action as in the Q's with 4c.

DIA 5 min 3C v.2. And to round it out-the same in the DIA.

Here's some good news, AMPL made a nice gain for our members, but as I mentioned last night, a pullback is coming and here it is. I think it's probably a buy around the 10-day moving average in yellow.

We've been talking a lot about how Wall Street operates and the amount of leaks. I have to wonder if the SEC's action taken-which amounts to a dog and pony show-was well known in advance as we see a very positive divergence in GS on this very influential 1 hour 3C chart? I wouldn't be surprised one bit.

Speaking of Gold..
GLD, purely from a price action/volume point of view is not looking too good. We have a break of the uptrend and now a bear flag present. The 3C charts suggest there's still upside room left. I would not be surprised to see this very obvious pattern shaken out so I have an initial upside target where the blue box is, which corresponds to the "Kiss Goodbye" of resistance, but even that is obvious so the target could be a bit higher. If you want to take action on a short play of GLD, wait until it breaks below the flag. It is okay to phase into the position at higher levels, but not more then 50% until we see that break below the flag. Note the volume, it must diminish like it is doing now to confirm a flag.

We have several financial institutions reporting tomorrow wich should be interesting.BAC earnings are reported tomorrow, I'm not sure when though.

BAC will be interesting because it formed a weak Harami reversal yesterday as did the market, however today it put in a bearish engulfing candle that I would normally take as confirmation, but with earnings tomorrow, I'd wait on this one. However, remember it's not the news, but the way the market reacts to the news so earnings may blow away consensus, the stock could still sell-off. Keep an eye on this one as an opportunity is at hand if all goes well. The red trendline, if broken, would represent the area where you'd want to be "all in" the position, however you can and should phase into the short above support if the reaction is bearish.

Charles Swab will report as well as Citi below,
Here's Citi's daily chart with 3C in the top window and MoneyStream in the middle window. Both indicators refuse to confirm the price breakout-not bullish.

Here's C's 4C 60 min chart, again we see a failure to confirm the breakout-negative divergence.

C's 4C 30 min chart, shows the same failure.

The 15 min chart did not confirm the breakout, but there is some confirmation in this afternoon's move. If the market did not react this way, I'd think maybe C will come out with something it could rally off of, but since this is what we saw in the market, it's difficult to say.

Here's C'c 5 min 4C chart, again we see the same confirmation, even a positive divergence like the market put in, so I'm leaning toward the idea it's just following the market. The 1 min chart shows the same thing. My guess would be, whatever C's earnings are-good or bad (remember it's not the news, but the reaction), it won't respond well over the next week, although it may in the short term.

Finally, the $USD

I warned about the reversal of the dollar to the upside in October last year, I even gave a target of $88, it hit that. I'm using UUP as a proxy, but it looks really bad on this daily chart. Not to say we won't see some rallies because that is evident in some intraday 3C charts, but I think the move is officially over marked by this ugly leading negative divergence in 3c.

For tomorrow, it's "second verse, same as the first". Patience-Confirmation. We'll be there soon enough, there's no need to take risks right now when we don't have the probabilities HIGHLY in our favor yet. As a rule, when I traded full time for a living, I always tried to stay away from trading during earnings, there's too much Tom Foolery going on.

Enjoy your weekend.


JPM

As I mentioned, JPM looks bad all thins considered, but we may have a chance to grab some short shares as it looks like a little intraday bounce is coming as it rides the wave of the market

So Far , So Good

Look at JPM's earnings and look at JPM's price action today, sentiment seems to have shifted as 3C was forecasting.

When we drop below the SPY gap at $108.03, the chances of the reversal being in are much higher. I think you can, if you need to start your short position, use any strength today to do that in small amounts until we cross below the gap. If I had no position at all, I may add 20% today, up to 40-50% below the gap and then keep phasing in, at $104.20 I'd want to be loaded-for me that's 75% of portfolio short with 25% in cash.

Perhaps today's Fed minutes added fuel to the fire.

Sometimes It Doesn't Smell Right

That was last night, it didn't smell right. I was on the verge of calling for a trade in a carefully put together portfolio that would have sacked 30% of the positions I carefully selected through the last several months and I knew it was wrong, it felt wrong because I was considering this purely because that was the direction the sheep were headed, I would have flocked with them and I WOULD HAVE BEEN WRONG, at least up until this point.

So I'm very happy with last night's analysis. The indicators worked, I just needed to listen and unfortunately I needed to find the reason rather then trust objective data, but it all worked out, the huge after hours gap was destroyed by the time we got the Retail Sales numbers, which were bad, but as usual, the media finds the silver lining in "ex-autos", but our economy doesn't run on "ex-autos". The consensus was 2, it came in worse then consensus at 5, a lot worse.

This leads us to something else I've been talking about a lot lately, LEAKS! They are everywhere. Last night's analysis and the gamble that there would be no gap up in the face of a huge after hours indication of a gap, was based on the charts showing selling into what would otherwise seem (on the surface) to be a very bullish environment. Why were they selling into this "Fantastic economy, judging by earnings that are out this far?" Because they knew something the rest of the sheep who were bidding up the market didn't and that thing they knew was, that Retail Sales would fall short. Lucky guess on my part? 10% maybe yes, 90%, I don't think so. I have seen this for years, time and time again, whether it's Fed policy directives or Fed surprise announcements, government oil inventories, government policy, monetary policy (anyone recall my long call on the dollar way back in October 2009 about a month before it kicked off a 20% rally and before the administration said they'd support a strong dollar policy?) Or how about the call 1 week before oil's 5 1/2 year uptrend broke, the same week Cramer was telling everyone to buy oil!

PLEASE, DO NOT MISUNDERSTAND, I'm not trying to pat myself on the back and I'm in no way claiming GURU status. I'm a student and I'm simply following the charts and my indicators; writing those indicators is the only thing I deserve any credit for-everything else is just reading them. And in reading them for 4 or 5 years, I've seen time and time again these leaks, these moves that came out of nowhere only to be followed up by a surprise Fed policy announcement. It's simply the experience of understanding, or starting to really understand how the market really works and it would and will turn most of your stomachs. The amount of corruption in the market is astounding and the parties that are complicit in the corruption are very surprising and quite disappointing. Since I've been onto this, I've received emails from floor and former floor traders that have enlightened me as to how things go down on the floor. In one word, it can be summed up as  "Betrayal". These guys are out there betraying their own customers for their own economic gain and not the gain they deserve for a job well done.

I really liked the idea of straying from the herd, getting out of the mainstream retail thought patterns and creating Wolf on Wall Street, but I never imagined how appropriate the name would become.

Anyway, enough of the rant. Stick around long enough and you'll see it all for yourself.

Besides mastering risk management, I really want you guys to focus on the charts I'm putting up, especially the divergences in charts like 3C. Those charts alone will show you how things really happen. People and I, even think and thought that institutional money helped propel bull market's higher with buying, 3C will show you they bought long before and they are selling into strength. One day soon I'll post the 3C and other charts on homebuilder stocks back in 2000-they were under serious accumulation, but very quiet as everyone focussed on the tech melt down. These guys put together huge positions in the home builders several years before they REALLY took off and guess what they did during the entire bubble that was being created? They sold the entire time-for years-in some cases that is how long it takes to distribute a large position.

Now for tomorrow, the idea and keyword is still "patience." Yes, we can jump the gun and maybe make a few extra percentage points, or we can do the responsible thing, we can practice one aspect of risk management and wait for a confirmed reversal before we start taking significant action.

Here are the charts....

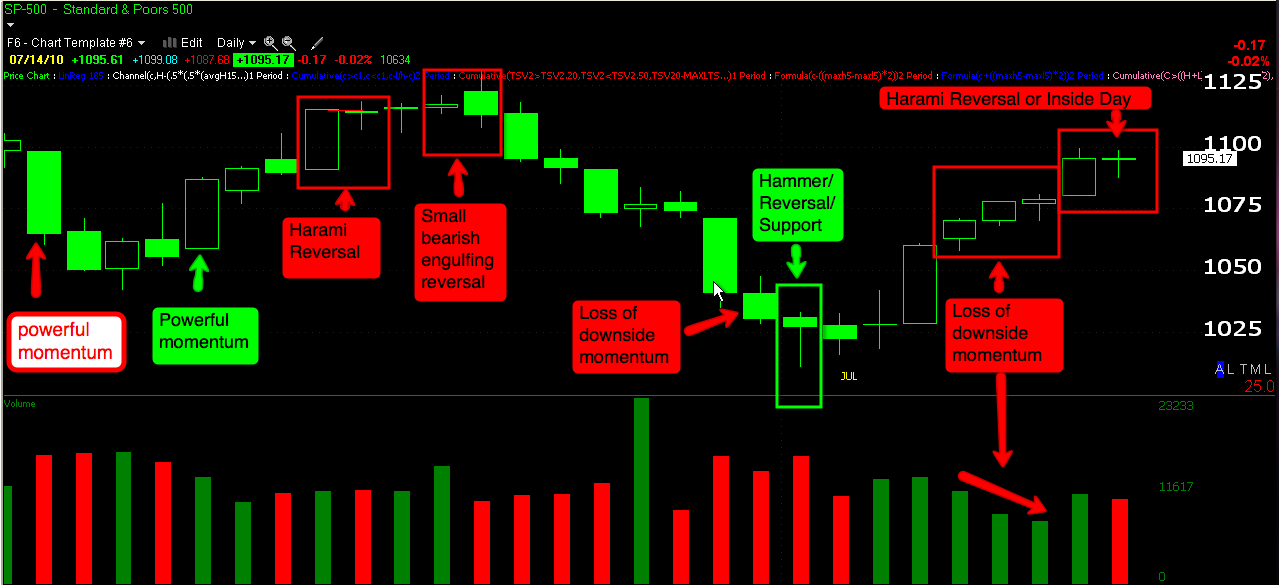
As you may have noticed, I use candlesticks because they do what every good technical indicator should do, they show you human emotions and they have worked for hundreds of years because of one fact-human emotions never change; even the algo programs are written by humans. So take a look at some patterns and candles and look at today's S&P close. Today the SPY formed an inside day, but the S&P formed a Harami Reversal, it should look familiar if you read the chart from left to right. Note how volume interacts with these candles as well.****CORRECTION-the red box with 3 candles on the right should read "loss of upside momentum"******


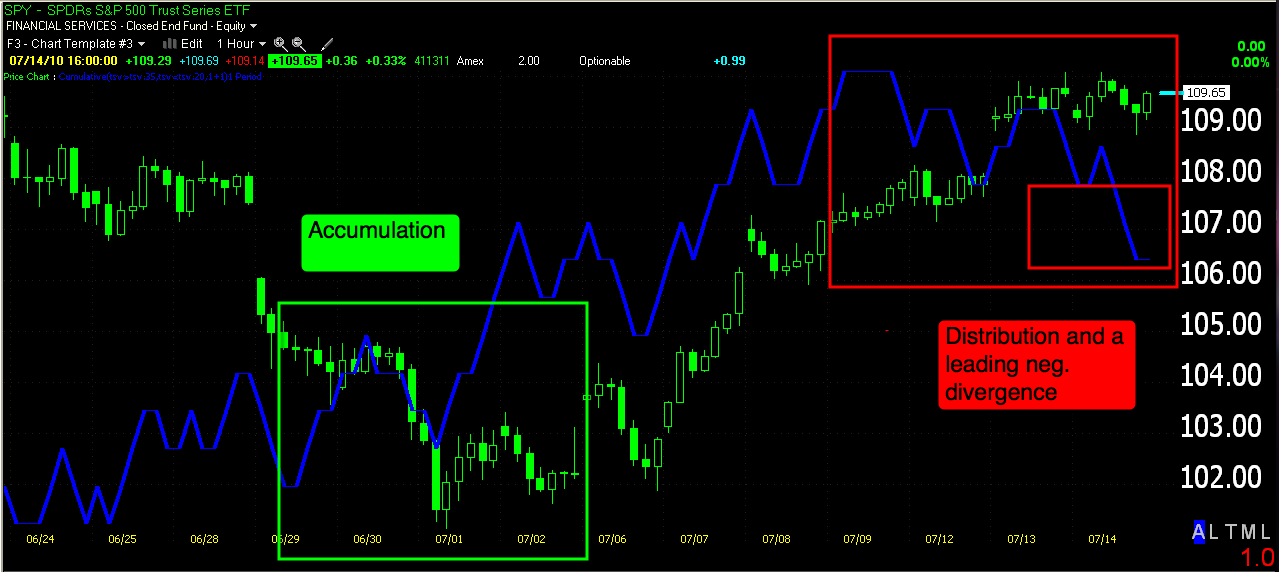
Here's the SPY 1 hour which is the most influential intraday chart showing trends that last weeks or more. This blue indicator is 3C version 3 and in the green box we see accumulation (price makes lower lows while 3C makes higher lows=positive divergence/accumulation, eventual reversal). In red we have the opposite, a negative divergence. Note how price can not escape the gravitational pull of a leading downside negative divergence.

Although this chart is a bit longer in the zoom factor, it looks just like the chart above, but it's the DIA, not the SPY-remember that markets usually flock together.


And this one? The QQQQ. Looks similar right? So this is telling us that there's distribution which leads to a reversal. We can still have a bumpy ride, but the big picture here is saying that this rally isn't so strong, in fact it's most likely a typical Wall Street shakeout.

Here we see a detailed 5 min 3C version 2 chart of the Diamonds (DIA). Note the negative divergences in red and positive in green, that is what is so powerful about this indicator, it isn't lagging as most are, but a forecasting tool. In white we have confirmation meaning no divergence and 3C confirms the current price trend which appears to show the possibility of some early strength on a short intraday basis, a matter of hours most likely if it keeps up.

The Q's show the same confirmation all the way to the right. Be sure to click on the charts and read the annotations. Remember, these are two different ETFs for 2 different averages using 2 differently written codes for 3C showing the same thing.

Read the posts here and at Trade-Guild about BAC and what happened this past weekend and you'll understand why it's in such bad shape on this 4C daily chart. This is actually a negative leading divergence.


We know that there's distribution on the daily chart, so we turn to the intraday charts to try to pinpoint the exact point of reversal. Right now this 3C version 3 is showing a leading negative divergence, suggesting the bounce in BAC (largely moving with the market "A rising tide lifts all boats") is just about done. Look at the last negative divergence on the left and how it led to a reversal (red arrow) and the positive divergences that led to the bounce (green arrows-cause and effect are very easy to see). The difference now is that the daily chart is in much worse shape. I have a feeling this is the last time BAC will be above that support level that has been in place for 11 months and that makes this a stock worth considering as a key short, but WAIT for confirmation or ease into it for risk management's sake!

And AMPL! It's been a rough ride with the volatility in this low priced stock, but I've maintained my bullish view on the stock for one reason only, here it is....


This daily 3C v.3 chart is in a monster leading, positive divergence. This stock has been under accumulation for awhile and on a day that the market was lackluster, it gained 7+%-I said I liked it as recently as last night and has been featured here for several weeks. This is a great pattern and it may pullback, but I think it has several months of rally in it judging by the amount of accumulation-and this in a poor market overall!

So the plan is the same, be patient-if you are new, take a look at some of the shorts we are using on the June list including June 2 or 3rd (I think 3rd)-it has ETF's that cover all the major disaster groups, but mix in some straight up shorts as well. Past articles will explain why.

Be patient, wait for confirmation before swinging for the fences. Many of you who have been here for awhile already have your position in place, it's just a matter of managing the trade at this point. For the new members, when the SPY is back below $104.40, we expect to see a viscous drop and I personally want to be 75% short at that point (and already am), then save at least 25% in cash for opportunities and possible hedging.

I'll update in the a.m. If you do not receive the email updates, please email with the address you want them sent to. Have a great rest of the week.

Wednesday, July 14, 2010

And They All Fall Down...

Here's the QQQQ this a.m, it was the single of the 3 that gapped up, but as I reminded you below, except for short periods in sector rotation (usually in a bull market), the indices typically trend together and the Q's would catch up and fall with the SPY and DIA.

I don't know yet how much this retail sales report will hurt the market's rally attempt, the rally overshot our target posted nearly a week ago (even when the market was still in decline), by about 2%, which is not horrible considering the uncertainty of earnings and the fact it rallied over 7%, plus the fact that the rally and target were posted days before it even started.

Last night was a tough one, the charts didn't add up, if you read "thinking Out Loud" you know what my conclusion was and why I believed the gap up in the market for this a.m. would not hold and we'd move down instead. It was all based on the 8:30 release of retail sales and the 3C charts I was seeing.

This is, as I have been saying, proof positive that the government DOES routinely leak reports as does the Fed, as do companies-to Wall Street, how else could I have made that prediction last night. Actually lets call it analysis because it was based on objective charts, not a crystal ball. So YES, the Retail Sales number was leaked and that is why we saw institutional selling into the rally yesterday.

Now, we wait, be patient and see if this one does the trick. Please though, take something away from this, understand the market is nothing like we've been conditioned to believe it is. Corruption in every corner of the market is omnipresent, I just showed you the retail sales were leaked ahead of time to Wall Street. You can't play this game based on the everyday things you see in front of you-like all those who bought that run up in prices in after hours last night-they're largely burnt this a.m.

All Hedges are OFF

Retail Sales were bad enough to stop the SPY and the DIA-the Q's are still riding the INTC news, but 2/3 and consider that the markets move together... eventually. So I'm not recommending to do anything this am, not to short more, not to cover, just be patient, unless we start taking out support or resistance levels, just be patient.

Earnings season is always a wild card, and now the wild card is how much did this GDP report mean to the market, we are about to find out.

Tuesday, July 13, 2010

Thinking Out Loud

OK, I have seen this volume pattern playout before, diminishing volume on a rally with the dominant p/v relationship as the most bearish Price Up/Volume Down. In a few instances more recently it led to a reversal to the downside. In one instance back in February of this year it kicked off a monster rally, the difference is the maturity of the top, the increased volatility that started in late April and continued through May, that wasn't present back in February. Today's candle, as the last 3 candles before it, all show diminished momentum-the gain today really came in the gap on AA earnings news, the rest of the day, we didn't see strong performance. This candle taken as is would be called an evening star which is the first of two candles in a downside reversal, the next would be a close lower which serves as confirmation, why is this different then the preceding 3 that look similar? Because of the gap, that's what makes an evening star reversal candle more powerful, although the rise in price (in the gap) makes that seem counter-intuitive, several hundred years of Japanese candlestick charting show this is a higher probability reversal. However, we already know INTC came out with good earnings and it looks (as of now) like we'll see another gap up tomorrow if after hours trade is any indication, which may setup another evening star reversal. 

What will become worrisome is a strong trading day (a wide bodied candle) like the one on July 7th. The volume picked up today and breadth was strong everywhere, but we still have to take this in context, it's largely based on retail traders bidding up the market based on AA's earnings and now INTC's. The market already knew what AA would come out with, they are privy to the whisper number so it is in fact already discounted into price.

As I suspected, AA's trading was horrible today, a high volume gap that was promptly closed and a close lower then the open. It had every chance to run off that gap, it didn't. Volume was high-which suggests churning, for all the retail buyers, there were plenty of institutional sellers. The S&P-500 gained 1.54%, AA's Beta compared to the S&P is over 2, meaning you'd expect to see a move of at least 3% in AA today-not so.

This 3C v.1 30 min chart has done an excellent job historically calling the moves in AA.


Note that the last several days (with the market) AA has been rising. At the start of July there's accumulation (pos. div) and then price confirmation. This a.m., on the gap up, 3C confirmed my analysis above, distribution right off the bat, it continued down as well. Look at the volume (click on the chart for an expanded view) on the open of this 30 min chart! So is Wall Street buying into the idea that the economy is much better and AA is leading the charge? It doesn't seem like it, they just used the earnings to make money off retail traders that still don't get two things, 1) Wall Street already knows the earnings before they are revealed most of the time. If they (institutional money) were behind AA, then there would be big accumulation and they'd use that gap up to push prices, not sell into them. 2) People don't get that earnings are in the past, they don't matter anymore, only guidance and sentiment does. Based on the intraday and end of day action today, what was the sentiment on AA?

INTC?
Something is strange with INTC today. This 4C 1 hour chart shows the selloff-negative divergence from 6/15-6/21 and the accumulation 6/30-7/2 (note: because institutional money wants to accumulate at low prices, volume tends to be low-they don't want to attract attention and be forced to pay high prices so accumulation generally ocurs on light volume). 

However, from 7/8-7/13 4C makes NO progress? That's distribution and again-look at the volume at the end of day. This is a wild guess, but could they believe that the rally won't hold long enough to liquidate their position and have started selling early and into the higher prices on INTC today? It's a possibility and one that suggests they (smart money) don't have faith in the rally? Could they know something about the next companies to report and perhaps those reports will crush the market? Or maybe something else?

Compare to the SPY 1 hour 4C chart-same thing.


And the DIA? Same thing-distribution all day.... why?


Look at 3C on the Q's past on this 1 min chart, we know it's working fine, look at the distribution into the close. Even a higher high at the close is sold off.

So what could throw a lemon in the stew tomorrow? Why does it seem that strong guidance is not being bought? 

Retail Sales are announced Wednesday at 8:30 a.m. This is a biggie! Why? It accounts for 2/3 of our GDP. Paper, rock, scissors-Retail sales trumps any guidance INTC gave. Is there a possible leak from the government? I've commented just in the last few days about how not only earnings, but Federal Reserve directives and government releases have all shown evidence of having been leaked.

Looking with a quick glance and one that left me scratching my head, I was surprised to see this kind of action in these stocks and ETFs of the averages. After hours are up because retail trader's are bidding them up based on INTC guidance, but retial traders wouldn't have access to a leaked Retail Sales report, Wall Street very well may.

OK, that's enough for tonight. I've put together a possible scenario and we'll know in several hours from now.

Here's the alternative, retail sales blow away the market, we get a monster rally. Our key level on the SPY is $113-$114-at that point we likely blow the H&S top and have to start all over. My hypothesis is just that, a hypothesis so time to talk about plan “B”. 

Considering my hypothesis I'm not throwing trades out there, I did plan to throw some longs (AMPL made good progress today, I still like it long) out, but I'm holding off on that.

If retail sales are good, not average, not pretty good, but good, then we need to look at what's in the future in earnings, but also have to take action to protect portfolios. You have to do what your risk management plan dictates, but I'm looking at selling off 30% of the inverse ETF's and adding 3x leveraged UPRO (long ETF on the SPY). If the market continues to look bullish toward the close, either at the close or Thursday that will go to 50%. It's very aggressive considering a long trap can unfold in 30 minutes and I do not like the idea one bit, it seems reactionary and emotional at that, but price is king.

If what I laid out does not come to pass, then we'll also be talking about the options on the SPY and the possibility of them being pinned as we saw last month, that might call for the market to keep up some strength until next Friday, or at least above or around the highest open interest and where the volume is flowing in the option chains.

Check in the a.m., I'll have an update after the figures come out.

While You Are Waiting

I'm still putting together the pieces and looking for the little sublte signal that will tell us something worthwhile. In the mean time, as I continue to dig through all the charts and indicators, you know that I don't listen to other analysis, especially CNBC-I don't want to color objective analysis with other's opinions.

However, there's one person I respect, Don Worden, behind the Worden Brothers products-TeleChart and StockFinder. Why Don? Don pioneered tick volume and really the use of computers and indicators back in the 1950's. He's written a huge portion of the indicators that the big boys on Wall Street used and he has more experience then almost anyone else with regard to Technical Analysis. If you read his books, you will see he doesn't look at TA like anyone else, it's culture shock to red his writings because this is a man that understands the market and the importance of thinking for yourself rather then letting the talking heads tell you. Still, I rarely read his columns as I use my own indicators and I don't want to taint my objectivity.

Today my objectivity is tainted, or was. Today was a day that struck me a bit on the emotional side, I recognize that and it means that I must work 2x as hard to be objective and check and recheck all of my analysis to make sure it is objective. Emotion creeps in, you are human, but you must recognize it and that is what I'm doing. So in a bid to set my head straight as Don shoots it as straight as they come, I read his column tonight on TeleChart's nightly Worden Report, I was encouraged that he is largely of the same opinion as I am and I'm including his comments with his indicator MoneyStream which is proprietary to Worden (it's in light blue) and my 3C indicator in orange.  Don't tell Don, but I think 3C still works better and I think the chart shows that if you look closely, but MoneyStream is powerful.

Here's the chart...

Here's my 2 cents-I like 3C better as it caught the sell off in January with a negative divergence right at the top at the end of 2009-MS didn't. While both show relative negative divergences from Oct. to the 2010 Q1 high I think 3C's is more pronounced. Both indicators are below price now which means they are in the worst divergence (negative/leading).

Now here are Don's comments tonight, be sure to check back for my analysis-(moving average is not displayed)

  " I think a 3-day chart does the best job of showing the position of the market here. For one thing we have a huge, violent plunge in MoneyStream consuming Q2 of this year, while the market price itself plunges. The market does not drop to the extent MoneyStream does, and the result is a pronounced leading divergence to the downside. TSV is also in a downside leading divergence. The price has so far fallen short of the 198-day MA, and it is now in a logical position to break to the downside and test the Q2-Q3 low. Should that low not hold, we can expect another couple of hundred points on the downside. (I used a 198-day MA, because that was as close to 200 as I could come to the 3-day MA as a multiple of the 50-day MA on the daily. Suffice it to say that 198 is close enough to 200, since 200 itself has no built-in magic.) Notice that this chart depicts the dry up in volume on the bounce. -DW"