Monday, November 8, 2010

A Sleeper

Well,

I couldn't be more wrong today as I expected today to be a somewhat volatile day, it wasn't. In fact most of the day the market was range bound with a slight drift up after the gap down. 3C was just about as flat, a slight divergence here or there, but nothing to get excited about. However, as of this moment, once again the Euro is falling of a small ledge like it did last night which I believe caused the gap down this morning.

Here's what the EUR/USD chart looks like...

 This is the hourly EUR/USD chart. Note the moving averages have all made another bearish cross, the last time was late October (red box to the right).

 This 5 minute chart shows the Fed's QE2 announcement, when the FX markets opened this week and where the Euro is at vs. the dollar as of the time of this capture. Of course a lot can happen overnight.

This is another 5 min chart, just a closer look. You can see when the US equities session ended and what the Euro did after that. 

Here's the Dollar index:

 Above you can see the last time we saw a positive divergence in the Dollar Index starting around October 2009. The green arrow shows price moving down, the white arrow shows 3C moving up, this is a positive divergence and is interpreted as large institutional accumulation of the Index. Now we have a similar, if not slightly larger positive divergence in the Index.

 Here's a close up showing accumulation starting around the $81 level, of course accumulation at lower prices gives you a lower cost basis, but generally, in the past, an effective positive divergence will usually pass where it began accumulating, meaning if this is a successful divergence, I would think from past experience that the Dollar Index would rise to at least the $81 level.

This is the last positive divergence in 2009 (daily charts). You can see the first green arrow showing downside confirmation, that transitions into a positive divergence for about 3 months, similar to the amount of time our current divergence has been in effect. The long green arrows show price confirmation, meaning a healthy rally that you can expect to continue right up to the top, where we saw a negative divergence and reversal. Then, much like now, I had no idea what the catalyst to propel the dollar higher would be. Over the weekend I posted a report showing traders accumulating the dollar. They aren't called smart money for nothing, they know a lot more then we do and this is why we try to figure out what they are ding and follow in their footsteps when the trade makes sense from a risk perspective.

Here is UUP which I use as a proxy for the dollar index because I don't have intraday information on the dollar index, where as I do with UUP.

Another daily 3C chart and showing similar divergences in the same areas. The red arrow is the end of the 2009 Dollar Index rally.

Considering the second round of QE that has been mandated by the Fed, the dollar sure is acting strangely. Of course we have to discount the problems in the PIIGS countries (Portugal, Ireland, Italy Greece, and Spain)-especially Ireland and Greece. However, there's something different going on right now. Everyone in the world knew to expect $500 Billion, so really the announcement didn't come as a surprise (A surprise would have been the $2-$4 trillion some speculated we'd see), yet the world is up in arms (Here's a link from Bloomberg about the World Bank telling Asia they may need capital controls because of the Fed actions.) and it's a topic that is quite complicated, but now showing up in the mainstream press. I think you could say with some credibility that the consensus of sentiment regarding the Fed monetizing the national debt has not been a popular one. Before it was announced, I said there would be the unintended consequences that dogs Fed actions. One has been of global outrage and the preparation of retaliatory action by other nations-as I said last night, the G20 summit should be interesting. A question I have in my mind is whether QE 2 will arrive as sold. We get 3 new hawks voting on the FOMC board next year and a new congress which will put Ron Paul in a position to be a thorn in the side of the Fed-Ron Paul has long been a vocal critic of the Fed and would like to see it gradually abolished.

Many people do not know the real story of the Fed, which just celebrated the 100 year anniversary of their secret meeting on Jekyll Island that created the Fed. This is a very interesting documentary about the Fed and whether you agree or disagree with parts of it, I found it to be pretty impressive. It's a long watch, but once you get started, it'll be hard to walk away. You can find it in sections on YouTube or you can Google it and order the DVD for yourself, but if you are interested in how the system works and I mean the system-everything capital markets, politics, etc-this documentary will give you some chilling insight.

In so far as the daily SPY chart goes, it's still in a negative divergence, nothing changed today, here's the chart...


The green arrows are meant to show price, the red show negative divergences in 3C. Remember, confirmation =higher prices, higher 3C readings, so we've had a negative divergence in effect for some time, but we've seen these before, especially in 2007/2008.

So we'll see what the currency market doe overnight and I'll continue posting new trade ideas. I still like the BAC short...

Here's why. This has been in a 7+ month downtrend losing over 35% and it's stayed within the trend channel. It may very well breakout of the trend channel and end this leg of the downtrend, but the risk with a close of $12.60 and a stop around $13 is pretty reasonable and if you use risk management and do not risk more then 2% of your portfolio on the trade, then I think it's worth a look, especially as the drama continues to unfold in the banking stocks BAC certainly included.

Have a great night...

Update

Seeing some possible movement as the Euro's uptrend from late morning seems to be heading lower, the tick index also seems to be trending lower. There's a pretty negative divergence 1-min on the QQQQ.

This may be the start of some movement out of the range today.

Not Much to Report...

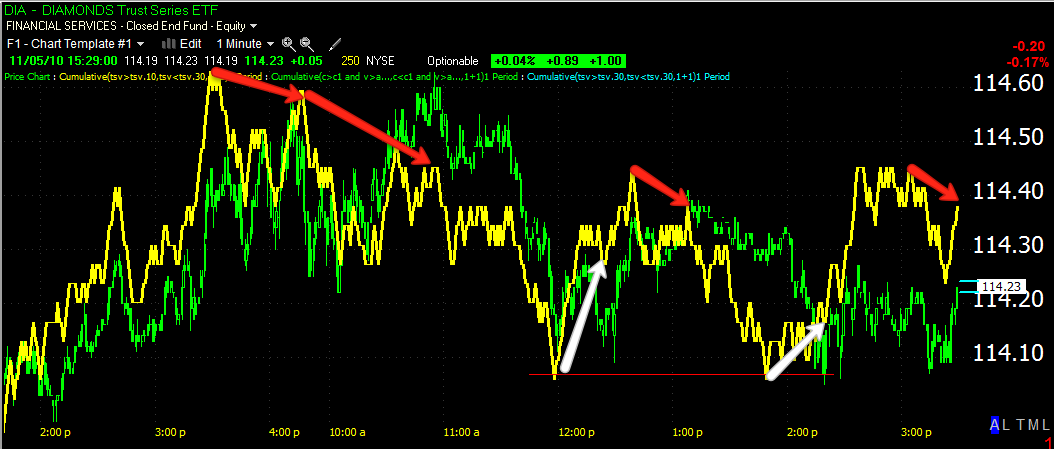
There's 1 min negative divergences in the SPY and the Q's, but not the DIA that started at 12:30 but are now pretty much in line with price.

The Euro has retraced a bit since about 11:30. XLF broke support, but is now testing it as resistance.

Until we see some movement in the Euro or XLF, I don't see an immediate catalyst to move us beyond today's range bound market.

LPX

LPX looks decent as a long, it seems to be breaking out today. Perhaps a pullback would offer a lower risk opportunity to get in.

CTCM

This looks like it's set up for a decent short sale.

If you like it, you may want to get your toes wet and add on a pullback/bounce.

Sunday, November 7, 2010

An interesting week ahead?


Quite possibly. The market on Friday took a very strong jobs report in stride, it did not bloom as some may have expected and as a result, as of now, Asian trade is mixed, unlike what we saw last week toward the end of the week.

The Fed has its last QE1 POMO of the year scheduled for tomorrow at $6.5 billion dollars. On the 10th of November, the QE2 Schedule will be released.
With 3 hawkish new voting members coming into rotation in the FOMC next year, it may be interesting to see if QE2 turns out as promised. These 3 have been vocal critics of QE and as you know, most of the developed and developing countries in the world are not happy about it... G20 Summit coming up-could be interesting.

The Euro is quite a bit lower right now against the dollar, this taken with POMO should make for a somewhat volatile day I would think. Look how much ground the dollar has gained vs. the Euro.


The market moving “Healthy Banks can pay dividends” news in my eyes is a non-issue, but one that pumped the market significantly. I'd think with the foreclosure business getting ugly, the banks are more likely to hold funds in reserve then pay dividends. I still like the BAC short, on Friday I put out a trade alert near the highs but below the Trend Chanel, making for an excellent entry as the Trend Chanel's upper band is the daily stop.


The SPY looks pretty negatively divergent on this daily chart and the market by all means looks rather extended with the last two days kind of sticking out like a soar thumb forming both a hanging man and a star-either of which are fairly common reversal patterns, but a lot can happen over night with the FX markets, right now though there seems to be a pretty clear trend of dollar strengthening.


Above you can see, compared to previous tops, the recent two day action has taken the SPY rather far through the multiple Bollinger Bands, to me it's a bit reminiscent of “channel busting” which is when you have a nice trend trading in a nice channel and you get a big upside move through the top of the channel, it often signals an overbought reversal point. However, while there's nothing wrong with getting your toes wet or entering specific trade set ups, in this case we still want to see good downside reversal confirmation.

Watch BA this week, they are delaying the release of their 787, the news was out after market Friday. 

 From the looks of the 5 min chart above and the 60 min below, it seems this news has been being sold for awhile, especially note the lateral price trend.

Although I talk about it often, I don't know if anyone actually makes it to the risk management link, so I posted the risk management article below. If you have time, it's worth a read. Risk Management is the closest you get to a "Holy Grail" in the market.

Have a Great Week!

Risk Management!!!

This is a topic that I actually was published in the Worden Report and received an honorary title and an award. It's also the "Holy Grail" that everyone is looking for-risk management is it, you can stop looking. It's also a highly personal, variable and sometimes complex subject. We deal in percentages, not dollars. So I'm going to throw out a few ideas for you to absorb and I want you to promise yourself never to enter a trade without a risk management plan in place.

1 You should always think about your potential loss before any potential gains.

2 You must be consistent in applying it and disciplined in sticking with it, one bad trade can really hurt you. One bad trade has brought down multi-Billion dollar trading firms.

3 A few things to remember

- A loss of 50% needs a gain of 100% to get back to break even.

-"When you find yourself in a hole, stop digging"

-"Only losers average down losing trades"

-Never meet a margin call with cash-sell the position

-If you lost your money in XYZ, why would you think that loser stock is going to make it back for you?

-"Money in a losing position cost more then just money, it costs opportunities"

-"If you have a trade you lost 30% on and I gave you the equivalent of what value was left in the position in cash, would you buy that same stock again right now?" If the answer is "No", then why are you still holding onto that loser?

-The market doesn't care where you bought your stock or how much you have lost, only you do. If you find yourself saying "I'll sell XYZ when it gets close to my buy price" you are doing yourself a disservice. You are holding that stock out of pure ego, because you don't want to admit you were wrong. It's like saying, "I lost this money here, I'm going to make it back here"

-NEVER DOLLAR COST AVERAGE A POSITION-You are throwing good money after bad. This is a myth that Wall Street has perpetuated so brokers can keep their clients and make more trades that cost the client more money and put money in the broker's pocket.

-Think about it, is that stock you lost so much money in really the strongest stock you could own right now to make your money back?


-If you are out of sync with the market, reduce your position size until you get back in sync with the market-this happens to all traders, we get hot and then run cold. You want to turn it up when you are hot and back down when you are cold, but human emotion wants to do the exact opposite of that-think about that.

-Drawdown is not the same as a losing position, draw down is a reality of any trend trading system and trend trading systems are where the money is to be made.

-Look at the big picture, do not chase every move in the market, it's designed that way to take your money. Instead, look at the big picture, use a 5-day chart and see if your plan still makes sense.

-If you can't take small losses, you will take large losses

Now, 
"The 2% Rule"

The idea is, you never want any one trade to cost you a loss of more then 2% of your portfolio's worth.  However there are many different interpretations of this. If you trade one stock at a time then it's this easy.

Portfolio worth=$10,000 and 2% of portfolio =$200. So your trade, if you get stopped out, should not cost you more then $200. When I'm not in sync with the market or it's a speculative trade, I will reduce my risk to 1% or even half of a percent. If I'm on a huge losing streak I'll take a month off from trading.

Now, here's the problem-diversification. Very few people trade only one stock at a time. I recommend not trading more then 6-10 stocks, depending on how large your portfolio is. Wall Street talks about diversification and generally the number they talk about is 20 stocks. Do you know why? Because the financial products that most Americans own in their 401k or IRA accounts are Mutual Funds and by law, a Mutual fund must have at least 20 stocks in it. So to sell you on mutual funds, they have to sell you on "over diversification". That's right, it's too many stocks and why? Because with good risk management you don't have to worry too much about losses, but with too many stocks, you biggest performers barely move your portfolio. A stock that gains 100%, that only represents 5% of your portfolio can only give you a 10% gain and with the inevitable losses you will have with 20 stocks, that gain will be a lot less. You need enough stocks to have good market coverage and you can do that with 8-10 stocks.

So if we have a 2% rule for 10 stocks that means we have 20% open risk all the time-it's way too much. So here's how you handle it.

I have $10,000 and I feel comfortable trading 5 stocks at a time. 2% of $10,000=$200 of risk. I divide that $200 of risk among my 5 stocks. that would mean that each stock can carry a total risk of $40. You may be thinking, "So I buy 100 shares of a stock and when I lose $40 I get out?" Wrong. Now we have to talk about Position Sizing.

When I am interested in a trade, the first thing i want to do is determine my risk. When you enter a new position it is better to have a wider stop most of the time to allow the trade some time to work. So I found XYZ for $10. I see that there is a strong support level at $9.75. We know that the market likes to take out obvious support levels to hit stops so we say I will place my stop just under that support level at $9.50. You are buying a $10 stock, and your stop is at $9.50, now you know how much risk per share you have-$.50. You already know that you can't lose more than $40 in any one position so you divide your risk $.50 into your risk per position $40 and that gives you the number of shares you can purchase which is 80 shares.

Now suppose your stop is very close on this trade, it's at $9.90 (the stock still sells for $10), your risk per share is now only $.10 and that divided into your risk per position ($40) allows you to buy 400 shares. The only problem with this scenario is 400 shares at $10 will cost $4,000 which is nearly half of your portfolio. There's one type of risk that is very difficult to deal with and that is the gap in the morning, when a stock you buy falls because of bad news over night and opens much lower. If you have nearly half of your portfolio in a stock that gaps down 20% (which happens everyday) you just lost $800. That's 20 times your proper risk amount of $40. So I always try to keep my portfolio position cost at 15% or so. This is one of the few ways you can lessen the impact of a bad gap, but still have a position that is meaningful in size. Sometimes I may take it to 20%, but I have a high tolerance for personal risk. So what do you do when you can buy 400 shares, but it's too big for your portfolio, simply buy 15% of your portfolio. In this case you can buy 150 shares of that stock.

Some people prefer to use the 7 or 8% rule, when you lose 8% of a position you exit it. If it works for the stocks you are trading that is fine, but I personally think it is not an objective rule. What if the stock you are buying has an Average Trading Range "ATR" of 7 or 8%-meaning it can swing that much intraday? You can't trade those stocks, you will be stopped out for a loss every time. so I prefer to have an objective rule, maybe a support level, maybe a moving average....

Here's my solution, it's called my Trend Channel and it is another indicator I developed and received an award for.
Here is AAPL, the Trend Channel is still long AAPL and has caught the entire trend from the Breakout in AAPL in Q1 2009 at $102 all the way to now ($259.27)-More then a double! If you have TeleChart or StockFinder I can give you this indicator, if you don't and would like to try this and 3C as well as others, click the links to TeleChart and StockFinder at the bottom of the page.

The way the Trend Channel works is to use a moving average and then to automatically,for each stock, figure out the average volatility of that stock over a certain period of time-usually 20 days. then it adds a standard deviation above and below the center of the channel. So if the stock moves more than 1 standard deviation away from it's average volatility, I know something big has changed. In a long position, the bottom of the channel's highest point is the stop. Currently the red arrow at  $237 is the stop today. In an uptrend, the Channel will lock in gains higher every day. I always stop out at the end of day closing price, that is why the green arrow did not cause a stop, because that was an intraday violation, not an end of day.

When entering a position I can look at the channel and get an idea of where my stop should be, but I consider all things when placing a stop. In a short position/downtrend, the lowest level of the upper channel is the stop at the end of the day. This system will never allow you to catch the top or bottom of a trend, but it will keep you in a strong trend with objectivity. Human emotion, fear and greed would have most people out of this trade at 20%, maybe 50% but then they become very afraid of losing their gain. This channel takes all that away and replaces it with objectivity, it knows how the stock behaves and when the stock does something out of character and crosses the channel, you know the trend is about to end.

So when choosing a stop, try to match your stop with the stocks trading habits, maybe it always holds a 50 day moving average in the past and that may be your stop or maybe it has big swings so you know you need to allow for them and by less shares. This is all part of risk management.

By the way, you decide how many stocks you want to trade and you decide how much open risk you can tolerate. Maybe it's not a 2% rule for you, maybe it's a 4% rule or a 1% rule. Maybe you only trade 3 stocks at  time, it's highly individualized, but what I gave you is the standard format. It may seem a little conservative, you can change it to fit your style, but I can tell you by experience, making money in the market is about patience, good risk management, building your wealth not try to create it in a week and most importantly, protecting it because it is a lot easier to protect your money then it is to make it.

Please, just never move your stop away from where it should be because a trade is going against you. You must be disciplined for this to work, but if you are disciplined, you won't be upset about a 30% loss in your portfolio. You will gladly take a 2% loss when a trade doesn't work out and it won't bother you. And believe it or not, you can take 10 trades, be dead wrong on 6 of them, have two of them basically do nothing and have one or two that are like AAPL and you will build wealth.

Sit down with  calculator (I could give you the answer, but find it out for yourself and it will really be exciting) and figure out how much money you can make in a year if you make 7% a month and compound it. For example-$10,000 is what you start with, you make 7% in January, it is worth $10,700, you make 7% in February and it's worth $11,449, then in March another 7%=$12,250 and keep on going for 12 months. You'll be surprised.

Saturday, November 6, 2010

Friday, November 5, 2010

Going into the weekend....

Today can't really be considered a follow through day from yesterday's move, so the possibility of the "Fed Effect" reversal is still a possibility.

As I said earlier this morning, "Should the XLF fall, then the correlation between the dollar and the market should come back into play and be the primary driver of the market."


Because there's such strong correlation with the dollar, the market is not in a great position at this moment with the dollar having gained strength, but the XLF didn't give up much ground today, even though many banks did in intraday trade-still XLF refused to budge.


XLF needs to break below the bottom arrow around $15.45 (support)


 BAC 1 min today

 GS 1 min today

JPM 1 min today.


It looks like the banks were seeing distribution today.


Here's what the currency chart-EUR/USD looks like as the Euro gave up substantial ground today.


Correlation between the Dollar and the market has been around 85%-90% so if this trend in the Euro holds, it doesn't bode well for the market.


Here are the 3C charts going into the weekend.


 The DIA 1 min sitting at support

 DIA 5 min shows distribution

 QQQQ 1 min shows a large leading negative divergence

 As does the 10 min chart-again, it appears to be distribution throughout the day.

 SPY 1 min weakened significantly from the open on a negative divergence.

The SPY 5 min is also showing a negative leading divergence in the red box. 


All in all, it looks like there was distribution throughout today's lateral price trend.


I'd expect we will see POMO front running into the close as Monday is the last POMO of QE1.


The key will be the submitted to accepted ratio at 11 a.m. 


UUP on the 60 min is showing positive divergences, while GDX is showing negative.


MELI

Here' another short trade that is shaping up-MELI


Since I'm of the opinion that conventional indicators are used against technicians, when I use them, I tend to use them in unconventional ways. For example, this MACD is set at 52/104/9 which better shows the trend without the noise and it's something that probably few if any other technicians are looking at. You can see it went up in confirmation of the trend and then went down in the H&S top pattern with a negative divergence. I think intraday it has some room to bounce a little, but when the trend line is broken to the downside, I would consider phasing into this short position. As it moves further away from the neckline and completes it's first lower low, lower high and starts down again, i would fill out the position as you then have confirmation that is pretty far out of reach of any black box manipulation. The first target is around $45, but the measured move implications often exceed the target more often then not. At that point you can re-evaluate whether you want to keep the short or use something like the stop channel to give you an objective stop out price. 

3C shows white arrow positive divergence or accumulation on this daily chart, then confirmation of the trend right up until September. Right now, I'd just be looking for the break of the neckline although some people prefer to try to get in at higher prices, I just don't think the extra few percentage points are worth the risk:reward equation.

A Few More Trades.


 PFCB is in a bear flag after a hefty decline. These are obvious black box patterns to manipulate so I would only consider this as a short when it breaks down below the bear flag, and even then I may still phase into the position in case of more head fake volatility, but ultimately it looks to me like after any black box volatility, this trade wants to go lower. MACD is negative on a very long scale-52/104/9 and the volume is correct for the price consolidation. The initial target would be around $40 at this time.

 SHZ, despite today's gains on rising volume, looks like it's pulling away from the pullback. Especially if today closes near the high, I'd think there's a very good chance of seeing a similar follow through move Monday or early next week. 3c/MACD and volume all look good on this one.

TBT is a less leveraged (2x) version of the TMV trade which is up over 4% since being featured yesterday. There are breakouts in both from their bases and look like they are bracing for a move higher. Stops depend on you risk tolerance and risk management, but under the recent pullback low would be a decent stop with room, under the breakout level at the red horizontal line is a bit tighter. Again, MACD, Volume and 3C look good on these trades and TBT's initial target would be around $38-$39.