Monday, December 20, 2010

Good Examples of False Breakouts

Earlier I posted the negative divergences that made me believe these were false breakouts, each one was breaking out above a level of some technical significance, some more then others such as the QQQQ

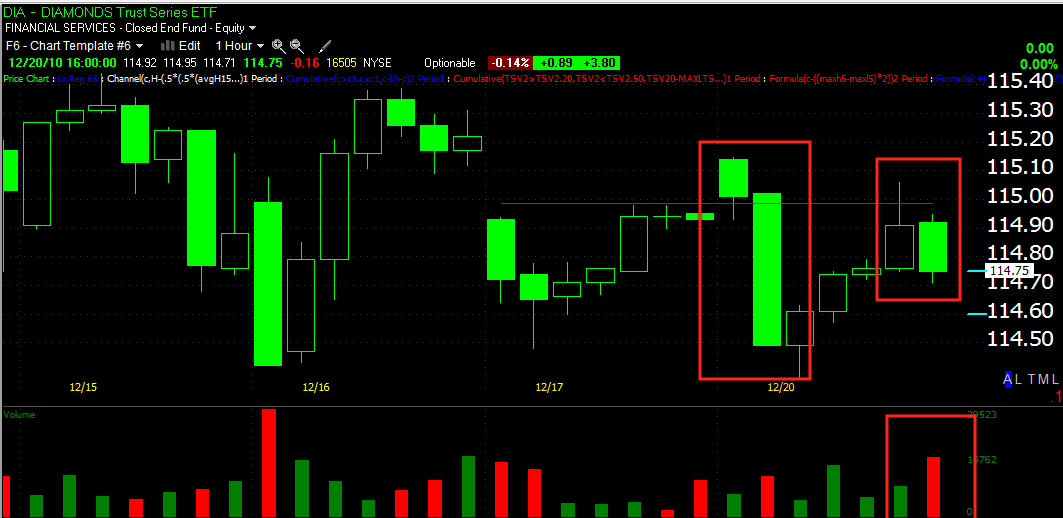
 DIA shows 2 recent examples on the hourly chart, today's is the second red box. The technical level of significance here is resistance at a gap-both failed the breakout, note today's increasing volume on the failure.

 The QQQQ's were trying for a breakout high, it also failed-again see the 3C divergences posted earlier. The second or last bar is the failure on increasing volume.


Here the SPY was trying to take out a resistance level that has held a couple of times, again the last bar on the hourly chart shows the failure on increasing volume. Given some more time, we'd  likely see a move to the downside. We still may get that tomorrow.

The SPY and DIA are trading down significantly in afterhours.
Market Update

The DIA broke support and then completed a failed test of new resistance.

Now, look at the volume

NFLX

Above, NFLX has made a recent series of lower highs/lower lows which= a downtrend. While most of the S&P 500 trades at a P/E (historically) of about 15-16, NFLX is trading at a very rich P/E valuation of 67 trailing and 46 forward. A break on a close below the red trendline will represent a lower low or downtrend. In other words, should selling take hold in NFLX, as it has the last month, this one has a long way to fall.

FAZ Entry

Continues to look good, even at the 2 p.m. ramp in the market, accumulation remained steady in FAZ and now it's approaching a breakout of the bullflag.

False Breakout Follow Up

It loks like the earlier post suggesting the 2 p.m. parabolic move up may have been a false breakout is increasingly looking that way.

 QQQQ has broken the support level I mentioned, volume is increasing on the downside as well.

The SPY has also broken support and 3C is now at the lowest levels of the day.

False Breakout?

The probability of this recent move at 2 p.m. being a false breakout looks pretty high. False breakouts tend to move the other way (down) pretty quick when they fail ( meaning below the support trendline).

 DIA 3C still negatively divergent and not confirming the move.

 Same with the QQQQ
 Here's the Q's resistance level taken out by the move up, a move below that will create a false breakout and most likely a swift move down. Note the volume did not expand on te breakout.
 SPY negative divergence
SPY false breakout? Both volume and 3C tend to lean that way. A break below (maybe you should set some alerts at the support level) could be a decent quick short trade using a leveraged ETF.

LVLT Reversal

LVLT appears to be putting in a reversal.

 LVLT 30 min positive divergence into the pullback

 LVLT 60 min positive divergence

LVLT held support at the hammer from Tuesday at $.92

FAZ Pullback/Entry

FAZ is now at a very god risk:reward area for long positions.

 FAS -long financials, showing a negative divergence.

 FAZ is in a positive 5 min divergence


Here's the daily FAZ chart, the bullflag pullback is near support, that combined with the positive divergences suggest that this pullback is about done, thus making this an ideal low risk area to be long FAZ.

Market Update

This is the first set of negative divergences in the averages

 DIA 1 min

 QQQQ 1 min

SPY 1 min

We should see a reversal intraday shortly.

SRS Update

There are some initial early signs that the pullback in SRS may have run its course. Don't forget to check out the REIT/Real Estate shorts on the trade list as well as this may be an opportunity to buy a dip.