Wednesday, January 12, 2011

SPY

This chart looks bad...

UUP/dollar Update-Request

Someone has been pretty accurately in front of this trade as you'll see in the longer term charts.

 5 min UUP showing a slight positive divergence. I wouldn't consider this a reversal signal until it makes it to the 10-15 min charts.

 The 10 min chart shows ditribution right at the second attempt at resistance yesterday.

The longer term chart, 30 minutes shows how in front of the trade they are. Accumulation 12/29-12/31 then UUP moves up, then the negative divergence I showed above between 1/10 and 1/11 and today a decline. Right now, this chart is showing confirmation, despite the 5 min chart's positive divergence. Until that divergence makes it to these longer term charts, I would not act on it.

Updates

There are still a lot of C&D trades out there, the ones that are still in play include the following and need to be paid attention to:


(symbol/ trigger date/ trigger price/ current % gain)

EMMS 1/3 @ $.84 =27.3%
BQI     1/4 @ $.44 =45.45%
OPXT  12/26/10 @ $1.73 =21.3%
EEE    12/29 @ $.61 =307%
VITA   1/5 @ $2.14 =8.4%
CPST  1/6 @ $1.05 =21%
CNXT  1/6 @ $1.73 =24.25%
CRIS   1/6 @ $2.17 =24.4%
ABCW  1/6 @ $1.36 =5.8%
JSDA   1/7 @ $1.34 =18.65%
IVAN   1/7 @ $3.07 =4.5%
WG    12/31 @ $9.63 =15.15%

I'll be out for about an hour to the doctors for a blood draw-I'm a needle phobic as well :(

If you need updates on any of these trades, send me an email


PM Update

Yesterday I covered GLD and SLV and concluded both were in simple bounces under resistance for now anyway. GLD is showing some weakness in the bounce, SLV while not moving much is not showing the same negative divergence yet.

 GLD showing  a 5 min negative divergence yesterday afternoon-prices have fallen since.

SLV, although it's gapped into a range, is still confirming, there's no divergences here right now.

While USO is not a precious metal, I thought I'd throw it in.

USO saw an accumulative period between 1/5/2011-1/07/2011. Since then price has advanced nearly 4%, however it looks like the distribution has started there so I'm not sure we'll see too much more upside on this accumulative leg up as USO approaches resistance from 1/3/2011.

Market Update

 QQQQ 1 min with a negative divergence on the open and a slight decline from there. The current negative divergence is the worst looking of the 3 averages.

 It has even shown up on the 5 minute chart, which makes sense as the Q's underperform the Dow and S&P today.

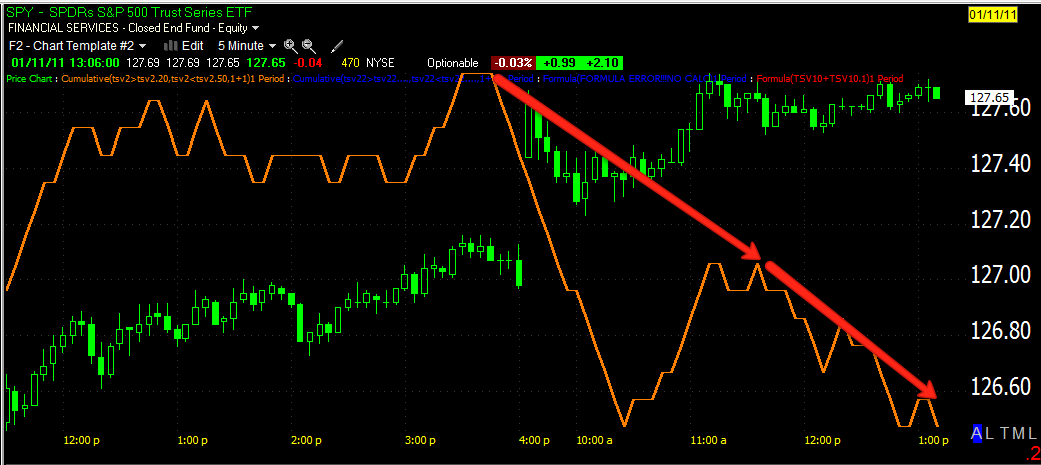
 SPY 1 min-same opening gap neg divergence and a worsening current divergence, however, on the 5 min chart below it has not shown up there yet confirming the S&P's stronger performance today.


I've looked at the earnings trades that have definite times for after the close and tomorrow before the open, as of now, I don't see any candidates.

DPTR Just Broke out for a C&D long at $.82

Morning Blend

Today is Wednesday which means as I noted last night the bond auction out of Europe from Portugal would be closely watched and could be a major catalyst, it was more like a well received draw as the 4 year notes saw an escalated yield, from 4.041% from the last auction to 5.396% today. This may reflect short term concerns as the cost of debt for the short term rose. However, mainly as a result of the European Central Bank's (ECB) bond buying all week, there was more confidence in their 10 year auction which came in lower from 6.806% to 6.716%. You might say it was a draw and not the big catalyst we expected one way or the other, but ECB talk that came out right after the auction about bond buybacks and other issues to be taken up at next week's meeting was received well by the market sending European stocks higher. Tomorrow we have the Spanish auction which will probably be the more significant of the two events.

The Mortgage Bankers Association Index showed considerable improvement over their late December 2010 releases. It came in marginally positive where previous recent releases were way down.


Although the information is from an independent Zillow, I still think the declines are underestimated. I've been talking more with homeowners here in South Florida and the amount they are underwater in this new neighborhood, is comparable to what I saw in my old neighborhood. Townhouses this time, rather then single family homes are showing the same declines at 50% or greater. 3 Neighbors in nearby neighborhoods I've talked with all paid between $175k and $185k between 2005/2006 and the selling price in the neighborhood has consistently come in at $75-$80k, well beyond the 25-30% drop that has been estimated. All are significantly underwater, one received a modification taking their payments down from $2000 a month to $1000, but that modification is going to reset in 10 months and they'll be back at an unsustainable $2,000 as the better half of the couple has lost teaching jobs 2x in the last year and a half and still can't find work. 

Also interesting was the NYSE this morning invoking rule 48-the cause? Supposedly snow, but who knows. Here's the story.


GGR just triggered a C&D long at $.91

Tuesday, January 11, 2011

Earnings Season

I have mentioned the leaked earnings plays that we've played before. It started awhile back when I noticed patterns in 3C of companies that reported and I noticed anomalies in 3C before earnings, sometime weeks, sometimes just the day before. So I decided to try it out, but not retrospectively, I posted the trades before they reported. The success rate was over 90% on about 22 trades. So as of tomorrow, I'll be looking for trades that may have anomalies or leaks before they report. In the day time I'll post the trades on the site-not the trade list, for earnings that are due out after market or the next day before market. If you have any favorites that you'd like me to look at, please feel free to email me.

Earnings plays can be short lived, many times the initial reaction is reversed within days, so much like the cats and dogs trades, if you get a market gift (a gain of double digits) be sure to lock in enough profits that the trade won't turn against you for a loss. I never believed in trading earnings before, I always want to put s many odds in my favor and earnings ca be too much of a wild card, but when we see abnormal 3C anomalies, I believe we can use that as an edge in trading earnings. Just remember this is still speculative trade activity and risk management should reflect that.

There was this story today  in which $6 billion dollars of e-mini contracts were sold, here's what it looked like at the time.


Here's what 3C looked like right before the trade went through
 Negative divergence on the  1 minute

A worse and more serious negative divergence on the 5 min. While the block was strange as it went through all at once, there does seem to have been some front running of the order as you can see in the selling occurring via 3C. That could also be short selling as there's no way to tell the difference, whatever it was, it was big enough to register all the way to the 10 minute chart.

While price recovered somewhat, the 10 min chart did not.

Always entertaining, Bloomberg's latest insider trading activity has not changed one bit, the sell side continues to dominate as the insider selling to buying ration this week is 114:1. I've said it many times and I'll say it once again for our new members, there's a lot of reasons insiders sell, but "I think my shares will be worth more in a month or two" is not one of them. I'll be taking a closer look at some of the consistent sellers and try to match up anything interesting with their earnings dates. We may find a nugget or two in there.

Tomorrows big event will be the Portuguese bond auction, this could be a catalyst to send the Euro much lower, despite China and now Japan's comments that they will support the Euro zone-which really means they'll try to keep their currencies from exploding to the upside, at least in Japan's case and the Chinese would like to help out their second biggest trading partner, completely charitable act among nations of course.  There was a lot of volatility today in the Euro, but it did manage to get back above $1.30 at present. This is not indicative of anything to me other then the typical volatility seen recently in equities, commodities, bonds and currencies as it seems HFTs and other like-minded trading firms take advantage of support/resistance psychology to pump up volume and go fishing for stops and trade triggers-basically passing the same hot potato back and forth multiple times making as much money in that tight trading range environment or more then they would on a flat out position trade. Eventually this will break one way or the other and looking at the longer trend, I'd bet it's going lower.

As for price/volume relationships, we had two that were nearly equal close up and volume down and close up and volume up, I'd give a slight edge to close up volume down, however between the two, the theme was certainly close up.  It came in at about 2:1 over close down, so this may be crating a short term overbought situation, although I'd prefer to see the dominance in one P/V relationship rather then two. In any case, if we don't see downside action tomorrow, I think Wednesday's P/V relationship will be important to monitor.

Right now Asia is trading higher in reaction to US earnings and Dow Futures are moderately higher in screen trade. If the futures hold up and we see a gap up, I'd expect a strong probability of a close lower (earnings being the wild card). It seems recently the market's MO has been exactly this, to close or at least to close lower on a gap up and to move higher off a gap down. Short term traders or those booking profits on C&D trades would do well to remember this as those extra few cents in a C&D trade can translate to several extra percentage points.

Look for the featured trades tomorrow on the earnings front, I'm only posting those that are jumping off the chart so hopefully we'll find a few for the close and maybe Thursday's before market open earnings.  It should be interesting to see if we can replicate the success we had last time, which would also be a valuable lesson in market mechanics and manipulation/insider information. It's a lot more rampant then you might think.

Market Update

This is basically what all of the averages are looking like, a negative divergence and a small bounce-accumulation at the white arrow. However, the 1 minute charts are loosing the confirmation momentum of the 2 pm bounce.