Tuesday, October 11, 2011

Market Update

This is a pretty big one.. No I didn't go off radar, I've been browsing and collecting charts.

For short term timeframes, I'm giving you a larger historical look when possible.
 DIA 1 min-the DIA and confirmed by the same signals in the Dow-30 has been one of the worst looking averages since this last rally started, you'll see why. The 1 min has been lagging for awhile, even longer then I boxed, compare to the last top in the yellow box. This is why I said last week, we have some good signs for a strong rally and in fact it was what has been expected for October, but the overbought condition has the potential of creating a very nasty snap back and this is why I wanted to see an orderly pullback last week rather then add to overbought tensions.

 The 2 min looks worse, compare to the last top and the depth chart.

 The 5 min only had a few days of inline status before going leading negative.

 I can't show as much history on the 10 min chart because of the platform, but it is leading negative/

 This is the worst looking 15 min chart and a near mirror opposite to the SPY 15 min chart.

 Even the 30 min is now getting negative

 And the 60 min is leading negative. This is not unique to the DIA, look at the Dow-30 below in the same timeframe.

 DJ-30 60 min.

 The IWM is leading negative on the 1 min-compare to the last top, this looks a lot worse.

 The 2 min is a relative negative divergence.

 The 5 min is leading negative, also compare to the last top on a relative and leading basis.

 Now the IWM 15 has fallen out of line to a leading negative.

 The 30 min is a relative negative. This what I did not want to see happen to the uptrend.

 IWM 60 min had a decent base, it's still in line.

 QQQ 1 min is not only leading negative, but hitting new lows.

 QQQ 2 min leading negative

 QQQ 5 min-same

 QQQ 10 min is close enough to leading negative

 The 15 min is leading negative, even though it has tried to stay in line within that divergence.


 QQQ 60 min is just starting to fall out of line.

 SPY 1 min has completely fallen apart the last 2 days.

 The 2 min looks horrible

 The 5 min is leading negative over the last 2-3 days.

 Only the 15 min chart, which I have said all along is by far the strongest 15 min chart we have seen in months, still looks decent.

A closer look though shows some recent deterioration.

The 30/60 min SPY are still okay.

I have more coming, chew over these for a minute.

All Of Your Gold Are Belong To Us

No, that's not my bad English, that's from a Japanese video game, if you are a web nut you probably have heard the real version.

One thing I have talked with some members about and I may have mentioned it on the site is buying gold only to have it taken away from you. Impossible? It happened right here in the U.S. one already.

I don't have time to read this entire article, but skimmed through it and thought some of you might find it worth a read.

Euro on the run again, but something interesting to note

I know zero about Slovakian politics, in the US, parties get voted out of office, we don't have coalition governments that get dissolved over disagreements. However, this seems to be the path Slovakia is headed down, the "Nays" it seems will be forced out of the coalition government to get the EFSF passed as it was in Malta last night. As I mentioned yesterday, it's a small country and susceptible to bribes and "OTHER" things, in this case, such as VOTE the way you are expected, or lose your place in the ruling coalition.

The Euro has gained some momentum from this latest development, very interesting this whole process.

Here's an interesting little divergence I picked up on.

 This is yesterday's multi year record breaking Euro rally, followed by some caution over Slovakia, and a resumption of the move upward on news of the possible dissolution of the coalition government in order to pass the EFSF.

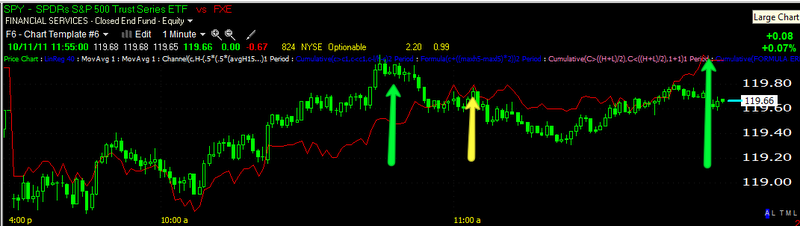
 Here's a closer look since the market opened at 9:30 EDT today.

Here's the SPY is in green, the Euro in red (click on the chart for a larger view). First both the SPY and Euro make new highs, then the Euro makes another new high (yellow), but the SPY fails to follow, both pullback and the Euro makes a brand new high, the SPY is lagging considerably.

The market and the Euro are like two peas in a pod, the track each other pretty well usually, thus I found this to be of slight interest.

Does Slovakia Even Matter?

No, according to some market strategists:


Slovakia is not key in determining the fate of Europe as the European Union will likely carry on with the EFSF regardless of Slovakia's vote, wrote David Ader, market strategist with CRT Capital Group, in a research note. Ader added that he expects "more dire outcomes," including deeper haircuts and more bailouts of banks, before the EFSF is expanded. "The whole thing is one of fits and starts," he said.


GLD Update

Over 2 weeks ago when GLD first touched its long term 150 day moving average, I warned that because of the way it got there (dropping fast) and from looking at past experiences at that level, which historically have been excellent buying spots, that I would prefer to see GLD consolidate along the moving average and make sure it holds the average for several weeks, thus far that is what has happened.

 GLD 10 min negative divergence yesterday (it was in line the day before) seems to have sent GLD lower today.

 The 15 min negative divergence also seems to suggest more consolidation ahead.

 As does the 30 min chart.

 The 60 min chart looks pretty much like I would expect a 2+ week consolidation to look, it's more or less very close to inline. I'm not going to speculate on intraday movements as I don't see them as important with GLD right now.

Here's the long term 150 day m.a. and as you can see GLD is a bit extended from it. Given the charts above and where GLD is on the chart above, a move toward the 150 day moving average seems to be the highest probability in my opinion. The fact that the 60 min hart has not broken down, thus far is a positive development for the consolidation.

SLV Update

 SLV 5 min slightly negative

 SLV 10 min has already had 1 negative divergence send it lower, it is still lagging

 The 15 min chart however, from a longer term perspective is leading positive, with a relative negative divergence. The bigger picture is the leading positive divergence.

 Here's a closer view of the 15 min chart. I would be on the look out for some consolidation/pullback, however at this point it seems like it would be a healthy consolidation.

 The 30 min chart is also leading positive, with a slight relative negative divergence. Again, the more important signal is the leading positive as it seems SLV is building up strength in a long timeframe.

The 60 min also shows a fairly substantial looking base in SLv, this is the sort of base I was suggesting to be on the lookout for in UNG in the previous post.

All in all, SLV looks like it is bracing itself in the area for a stronger move up.

UNG Update

 UNG 10 min leading positive

 UNG 30 min leading positive

UNG 60 min leading positive

The 1, 5, and 15 min charts are about in line so there wasn't much to see there. If you are long here, I would still keep open the possibility of further basing in the $8.50 area, but UNG seems to be progressing well.

The Slovakian Parliamentary Vote

Here's a link to a live blog, it is translated and a little difficult to understand, but nonetheless, it is the most important business of the day so here's a link to take a look for yourself.

3C Extended Hours/Futures Market

Today is probably not the best day to run experiment with 3C and these additional markets being the Slovakian Parliament is discussing the EFSF vote right now, but my observations from the first complete round of extended hours from after-market to premarket thus far and my observations of ES futures, lead me to believe that there will be weakness in the market as it appears there was weakness in both of those new markets for 3C.

We'll see soon enough, but this is not a 1-day trial, this is another learning curve, but one that is pulling back more curtains on Wall Street.

A New Tool In Our Arsenal?

This may be one of the most exciting developments in a long time for 3C and proprietary indicators. One of our members who has contributed enormously to this site and I are collaborating on some early tests and experiments using 3C in not only the extended hours markets, but in the round the clock futures market as well. As I have said many times, 3C has a long learning curve and this new environment will probably have somewhat of an extended learning curve as well as volume in extended hours trading is much thinner and the futures market is something altogether different. However, this may give us insight, especially in the futures market, that shows us a whole other side of Wall Street. Manipulation of each of these markets can be extreme so, the longer timeframes seem to be the best bet as they reveal more of the trend and less of the manipulations of these markets.

So far tonight futures, unlike last night, are down across the board, but only by a small amount (about .25%), which may be a holding pattern waiting for the Slovakian decision. However there are some interesting longer term signals as well. I'll start publishing these charts when a few scaling kinks are worked out and we get a feel for these markets.

As mentioned, after-hours held pretty steady, futures are pretty steady, with a slight negative bias, the Euro is literally unchanged 9 hours after the close of trade after a 350 pip rally, the largest gain since March of 2009. The market is clearly in a holding pattern awaiting news from Slovakia.

However, the charts below saw some large scale damage today, much of it as the day progressed and toward the last hour.

 DIA 5 min

 DIA 10 min

 DIA 15 min

 DIA 60 min

 IWM 15 min

 IWM 30 min

 QQQ 5 min

 QQQ 10 min

 QQQ 15 min

 QQQ 30 min

 SPY 1 min

 SPY 2 min

SPY 5 min

There's going to be a short squeeze and Slovakia is likely to determine whether it is in the market or the Euro.