Thursday, November 3, 2011

Market Update

I wouldn't call today's action (at least not how it started) as a coordinated effort to fill some gaps, but I would say that the environment was favorable to do so and I wouldn't be surprised to hear market makers and specialists were pushing the b/a higher in order to achieve that goal while they had the opportunity.

Remember what I said about bear flags earlier and our expectations about how they will behave contrary to popular technical analysis dogma.

 DIA bear flag fills 1 gap, the other "should be left unfilled" however the rumor mill/news cycle could produce the same opportunity as today, although it's been very quiet compared to this a.m.

 DIA 1 min -the underlying technicals suggest that this has been an uphill battle and that it is near the end. The last hour of trade should be interesting, especially if the rumor mill stays quiet.

DIA 5 min-you do se how the bear flag was broken to the upside as mentioned earlier and now the negative divergence on that for reasons I explained earlier.

 IWM gaps and break out from the bear flag which according to technical analysis dogma, is not supposed to happen, everything in the books on bear flags shows a clean break down from a bear flag.

 IWM 1 min is leading negative

 as is the 5 min

 QQQ bear flag and gaps

 QQQ 1 min

 QQQ 5 min

 SPY gaps and bear flag

 SPY 1 min -it is worth mentioning a lot of inline trade until the bear flags were broken.

SPY 5 min.

And finally ES keeps making lower lows/lower highs in 3C and is now deep leading negative.

TICK Update

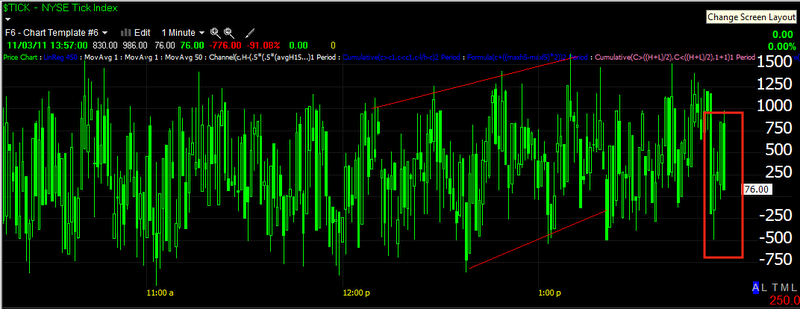
The NYSE TIK chart continues to break out of the channel as the SPY seems to have found some resistance.
 Perhaps a little churning here too, higher highs/higher lows have definitely stopped.

And the TICK chart is breaking the channel, threatening a new channel to the downside. It's also turned negative under the Zero line.

ES just keeps getting worse

Why is ES important, because it's the really big boys playground.

The earlier positive divergence was formerly the biggest of the day, now the negative divergence is and it keeps getting worse, making new lows-it is leading negative very sharply.


Quick Look at some financials

Where there's smoke, there's fire.

Why I have been collecting the charts for this post I see the market just ripped higher, not sure what's driving that, but I'm not too concerned about it right now, looking at the NYSE TICK below.


 It looks like the uptrend channel is just starting to break.

The financial sector continues to underperform in the sector rotation map. In Europe, Credit and especially financial underperformed broad based risk assets/equities and actually the equities market out performed the broad based risk basket. Credit generally leads the market, the only time when that correlation fell apart was during the EUR repatriation during the last rally. Credit is warning.

 I didn't go through every financial chart, but enough to see the same pattern generally. Here's a 15 min C chart which created an island top and currently a bear flag. Traditional Technical Analysis will look to short the bear flag, traditional Wall Street tactics will typically break the bear flag to the upside first, driving those shorts out before the market falls a the bear flag suggests. That may be part of the rip higher that started as I was preparing this post. Oh and  is leading negative in the bear flag area as well as negative at the island top.


 Here's a 15 min chart of GS with the same island top and essentially a poorly formed bear flag-check volume around this time.

 GS 15 min was in line pretty well until that island top on a somewhat parabolic rally, 3C went leading negative right there and GS fell the next day, currently the bear flag is leading negative.


 JPM's daily chart, this is an important and large top, doing exactly what tops do, breaking down and then a head fake move above the neckline of the top with a failure, that sucks longs in and helps propel the downside with a snowball effect as the longs that bought the neckline breakout are at a loss and every day JPM moves lower, more and more will sell, creating more supply then demand and putting downward pressure on prices. I think this is one of the most important and illustrative charts for financials.

 JPM's island top and bear flag.

 JPM 15 min 3C was in line very nicely for most of the rally and went negative right at the island top, of course like the others, the next day it fell and created a bear flag which is leading negative divergent-a pattern seen over and over.

 WFC had poor relative performance in the rally, unable to make a new high with the market, in white there's another bear flag.

 WFC 15 min shows why it performed so poorly with a relative negative divergence at reistance where it should have been making a new high.

Here's the 1 min 3C chart of WFC suggesting the rip higher will not last much longer.

In fact, I just looked at the hart since these posts take some time to put together, here's WFC 1 min-note the volume.
A little resistance and a whole lot of churning, which is never good in the case of a rally.

SPY Update

SPY over resistance on decreasing volume

 SPY  1 min

 SPY 5 min-both went leading negative about the time the SPY hit the intraday highs/gap level

The hourly Bollinger Band also would suggest a move back toward the bottom band.

PEIX-A Cats and Dogs Trade

PEIX was one we use to follow a lot bak when the C&D trades were popping like popcorn. This current move is very hard to buy, but PEIX (as a speculative trade because of price) should absolutely be put on a watchlist for a pullback entry, it looks like it has a LOT of upside left, in fact it looks like it has only just started.

 PEIX is a mature version of UNG, all the same dynamics are in play in both. Look at the recent volume, that is not smart money investing, that is smart money telling the technical traders that PEIX is in play as the stock moves from stage 1 accumulation to stage 2 mark up and the best way to make that advertisement has always been to send a Technial trader's "Volume Surge Scan" in to overdrive as they still believe this is smart money buying.


 Like URRE and currently UNG, the accumulation started month ago, it isn't easy to move a daily chart in to a leading positive divergence, contradicting price, without a lot of accumulation.

 Here's the rough daily range, much like UNG now, except a bit more mature. The volume spikes aren't hard to create for a skilled market maker, especially in a cheap stock like this-these huge green bars are an advertisement to Technical Traders.


As you can see my crossover screen gave a false crossover which was not confirmed at the red arrows, a more recent one was confirmed at the white arrows. The yellow 10-day moving average will move up pretty fast, but that is where the first pullback should occur and that's where PEIX is worth a look as a long trade. The price pattern implied target is $8.00 so a speculative buy around the 10-day moving average looks pretty good.

No Changes in ES

When I first showed you 3C on ES I warned there would be a learning curve, but I quickly realized that the 1 min hart at least, has been very reliable.

Here's the current ES
The run up premarket saw a negative divergence sending ES lower in to the a.m. lows, there was a positive divergence at those lows (not marked) and since a long running negative divergence that is now leading negative, I would expect the ES (S&P E-Mini Futures Contracts) to lead the market and continue with the high degree of accuracy that they have shown.

What the Failure f MF Global Means for Jefferies and other financial institutions

Just like Bear Stearns and Lehman Brothers, once there is blood in the water, Wall Street feeds on it's own in the quest for profits. It doesn't matter that Corzine was a governor or Goldman Alumni or one of Wall Street's biggest supporters of the current administration, blood in the water rarely has a happy ending and to that extent, Jefferies is bleeding in the water.

The price action over this year has shown there to be a problem, the price action the last week has shown that they are 90% likely to be the next failure, but what is truly disturbing is that the shocks from Europe or the ripples as we have yet to see the Tsunami, are already reaching our shores. Potentially 2 of our largest financial institutions in one week, that's faster then 2008, except at the end game of Lehman when everything was about ready to collapse. However, we, the general public never understood how dire things REALLY were until years later. It makes one wonder how dire things are RIGHT NOW?

Egan Jones was the first and as far as I know, the only timely downgrade of MF Global while all last week CNBC paraded pundit after pundit talking about how the 200 year old firm will be fine, many of the same said the same of Lehman just days before their collapse.

Jefferies has the equivalent of 77% of shareholder (or did ) tied up in sovereign debt, just like MF Global (albeit MF was a larger scale). As Jefferies price falls and margin calls come in, they must be met or they can't do business. MF Global went the route of illegally using customers money, to the tune of up to $1.5 billion dollars, and nearly $700 billion of customers funds is still unaccounted for.

This creates a crisis of confidence, just like the Lehman era, no one in the Financial sector knew what their counter party risk was and every financial company lied about their own risk, only to write down more and more every quarter.

It's like a bank run, but right now it's hitting the medium size Brokers. It's still up in the air as to whether the MF Global customers (who's finds were supposed to be insured against this kind of loss) will actually be protected because of the illegal things that happened at MF Global. This makes the crisis of confidence even worse and we may not know it, but there could be a liquidity run on all the brokers right now-even CME/ICE.

The main point I think is the pace of acceleration, many thought the US would not be impacted unless the EU went in to recession or saw defaults on the sovereign  level, it's happening a lot sooner and a lot faster.

Remember as always, keep your eye on the trend, not just the day to day or the intraday action, the trend is more likely to tell you what is really going on then anything else you have available at your disposal.


USO Update

 Once again USO is running in front of one of the only true FX arbitrages based on the real fundamental value of the dollar as crude trades the world over in $USD. Today it is running quite far ahead of the Euro and in the past, the Euro has been the leading indicator for the direction of crude, suggesting USO should see downside from here.

 On an intraday basis the same thing happened earlier around 11:30 as USO ran in front of the Euro, the Euro failed to make a similar new high and now USO has turned down from that high, it''s the same situation on a macro and micro basis. The macro outcome should be the same (see above).

 The 1 min 3C chart is leading sharply negative, especially since the 11:30 high was hit and crude diverged with the $USD.


 The 1 min chart has leaked, as it should, to the next timeframe, the 2 min and it is showing the same characteristics.

 The 2 min is leaking to the 5 min now and it has started leading negative.

On the 15 min chart, the range/top (likely) in crude/USO is seeing a continued negative divergence lower.

Nothing has changed on the 30/60 min charts which are very negative.

Financials

I went looking at Financials expecting to find trouble and did.

 Another simple attempt to fill the gap, like I mentioned several times, if the middle men were caught on Monday with long inventory at Friday's levels, they'll try to fill the gap as much as they can. XLF... Almost, but still leaves a sort of Island top.


 Here's today's action almost filling the gap. Note recent volume.

 Recent volume and recent 3C makes sense. 1 min

 XLF 2 min

The MF Global event and it looks a lot like Jefferies is next, Wall Street smalls blood in the water, could very well be precipitating that Lehman 2008 environment I've mentioned so many times this week. One moment they are here, a week or so of rumors float, the stock crashes and before you know it they are gone.

I really didn't expect Europe to hit the US financial system this fast.