Wednesday, November 16, 2011

Decent move to try to fill the gap

The IWM even succeeded.

 It looks like the party is running out of steam.

 The SPY managed to make 1 more higher high then the Euro on a triangle that now looks a lot more like a bearish descending triangle.

And the Tick chart just broke the channel


Quick Market Update

It's still early and you know how I feel about early trade, but yesterday I pointed out in multiple posts how the market had come completely unravelled from any correlation, it was very strange and that wasn't even counting the 3C charts, today the open seems to have given us our answer. As I said yesterday, "Market action unfolds with the intent to deceive" and momo chasers which is about the extent of the trade late yesterday, got burned bad on the open, if it is too strange to be true, it probably is.

There are a ton of fundamental issues that have arisen today and once again, Sunday's post, if you still haven't read it, has pretty much been as timely as it gets as to events unfolding this week.

 The SPY-FEAR IS STRONGER THEN GREED. The SPY on the open, retraced all the way to yesterday's intraday lows, taking  out nearly 4.5 hours of parabolic rally on the open.

 As usual, we start the day with a triangle, that looks to be in the midst of being gamed right now.

 Unlike yesterday, today the market is in line with FX correlations, thus the rally out of the triangle happening now as the same pattern was present in EUR/USD FX pair.

 Here's the wider view of the disconnect between the market and FX arbitrage correlations, I pointed out a day or two ago what happened last time the market ran ahead of the correlation which can be seen in the red box to the left, a severe drop the next day and regression to the mean. The market is much further out of sync now, even with the opening gap down.


 The early indications were of confirmation of the drop, you can see clearly 3C falling apart during yesterday's rally, but that was by far the least strange of events yesterday.

 Here on the 5 min chart, it's still early but we have a negative divergence and the start of a move in the right direction. In white is the last time the market broke north of the FX correlation and the parabolic trade as well as the negative divergence and huge drop the next day.

 It's too early to expect a 30 min chart to move yet as we only have 3 data points as of 11 a.m., but the longer term view is in place and leading negative.

 The DIA's confirmation this morning as well as yesterday's very bad negative divergence.


 More confirmation.

The Q's also went very negative yesterday during the run up from intraday lows and here we see confirmation and as the last capture, a small positive divergence that had formed that led to the current move above the a.m. triangle.

DOE / EIA Report

Here it is


Released on 11/16/2011 10:30:00 AM For wk11/11, 2011
PriorActual
Crude oil inventories (weekly change)-1.4 M barrels-1.1 M barrels
Gasoline (weekly change)-2.1 M barrels1.0 M barrels
Distillates (weekly change)-6.0 M barrels-2.1 M barrels


Here's the initial move in USO at 10:30, there are some other developments just breaking, I'll bring them to you momentarily.


USO and DOE Report @ 10:30 a.m.

We will get to the market, which I showed you yesterday, was acting beyond strange and we will get to a
VERY timely post late last night that proves GS is now so intertwined in Italian and EU politics, that they seem to (95% chance) be trading on inside information in the Dark Pools.

First USO which in itself has been extremely strange. The DOE leak is one we have traded successfully many times using 3C

 First USO normally trades with the Euro, a strong Euro= a weak dollar=higher energy prices to compensate as oil is traded exclusively in $USD. Here the recent divergence between the correlation, take notice of the location. As to why, it could be the Fed is printing devaluing the dollar, it could be Iran/Israel or it could just be a total head fake set up, but take note of WHEN the change occurred.

 USO should trade the opposite of the dollar index in  red, note it has recently trade exactly with it, red flag, take note of the time it started.

 USO is in a very bearish ascending wedge, the head fake would be an upside breakout, that happened today.

 The 1 min 3C chart ZERO confirmation, just the opposite.

 Same with the 2 min chart.

 Same with the 5 min chart.

 The 10 min chart starts to reveal when the divergence started, about the same time the FX correlation reversed 180 degrees.

 The 15 min chart shows the exact same, it was ontrack with a proper divergence as the Euro turned down, but then the correlation to FX broke, 3C was right here and predicted what USO should have done based on the break in the Euro.

 The 30 min chart shows the same timeframe when everything was turned upside down.

 And the 60 min chart has had weeks to get in line, it hasn't

 Here's SCO the Crude short, with a positive divergence this am

 An even longer 5 min positive

And a 30 min positive based on the same timeframe as the broken USO correlation, PAY ATTENTION to the 10:30 release and trade shortly thereafter.


The Forest and the Trees

Or Perhaps the Forest and the weeds after days like today, if you saw my late day posts, you saw how disconnected the market was from everything around it, as I have recently mentioned...RED FLAG!

As we all know, Europe opens in a couple of hours and it's like a box of chocolates...

However, we do have Spanish and the bellwether French bond auctions so there's certainly some reason to believe that what we are seeing overnight has a good chance of sticking at least to a fair degree.

Overnight futures are blood red with few exceptions...

US Futures are at the top and range from -.83% to -1.45%, of course I'll always respect the fact that many things can change between now and 9:30, but it's not looking good.

I mentioned many strange things in the market today and not just to take up space on the site, something wasn't "normal", we'll see how it plays out tomorrow, but as of now, the momentum crowd is probably saying a lot of prayers tonight or just glued to every tick in the futures.

Looking at FX, EUR/USD, there are some interesting developments both short and longer term.

 First, Monday night I recall a bounce in the Euro and said it was a counter trend bounce as the trend has been down since the Sunday night open, now I can't even find that area that was a bounce as the trend looks solidly down-which has a negative implication for the market, which totally bucked the legacy correlations so I almost want to say, the market owes us some significant downside just to revert to the mean.

 EUR/USD broke Goldman's $1.35 stop, I can't imagine why client's stay with them because even if GS is trading against their client and sends the EUR higher by buying at the sub $1.35 level, their client WERE stopped out of the long trade they recommend just this week, AT A LOSS and in FX land, 1 pip can mean a lot on that kind of leverage.

 Here is $1.35 and the last few stops just below that level being hit as the Euro plunges right through $1.35 in a matter of minutes, Goldman's call for their clients is a disaster and it only took a day or two.

Sine the mega rally of early October seen here, EUR gained 1100 pips! Huge move! However it has retraced over 800 of those pips and is now in the vicinity of retracing 75% of the rally.

As to what the market owes to mean reversion, it's time for an S%P margin call.
 The S&P has retraced as much as 1/3 of the rally, but currently stands at less then a 25% retracement, so will the market collect on that reversion?

Every major top I have studied over the last century, as I have shown you, all had this in common, an ever so slight turn down of the 200 day moving average, it may be a little difficult to make out, but it is there and not very different then the historical norm, which would suggest that the market needs to ante up.

 All of those historical tops also had 3C in common, calling everyone, but this one compared to how close price is to 2008 and how far away 3c is, looks to be one of the worst and it's not a fluke that 3C called the 2007/2008 top as well as the 2003 and 2009 bottom as well as all of the other major tops over the last century on this timeframe, so if it s wrong here, it's going to be a first for the last 100 years.


 As for ES, if you were an ES trader buying a single contract at 50X the S&P's price and chased the momentum rally today, again on minuscule volume, you aren't very happy right now as ES has broken BELOW today' regular trading hours intraday lows.

 It seems from my study of 3C on ES that a 1 min timeframe is more like a 5 or 10 min timeframe on the SPY, so an hourly timeframe is more like a daily and a 4 hour is more like a multi-day except more responsive. Here's the 1 hour 3C on ES showing a very nasty leading negative divergence currently.

Here's the 4 hour 3C hart on ES from the July crash which it nailed as well as what I believe to be the recent top of the October rally and again, a leading negative divergence currently.

I find it hard to believe that so many long term charts that have had such a great track record are some how being fooled this time.

Finally I read something interesting that I didn't know tonight. Italy has massive debt to GDP, that's known, but France was supposed to look much better, however investor are taking out their bearish views of French debt as it is a fair and square corner in the market where few are left, being that France, at least until it cries "uncle" is not eligible for secondary bond market support from the ECB, making one of the only remaining bastions of TRUE price discovery and market sentiment, although if the ECB really wants to, they can figure out a secret roundabout way of supporting French debt even though they have failed to prevent an Italian blowout above 7% when they intervened in the secondary market dozens of times and apparently directly-counter to their laws- in the primary market at least twice.

So here's what I didn't know...

By Public debt measures, France doesn't look too bad...
 At 82% of GDP, they look a lot better then Italy at 119% of GDP and the debt load as of 2010 was at 2+trillion $USD.


However through in external debt such as that carried by their banks and the situation looks much different, their debt load is all of the sudden more then double that of Italy's at an astounding  4.7 trillion dollars while Italy is around 2.2 trillion, I'm too tired to do the revised debt to GDP, but it's a lot more then Italy's 119% making France the ultimate TBTF and with yields moving up EVERY SINGLE DAY. This could partially explain why they were o up in arms about the S&P downgrade rumor that is being blamed at last I heard, on a hacker attack! LOL!!!

Should they loose their AAa rating and all of the sudden be locked out of debt markets and see the dreaded 7% vortex, it is "GAME OVER MAN!, GAME OVER!"

All of the sudden, Germany's rush to reformulate the EU membership and as Wikileaks described in a government cable released a little over a week ago, ultimately extract itself from the EU altogether, makes perfect sense, it's a matter of self-preservation-the Union be damned!

And interestingly, the SEC has made its first foray into the cold waters of enforcement in dark pool trading markets as they went after a small fry, called "Pipeline", it remains to be seen if they go after Goldman's Grand-Daddy of the Dark Pool, Sigma X ?

However, these trades that are essentially, scratch that-literally- a "SECRET" which only appear on the consolidated tape, meaning no one knows who actually bought what, at what price, at what time , in what size and from whom, except the companies like Pipeline and Sigma X; the former was charged with front running their own customers, but they (the customers) would never know because they aren't called "DARK" for no reason.This is the antithesis of free, fair and open markets and why the SEC has waited this long to look in to them, can only be summarized as "Wall Street campaign contributions".

In any case, the big secret of who is trading what in huge size without moving the market, is interesting if we look at today's action. Note just who was being sold.


Figure out what countries each of these companies hail from and you'll get an idea of how bad the Euro Crisis really is and how seriously it is being taken by Wall Street. There are a few in there that you'd expect like UniCredit, there are a few surprises in there that would suggest contagion may not stop at France, but engulf the entirety of the EU area as well as making its way across the English Channel.


Tuesday, November 15, 2011

EU BANKS RE-CAP WITH A SHELL GAME

There is no end to the bad judgement of the EU and regulators, in this following article, basically the banks which have come under increasing scrutiny here in the US for marking level 1 assets (those with a market value) to level 2 assets (those that derive their value from the bank's internal models). This is an accounting gimmick to make underperforming assets look better then their market prices by marking them to an even better looking model and investors in the US have picked up on it in recent financial company earnings and those companies have been seeing some downside as a result.

In the EU, as we have talked about many times, banks must raise their core capital ratios in preparation for a meltdown, we have talked about why they don't want to do it, how they have sold all asset in a bid to not have to issue shares and now they are engaging in the same shell games that US banks have been using, by revaluing assets through models to make their core capital ratios look better. The end result is they may "look" better, but ZERO has changed and they are just as dangerous or even more dangerous as a result.

Here's the article

It's just another sloppy European wall paper job to try to cover an ugly reality that is ever increasingly becoming more unmanageable as reality sets in, THERE ARE NO QUICK FIXES, THERE ARE NO FIXES THAT WON'T INVOLVE A LOT OF PAIN, but that hasn't stopped the EU from engaging in these meaningless charades to try to prop up the EU for another day.

It became all too clear when the EU took a multi-year problem and found a quick fix in 4 days (something that had eluded them for years until the G20 gave them an ultimatum) and they called it "leveraging the EFSF" to over $1 trillion dollars, unfortunately for them, everyone sees through this garbage and that is why they have had a difficult time credibly raising even $3 billion Euros of the 1 trillion Euros needed.

I think one of their main problems can be found in their advisors, the same group of US Investment banks that started this entire problem through sub-prime in the US.

It's absolutely petrifying to think of the global ramifications as they move forward or backwards as the case may be.

Now ES/EUR Correlations reverse bearishly

 After the close (red) the EUR got a bounce, which should have lifted ES in AH.

 The ES 3C negative leading divergence

The red arrow is 4 p.m., instead of following the EUR higher, ES lost ground and then went flat. There's 30 minutes of missing data at the end of the chart so I'm not sure whether ES follower EUR down since 5 p.m.

Market Action Unfolds with the Intent to Deceive...

Too good to be true? The plain simple fact was that most people simply watched the S&P, Dow or NASDAQ and their moving averages and didn't bother to look any further in to the situation and simply assumed, "It's rally time".

Even a cursory glance at a few simple indications revealed major inconsistencies and likely major problems with the latest sugar high.

When the EU breaks good news and the US markets respond better then the EU itself, you must have a hint that something is not right.


Here we are as of the close and in to AH...

 DIA 3C chart refused to relent on a worsening leading negative divergence the higher the DIA went, someone was selling lots of shares and shares short.

 The amateurs trade the open, the pros trade the close, that doesn't speak well for the DIA-checkvollume and the extent of the snowball effect, I'll have to check if a technical buy level was hit that caused the snowball in to the EOD.

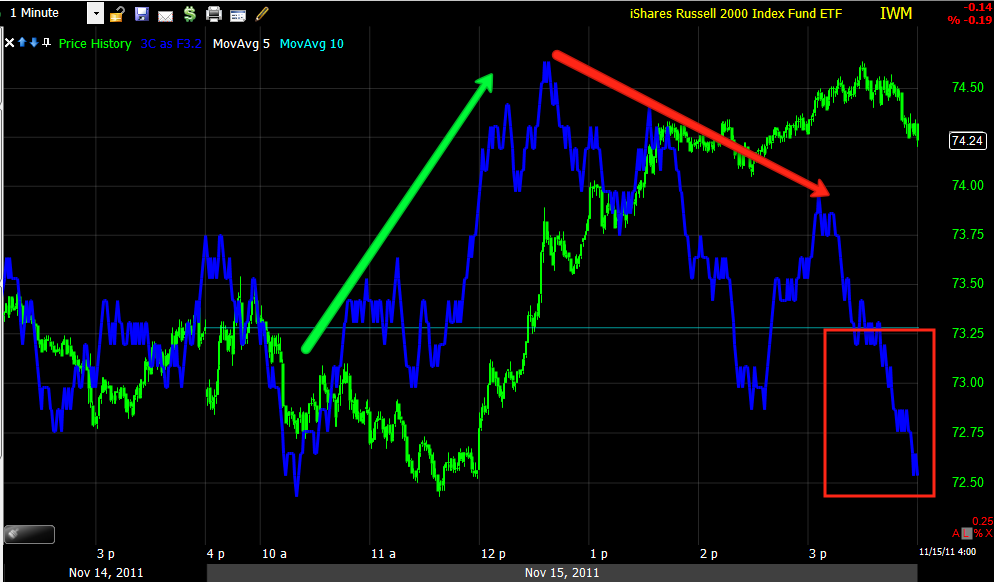
 IWM nearly hitting new leading lows on the day as price hit new highs, that's a divergence anyone can see means trouble.

 And the IWM into the close-the blue hash marks to the left of price is the AH bid / ask so the carnage continues in to AH trade.

 The QQQ in a leading negative divergence and making consecutive new lows-RED FLAG


 THE Q'S retraced 1.5 hours of parabolic rally in 15 mins or so... FEAR IS STRONGER THEN GREED.

 The SPY held out the longest on 3C, but ultimately the locals sold hard.

 And look at that retracement, more then 2 hours of already parabolic rally reversed in 15 mnutes on heavy volume and it's still selling off in AH

 TLT, the safety haven trade saw buying on volume and is even higher in AH.

 As for ES, it happened fast, but when it happened, it went leading negative .

Here's the 4 p.m. close in red, ES continues to sell off and the volume thus far in AH, is bigger then the average volume through the day.

I had a feeling something was stinking.