Thursday, January 5, 2012

Thursday was the day

As early as last week, we kind of new Thursday would be problematic in Europe. It turns out the main problem we were looking to saw some other problems pop up first.

Again Unicredit was destroyed in trading thus far today, even  halted 4 times thus far and down 15% on the day! Several notable big EU banks were down 5%+ including DB. As predicted weeks ago, the Euro will trade under $1.30, it did one better and broke $1.2850 which hasn't been seen since September... of 2010!

Yesterday  mentioned that financial credit was acting bad, today the stocks-CREDIT LEADS EQUITIES!

Italian BTP's are over the red line 7% yield or red flag, once again today. Nearly all sovereign debt is approaching the widest spreads seen in some time.

Now for the French Auction...

The French auction missed their total allotment of debt, the worst internal seems to be the bid to cover which hit Oct. 2010 lows, the BTC is the amount of bids received vs. those accepted.

It's not the news, it's the reaction to the news! And on that note, the Euro moved to new lows after the French auction (currently $1.2803).

Hungary had an auction today of 1 year bills, several weeks after a totally failed 3 year auction. The rate? 9.96% on 1 year paper! Hungary is moving closer to all out default and they will drag Austria down with them. More on Hungary in another post as I have a sold connection and even speak some Hungarian.

In the US Initial Claims came in below consensus, of course t took the seasonal adjustment to make that happen and as usual, they WILL be revised higher.

As an aside, the Euro has traded below $1.28 while I've been writing this!

Wednesday, January 4, 2012

ES best sums up the day

ES was the best representation of the market today, we started with some weakness, saw an early morning positive divergence and as prices went higher in to the afternoon on seasonally light volume, 3C showed a significant negative divergence. My gut feel is this is a set up moving in to the French Auction which will occur while most of us are asleep.

Does this chart look familiar?
A triangle and a breakout? This is the Dow Jones Copper index (JJC) and if you said it looks like FCX, you were right, except it is rolled back one day.

As for today, here's FCX vs. JJC
As for the case I made about FCX being in a head fake breakout and likely a decent short sale candidate, compare it to JJC's performance today, the copper industry as a whole broke down today for a loss of nearly 3%, which means FCX is likely a head fake and the price action today was used for the exact reason 3C suggested, to sell in to strength before a reversal. So all of the sudden, the FCX trade looks a whole lot better.

As for BAC...
 BAC did exactly what I said I hoped to see, it filled the gap and then went range bound. Compare to the SPY below.

After filling its gap, the SPY continued higher while BAC did not participate, something that makes me feel okay with have held the position overnight.

As you saw earlier, the NYSE TICK chart stayed very mellow today, there was no inherent strength/solid bias to the TICK hart today, making today a mediocre day at best, but every day is usually a set up for a coming move, my guess is the French Auctions won't go well as OATS leaked higher all day today in anticipation of tomorrow's auction and just wait until the S&P finally chimes in with their downgrades.

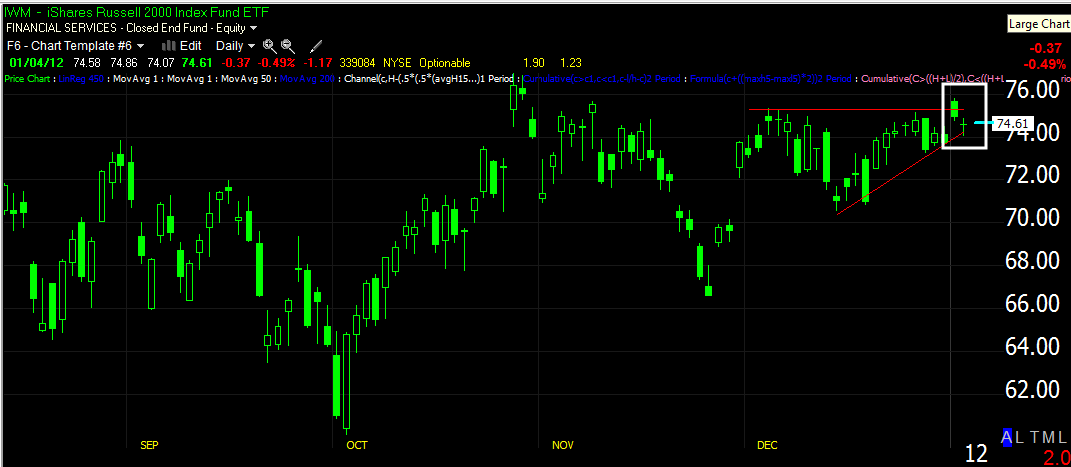
In a probably little noticed sign of market weakness, the IWM not only did not lead today, but was the worst performer on the day (S&P-500=+.01% , NASDAQ 100= +.31%, Dow-30=+.17% and the Russell 2000 -.66% on the day).

 Speaking of possible/probable head fake moves, here's the daily IWM. Not only should the IWM have led today, it should have shown follow through buying on a breakout, neither happened, a definitive sign of market weakness.


Intraday, the IWM didn't participate in the broad market's slow drift up, but couldn't even close the gap, which leaves open the possibility of a bearish breakaway gap, something we haven't seen much of lately, especially not in the averages.

Both High Yield Corporate Credit and High Yield Credit underperformed the S&P on the day as did the Euro. Commodities tended to outperform on the day, something that helps the FCX trade.

All in all, not the New Year's blast the market is use to seeing in the first week of trade.

FCX possible Swing Trade

For now, I would set up my risk management and position sizing in FCX as a swing trade, if it works and trends, you can add to FCX and introduce a trending stop. For more information on shorting a stock (specifically regarding adding to the position as it works in your favor and why short selling allows you advantages that a long trade doesn't) see my article from Trade-Guild.net, "Making More Then 100% on a Short" . The article was written a while ago, but is still relevant and may also give you some ideas as to the advantages of a real equity short over an inverse/short ETF (which is considered a long position in your portfolio). I think there are advantages to each and disadvantages, it's a matter of using the right tool for the trade.

If I was considering FCX as an options trade, I would buy March Puts and slightly in the money. Otherwise, I would consider the trade for a real equity short sale. The options are going to limit your time and you'll have decay. However if a head fake confirms, then options will give you leverage as well as pre-defined risk.

I talked about FCX last night, you may want to take a look at that article as well. As far as Trends in FCX, without going in to Dow Theory and using my simpler model of moving averages which works out just about the same, FCX is in a primary downtrend, a slightly positive intermediate trend and short term trend is flat.

 This s a 2-day chart just to give you an idea of where FCX is, the primary downtrend is obvious, so trading with the trend is a plus here.

 The triangle that has set up is a symmetrical triangle and carries no bullish/bearish implications other then the preceding trend. Some may look at the preceding trend as up and this would be advantageous in a head fake situation, longer term it's hard not to call the preceding trend down.

 Step 1 of any good head fake trade (and these trades tend to be ripe/ready and move quickly) is an obvious price pattern that traders will be aware of, we have that, step 2 is a breakout. For the size of the triangle, volume on yesterday's breakout is lacking and there's no reason a bullish breakout should be lacking at the start of the new year. The follow through today is also lacking in volume, but overall from a price standpoint, it looks bullish.

 When you look at the breakout on an hourly chart, all of the sudden it doesn't look so bullish. Volume is dropping off significantly and recent price candles have lost momentum, not what you want to see on a follow through day after a breakout.

 Here we see accumulation for the breakout, it's not a long period, but t is in the right place, at the low end of the triangle and in a flat trading range. Note however that the 10-min chart which has had plenty of time to confirm the price move, has not.

 The 5 min chart could have and should have confirmed the breakout yesterday, instead it is actually in a leading negative position, this would suggest distribution. Confirmation would see 3C where the orange arrow is.

 A closer view (zoomed to show intraday movement) shows 3C moving lower in to higher prices, this is part of the reason Wall Street runs head fake/false breakouts, they have demand (bulls buying) to sell in to at higher prices rather then crash prices by trying to sell in to a market lacking a bid.

 The 2 min chart also shows accumulation in white to prep the breakout, again, note the accumulation near price lows and in a flat range (these are signs of institutional money at work-most traders look for volume spikes and such, but Wall Street does their buying and selling in boring, flat areas and usually on light volume, they don't want to attract attention while they are accumulating/distributing as that would drive prices against them).

The 1 min hart confirms everything seen above, it is in a leading negative position.

Furthermore, as I showed with the Credit/Risk basket, commodities are frothy compared to their FX correlations and the macro environment for many commodities is not good with China's manufacturing sector in decline.

If you like the trade, a phased entry could be used with a partial position here or you could just wait on confirmation of a head fake, if I used options, I would prefer confirmation of the head fake.

URRE Update

I know some of you are long URRE and yesterday I posted some analysis on it and said to look for some follow through today. While we aren't quite yet at the kind of follow through I'd like to see, URRE is definitely improving today as the day wears on.

Make sure to see yesterday's update if you didn't.

SPY/BAC/IWM

 This is the SPY (green) vs the IWM (red), small caps really should have led any advance, instead they are rangebound and leaking lower, all of the averages moved up except the IWM.

 SPY 1 min continues to fall apart in to higher highs.

 And that has moved to the next timeframe now.

 As for BAC, I said earlier I wanted to see it fill the gap and then go sideways, it has done exactly what I was looking for and really hasn't responded to the broader market pulling away to the upside in the last hour or so. I like BAC for this particular kind of trade, it offers better returns on these short trades.


 Now the BAC 2 min has seen the 1 min deterioration bleed in to the next highest time frame.

On a longer term basis, the 15 min chart, which is much more important, has a nice negative divergence in BAC.

BAC Trade

I don't really like putting the trade on this late, but I think I'm going to go ahead and use puts again with BAC. BAC and the IWM really aren't responding, financials in general aren't responding, it's not a good sign with the S&P moving.

I'll send out some charts in a minute, but I think BAC Jan $6 Puts will be the trade again, of course I'm keeping these at a semi speculative level and investing about 10% (before margin) in the trade.

Intraday Market Update

The market has really mellowed out here, I'll show you that in a minute. One of the things I was thinking for today was some range bound trade, it seems we are in that now.

 Here's that range/consolidation I mentioned earlier.

 The 1 min SPY chart continues it's march down.

 ES is starting to look kind of bad with the divergence there.

Here's what I meant about the market being mellow, the NYSE TICK chart is in a narrow range, unlike yesterday.

We are just getting some action now in the market, this may be the prelude to the set up I've been looking for.

As for longer term trades, FCX is looking really questionable here, I'll post an update on that one soon.

European Update

The big loser in Europe today is Unicredit, down 14%. Financials are getting hit hard, although it is mostly showing up in credit or at least it is more acute there.

As I reminded you, France has a big auction of debt tomorrow and French Yields are rising pretty dramatically today ahead of the issuance. As mentioned last week, Thursday will be important for Europe and France in particular. The ECB's inability to support OATS in the secondary market makes French debt the real barometer of what s truly going on with regard to contagion.

The Euro is on a little counter trend bounce right now and that is likely the support the US markets have seen thus far today.

It will be interesting to see how the Euro reacts after the EU close through the New York close with the French auction tomorrow.

Market Update

There's definitely some short term momentum loss, but I'm inclined to sit still for a bit longer.

 This XLF 1 min chart is an example of what the averages are looking like on a 1 min scale, this is a leading negative divergence and has slowed the upside momentum as most of the averages have filled most or all of the gap.

 There is some weakness bleeding in to the more important 2 min chart, but I just don't feel like we are at a reversal here yet, this could still very well be a consolidation or even a intraday trading range developing.

 BAC 1 min from positive divergence to some distribution on the 1 min

 The 2 min though is not seeing that weakness bleed through yet.

 DIA 2 min losing some momentum as 3C has the first negative divergence.

 The SPY is more or less in line or confirming thus far.

 There's a little weakness in the Q's but not enough to be actionable.

And the IWM is pretty much in line as 3C moves a bit lower with price. The IWM remains the only of the averages that hasn't filled the gap yet.

WOW, that happened fast-BAC fills the gap and then some.

If you are looking at this trade, just be patient now and wait for the distribution signal.