Monday, August 27, 2012

Get Ready

For some downside volatility, we'll see what the charts look like on the move, I'll post some soon, USO is coming out in a minute.

AAPL Charts

So far they keep moving the right direction, I want to see a break higher with the charts moving lower, that will likely be my 2nd half Put entry.


 1 min chart has had 3 hours, it only needs about 15 minutes to confirm, no confirmation at all.

 2 min chart deterioration making new lows intraday, this is what I want to see, this is the way we separate a false move from a real move, remember BIDU back in April, it's nearly a fractal carbon copy, just on a larger scale.

 3 min moving to a new leading low

 15 min also made and moving to a new leading low.

These are very rough targets based on price pattern measuring implications of both the larger triangle and the bull pennant today, they'd suggest a target in the lower $690's, I don't know if we get that or not, you have to consider a lot of other things, from a psychological standpoint, $700 would be the strongest move as it is a century mark, the human mind gravitates toward whole numbers and $700 would be a very strong target, it's not that unrealistic.

AAPL Update-Patience

I'm still waiting to add, the break below the small intraday triangle today doesn't mean much to me, the Bollinger Bands (10 min) do.

 It's difficult to give a target, the best I can do is use the larger triangle's measuring implications which gives us about $690, which would be great if the charts keep moving the way they are, that's why I don't believe in this move, especially not this early in the day.

 I'm guessing we just get a bigger triangle.

 Look for a reversal at the moving average and the 10 min BB's to compress and pinch, then look for a move up and we'll watch 3C.

3C charts coming next.

ES / VWAP no surprises here...

I explained last week how VWAP (Volume Weighted Average Price) is one of the few indicators that we know Wall Street uses and they use it to grade market makers on the NASDAQ and specialists on the NYSE proficiency in filling a large order for institutional money. Yes, Morgan Stanley (who also happens to be a market maker) is perfectly capable of placing orders, but there are many firms that place large orders and to get the best fill, they go to the expert in that stock, the market maker or specialist that represents that stock, these middlemen know the stock better than anyone, they now all the players, how those players react to different scenarios, etc, so when large orders go out, they are usually run through these middle men. If the market maker/specialist can fill the order at or at a better price than VWAP, they have done a good job and will get future business, if they give a bad average fill as measured by the VWAP, then they are not likely to get another chance at very lucrative orders that these people can make money off in a number of ways, including knowing what smart money is doing so they can tag along or heaven forbid, even do that illegal thing call "Front run" the order.

So looking at ES and VWAP this morning, there are no surprises here.

"If" I were a middle man in ES filling a short order, I'd be selling short at the pre-market highs at the 2nd upper standard deviation above VWAP, I'd have some clue that there's likely to be a correction or they may even have better information based on a number of sources and even order flow, I might trade a few contracts long at the lower 2nd standard deviation below VWAP, not only making a profit for my own account (market makers and specialists typically use to be responsible for about 30% of a stock's daily trading volume just from trading their own account), but would also put in a floor and support , it would show those watching order flow that some large orders came in and get ES moving up again. I'd then sell my contracts near the upper 2nd standard deviation for a nice personal profit and sell short some more ES for my institutional client and I'd be doing a fantastic job in their eyes filling them at 2 standard deviations above VWAP.

Remember, this crowd isn't trading in 100 lots like we are, they are moving on a massive scale, if they tried to execute an order that big all at once they'd drive the market way against their position, maybe even crash it before they had their position in place. There are High Frequency Traders that do nothing but "Ping for icebergs", meaning look for those large institutional orders, then when they find them, thy front run them and end up costing the institutions a lot of money on crappy fills as the HFTs drive price against them.

We can't afford to thin like the crowd on the StockTwits stream or Yahoo Finance message boards, we need to know how they think, but that's just to know how Wall Street will take advantage of them. You need to think like the people you are really up against.


AAPL Update

Here it is and I LOVE the looks of everything.

Friday I opened some September OTM (Out of The Money) AAPL Puts at $650, that was the first half of the position as can be seen in this post from Friday.

In this post from a bit earlier on Friday I was concentrated on the AAPL triangle, check out the post if you don't understand the significance of AAPL forming a triangle right here. 

I also said in this same post

"I mentioned AAPL and its triangle and the possibility of a Crazy Ivan shakeout, it looks like that's what we have."

I ended the post with this,

"A move to the upside above the triangle and we'll likely have a Crazy Ivan shakeout, but again, consider the bigger picture theory I laid out this morning, don't rush it."

This is EXACTLY why the new position on Friday was a 1/2 position as mentioned above, "The First Half". I'll be looking to add the second half and probably will do so today.

Here are the charts...

Here's the Triangle mentioned Friday, Technical Traders are so predictable that it makes Wall Street's response to them more predictable. The significance of this pattern is simple, it is a symmetrical triangle that carries no bullish/bearish bias by itself, it all depends on the preceding trend which was up, that makes this a bullish consolidation/continuation pattern in any Technical Analysis book you read, that means every retail technical trader is expecting AAPL to do exactly what the green arrows are showing, consolidate and breakout to the upside. We did see a head fake shake out move first to the downside, many AAPL longs will buy the price pattern alone, but there is a tendency in TA to wait for price confirmation, I call it chasing, but they have few worthy tools to work with, this breakout to the upside this morning opens up volume, buyers step in and create demand which is exactly what hedge funds and big traders like banks, Wall Street need to sell their AAPL or short in to it. For hedge funds right now it has very little to do with what AAPL is worth, if the ship sinks (the market) all the stuff in the ship sinks with it (most stocks will follow the market). At this point in the year, only 11% of hedge funds are doing better than the SPX, this means hedge funds are about to be or are already being walloped with client redemptions as they can buy an S7P vanguard fund to get better performance than 89% of hedge funds and without th 1.5-3% management fee and the 20-50% (of profits) incentive fee. So hedge funds are better off selling at higher prices while they can in order to raise cash for the redemptions that are coming from clients rather than take a chance they have to sell at much lower levels, this is why this triangle, right here, right now is so important, VOLUME and DEMAND, exactly what hedge funds that are holding positions that can be hundreds of millions of dollars in AAPL alone and AAPL is the #1 hedge fund holding. If they need to raise cash, AAPL is the place to do it and this triangle and the breakout help them do it. This is why I entered half the new position Friday (just in case it went the other way and left half for a break out or Crazy Ivan move).

Here's the first head fake move and the pop above the triangle with volume rising, it may not look like much, but in AAPL it is significant and every bit counts.

 The 1 min chart DID NOT even try to confirm the pop this morning, didn't even attempt confirmation.


 The 2 min chart is also leading negative, but much more than just this.

 Here's the trend, you'll note that the divergences get stronger at resistance points that price breaks through for the very same reason I just outlined about a move above a triangle which is the most basic chart pattern any technician out there knows.

 The 3 min leading negative, but this doesn't begin to tell the story... I suspect the next hedge fund holdings update will look very different than the last.

 The 3 min chart's trend, UGLY!

 The 5 min is deeply leading negative, look were it got worse, right at the open on the 21st-gap up, the yellow is the triangle from above.

 The 5 min chart and exactly what happened on a close up at today's break above the triangle, this is important because that's a big move on the first timeframe that really shows big flows of money beyond intraday moves.

 The very important 15 min chart (the longer the timeframe, the bigger the signal and more flow of money), this is hitting a new LEADING LOW!

 Look at the sharp decline in the 30 min chart to nearly new lows! There's a price formation here that few may see.

Remember last week I talked about double bottoms and how according to Technical Analysis and historically the second bottom is a little higher than the first bottom? Well that has all changed, at least for the last 10 years, but traders ignore that, now what happens is the second bottom is lower than the first, it's a head fake move on a large scale, it shakes out longs as they don't expect the first bottom to be broken and they put their stops there, then the double bottom usually takes off to the upside from there. Well it's the EXACT same thing with double tops like what we have here, it use to be the second top was slightly lower than the first, but for the last 10 years and against everything Technical Analysis has taught for nearly 100 years, the second top has been making a slightly higher high (a head fake move kicking shorts out, bringing longs in and you know what happens with failed moves, they become fast moves-just look at the breakout above resistance in BIDU that led to that big/fast move down). So not only do we have the price pattern the way it has been playing out for the last 10 years, we have technical traders still not adjusting to the new realities and we have 3C confirming everything above with a leading negative divergence and on a 30 min chart to boot with confirmation throughout! These are the emotionally difficult trades to make, against price and what you see with your own eyes, but if it were easy, then everyone would be making money except Wall Street.

 Intraday this is what I'm watching for an entry signal, a small triangle that should produce a directional move, I'm hoping up (but not for too long), that's where I want to add the second half of the OTM put position from Friday.

The 10 min. Bollinger Bands are tightening, that should lead to a highly directional move, I'll let you know when I take action.

Big AAPL Update coming

I'm here, I'm set up, I got to drive my Ram 1500 Crew Cab with a V8 Hemi over a decent size tree in the road and am feeling macho, all the reasons you buy a big, powerful, all black truck.... right?

The AAPL update is uploading now, it's pretty large, but it's because there's so much to see, I'm REALLY excited about this one.

A few more minutes and it will all be uploaded.

Opening Indications

Looking Good... For opening action which is not my favorite as it is heavily manipulated to take advantage of piled up stops and limit orders.

Here's the migration of the negative divergence rolling through the timeframes of the SPY as we saw begin on Friday, then the 30 min chart, you can think of the first 4 charts as the gauge of short term action, were it reaches it's breaking point as we can use any price strength to short or sell longs in to, the last chart is the more important 30 min trend, this is kind of a map of what has happened already and how things look moving forward or the strategic outlook, it looks very bad, this is why I WAS NOT fond of trying to ride a bounce and rather short in to strength as the 30 min is where the probabilities are so I'd rather align short term trades or tactical entries with the probabilities. Remember "PRICE IS DECEPTIVE".

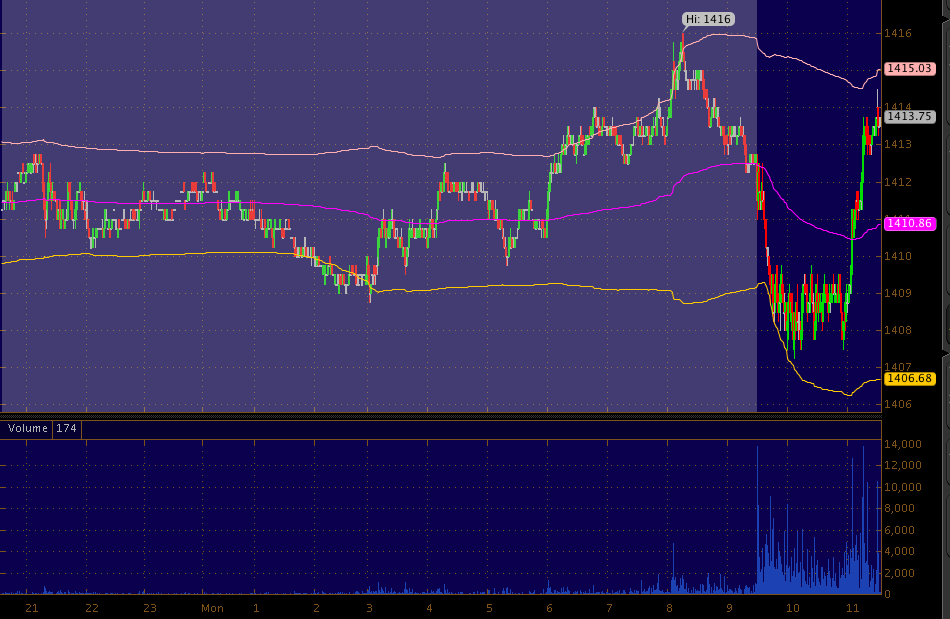
Using the SPY as a general barometer.

 The 1 min chart negative and especially on the open.

 2 min leading negative, this is what started Friday, very soon after the divergence which is unusual as they usually mark up price a bit before starting distribution.

 3 min from the positive divergence and already moving negative

 Even the 5 min , which is where this should all break as this gets uglier, leading negative.

 Here's the 30 min chart, this is like the road map, vet leading negative, the yellow area is where I think we will look back and see this area as the pivot.

The DIA
 Almost as soon as the downtrend line was crossed, the 1 min chart was going negative, this would have been the first technical level bulls would look for price to move above.

 The 2 min chart-last week's positive divergence, already leading negative

 3 min negative on the open, badly.

 This is where we want to see the 5 min in all of the averages break down, right now its pretty close to in line.

 QQQ 1 min is surprisingly weak with a deep leading negative. I'll look closer at AAPL, but I suspect there are some major breadth (advance/decline) issues there.


 QQQ 2 min leading negative, very ugly for this early in the move.

 The 3 min is not only leading negative, but really nasty on the open today to a new low.

 The 5 min is just going lading negative, this is exactly what we expect to see and want to see, it gives us reason to short strength in price.

 The IWM / Russell 2000 has been by far the strongest, the 1 min is leading positive intraday so watch that for an intraday move, I'd rather see it in the morning.

 IWM 2 min is leading negative, really bad on the open

 As is the 3 min

And now the 5, this is good.

I'm moving locations, it should take about 10 minutes to be set up an running, it's a faster connection and is working again now.

Take a look at USO, nice weakness there this a.m. I already have an equity short there, I'd like to see some price strength to open a Put.

ES Heads to Lower VWAP

The SPY may have gapped up on the open, but the actual action was not bullish as ES (The S&P E-mini Futures) headed to the bottom 2nd standard deviation of VWAP.

There it is, I'm not VERY fond of early morning trade (especially on Monday's), but we'll have a closer look any way. On my end debris is literally bouncing off the windows! I use to love these storms 10 years ago when I would look forward to surfing them. Now they are a connection pain in the rump

Targets from last week

As you may recall last week we had fractured (not solid) positive divergences in the market Wednesday and Thursday, also unconfirmed for most of that time, so the expectation was a bounce, the BIDU and other short term Puts and shorts were closed out in anticipation of higher prices and a better entry in a new short term Put/short position.

As of Friday we started seeing selling in to the move up very early that reached the 1, 2 and 3 min charts and in half the major averages, all the way out to the 5 min chart which is where the positive divergence is, so the break down of the 5 min chart is where we want to think about entering those short term shorts again for the next leg down. Remember the VWAP posts and what VWAP means to institutional traders.

 These were several target areas on the SPY I posted last week, Wall Street rarely runs a move without a meaning, psychological/Technical-they're both the same, so a closure of the gap was an easy on, but to maintain longs in position, a higher high would give them confidence or a move to the recent highs, which I believe will likely be shown as the top as we move forward.

 ES Sunday night since the Friday close at 1409, 3C is very choppy, not much trend, but few major markets were open like Treasuries, etc.

 ES going in to the 9:30 open, the white arrow is the European open for the week.

 ES daily VWAP, you can see the move to the upper standard deviation, we'll likely see another now that ES has touched VWAP pre-market.

The weekly ES VWAP needs the open to widen out, but there's the area in red I suspect is our actual turning point, look for ES to move just above the weekly VWAP as it did last week, I suspect the downtrend will remain intact, but Wall Street often makes moves that are more extreme than we think rationale, this will be interesting to see where it does land as it may signal a major change in character and those changes often are a part or precede changes in trend.

More coming...

Isaac

I'm posting to  you this morning from my 3rd location, aparently Isaac is giving us a little more than we anticipated, knocking down some trees and internet access, hopefuly I'm good now at my 3rd location.

Just try to keep in mind that we have 40-60 mile an hour gusts outside, moments of blinding rain, etc. So if I'm a little slow on the emails, you have some idea of why, life is a little different here right now than most places.

White arrow is me