Thursday, October 18, 2012

AAPL Update

So I think everyone understands our view with AAPL, but I'll include some of the broad strokes.

My regret with AAPL was closing the short position in anticipation of a bounce which AAPL did do to put together a right shoulder, the H&S concept is still very reliable, but the advantage of phasing in to a core position in having some exposure even if it isn't the prime entry.

GOOG is a big company, you wouldn't expect something like this to happen, but it does and luckily a lot of us already had a decent position established short GOOG. PCLN was another, I could have let it go as price wasn't doing much, but the 3C charts told a different story, then PCLN fell 17% in 1 day and PCLN is still our top performing short (no leverage) position from back in April at a 25% gain.

As for AAPL, I think I'll still be patient and stick with the plans and concepts that have worked so well for us, but it does seem things in the market are changing and we are getting closer to that point in which even smart money's manipulations can get blown out of the water, had GOOG been up big today instead, the short term pullback would be toast now.

 For a short entry we have been looking for the volatility shakeout of new shorts that entered on the initial break of the neckline, that happens more often than not with H&S tops and that gives us an excellent entry. The pullback in the market fits with AAPL's trade.

 Here's AAPL intraday on the GOOG earnings.

 The long term perspective and highest probabilities are with this 4 hour leading negative divergence.

 On the dip in prices since AAPL hit resistance at the neckline, we have seen some short term intraday accumulation / positive divergences and that is what we want to see to hopefully get positioned on the upside shakeout.

 The 3 min chart is seeing that migration of the divergence as well

 The 5 min chart is not seeing it as of yet, I hope it does, but so far just the negative divergence sending AAPL down from resistance.

 The reason I have thought AAPL can do it, make the volatility shakeout is the 30 min chart.
While not REALLY impressive, there seems to be enough left in the tank to make that move in AAPL that will allow us a prime entry.

We'll have to see how GOOG effects the broader market.

GOOG Surprises in more than 1 way

We were expecting GOOG earning after the bell today, in yesterday's update I mentioned this parabolic move in GOOG, like the rest, isn't going to end well...

I also showed a lot of price only, MoneyStream and 3C charts that showed clearly, something has changed with GOOG.

Well GOOG came out early today and reported there are more details at the link.

Profits fell 20% as costs went up and advertising down.

Why GOOG reported early, was it a mistake? There are some signs it was, in any case, I don't know , but the core short in GOOG was about 2/3rds a full position, there was obviously something changing in GOOG, this changes the market complexion a lot. I'll need to keep a close eye on the market as we expected bad earnings, but this is really bad.

It's very hard to say if there was a leak because this negative divergence was present in GOOG on a 5 min chart RIGHT BEFORE earnings were released...
GOOG 5 min negative divergence.

It's hard to say if there was a leak because if you recall, the SPY 5 min chart didn't look much different.

SPY 5 min

GOOG Didn't help

More coming on GOOG, one of our core short positions, for now a chart is worth a lot of words.


Market Update

The last update said this looked like a head fake move as the QQQ tried to fill today's gap, take a look now...

 QQQ just about fills the gap, something it couldn't do this morning...

 Volume surges right from there.

 SPY negative divergence on what I suspected was a head fake above resistance

SPY volume on the break back below.

Market Update

I'm still holding the pullback positions entered earlier today, it's still early in the day and this looks like a head fake move as the Q's try to fill the gap.

 DIA on the move intraday


 ES which has been so strong lately is not confirming either.

 The Q's are in line as they try to fill the gap they missed earlier today.

 The SPY just breaking above resistance on a price spike.

 However that move on even a 1 min chart isn't confirmed.

And the 3 min speaks for itself.

I'll keep an eye on this of course, but this is part of intraday trade and the probabilities are still with those 10 min negative divergences.

FB Update

Just to be clear, the FB trade idea (long) has always been a longer term trade idea like UNG or even MCP (to a lesser degree) and what they have in common is that they all look to be in basing formations or stage 1, it's the mark up stage 2 breakout that we want to catch, but being able to enter a base near the lows gives you the ability to ride out a lot of volatility as you entered at a better price, lower risk, etc.

The thing to remember is most of your volatility in a stock's life-cycle from stage 1 base, stage 2 mark up, stage 3 distribution and stage 4 decline is going to be found in the stage 1 base and the stage 3 top, that's where there's the least profit to be made, stage 2 is where the most profit is made, but you want to be in before stage 2 starts so you aren't chasing.

This essentially means you have to give these kinds of trades more room, wider stops and if need be, take on smaller position sizes so you can deal with the volatility and phase in to the trade, entering on pullbacks toward the bottom of the base and eventually in most cases on the final head fake break/shakeout.

Keeping all that in mind, here's the FB update.

 FB longer term 4 hour chart shows the first long entry back around May, it doesn't look very big now, but back then we did very well with that trade. Since we have a long term chart that is developing pretty well with a number of positive divergences relative to different areas.

 FB's recent positive divergences make this latest move look like a rounding bottom, I'll show you .

 Here's the basic idea and we've seen it before in FB, the accumulation is toward the bottom and that is probably why we are seeing the positive divergences pop up stronger now, when price moves too far away from this area, it gets knocked back down. When accumulation is complete, a stage 2 breakout will occur, in treating this as a basing trade, I want to phase in at the same areas smart money is doing so or even better areas because they need more time to put a position together, we can move in and out in minutes.

 Here's the last rounding bottom in the FB base, but note it is not perfectly rounding and it won't be because of market behavior and retail trader behavior, there will be false starts, shakeouts, etc. In red you can see some areas that moved away from the rounding on both false starts and shakeouts, this is why you need to treat this kind of trade differently, it's a longer term commitment, a position that is built and a wider stop/risk management (maybe even smaller position size initially).

 Here's the 5 min chart going more positive as the bottom of the rounding area is reached, again though, that volatility is really just noise in the bigger picture.

 FB 10 min.

An example of what I mentioned above on the 30 min chart, FB was too far away from the accumulation zone and was knocked back down, near the zone we see positive divergences, this is where I want to build and add to the position, but I think to be successful here, you need to treat those as a longer term trade and understand the volatility that comes with a base or a top and not get caught up in it as well as plan your risk management around it.

I don't have any problem with adding to FB here, but I would count on a wider stop that could violate that rounding bottom as that is the general shape, but volatility will do what it does as shown in the previous rounding bottom.

In the end, the bigger the base, the stronger the move up.

MCP Update

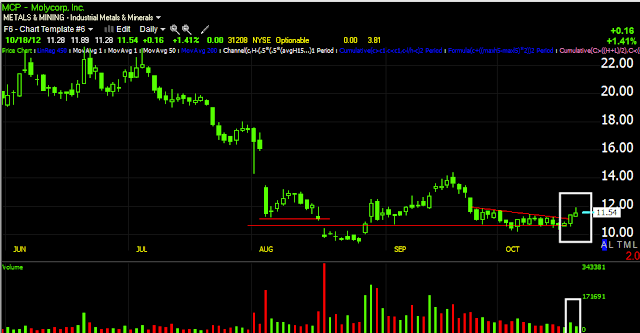
Tuesday I said MCP looked ready to breakout, yesterday it did breakout for a 5+% move (some of you have 100+% profits in options) and in yesterday's post I didn't see anything negative in MCP's move, in fact there was a lot of confirmation and the other thing I mentioned is whether or not we might see follow through today.

Thus far we have some follow through with a +1.76% move up, so I know many of you are wondering what to do with MCP. Honestly I can't find anything negative yet that that would scare me out of the position, the only thing is with a 100+% gain in options, I'd be tempted to take at least some off the table, but that's more just my take on options and my personal opinion.

It's early in the day to rely on the charts as institutional traders usually come out toward the end of the day, but lets take a look and see what we have thus far and I'll provide some Trend Channel Stops.

 Here's the daily breakout, I would keep an eye on volume, we want to see it rise today for follow through.

 So far MCP's volume is rising today on the move.

 The intraday timeframes so far are all in line. 1 min

 2 min

 3 min

 5 min is good and 10 min is in line

 For a longer term stop, the hourly will work.

 This 30 min is a bit tighter.

At 15 min, you are pretty much playing this breakout only.


Opening Indications

You've seen the charts enough times the last day or two that I probably don't even need to post them. The SPY and QQQ have decent 10 min negative divergences that should certainly see them pullback, the DIA is a bit stronger, but opening indications show it may be ready to break in this area. The IWM remains very strong, even though it has a 10 min negative, it's not the size of the others-this is rotation and the kind we haven't seen in a long time. In any case, while I would never play a pullback move based on the IWM alone, taken with all of the averages, I think it's not a bad idea for those who want to trade this market as nimbly as possible and try to squeeze some profit from it each day. That being said, this is certainly counter trend to the move up we have been expecting the last (nearly) 2 weeks so I'd consider playing the pullback speculative and position size/risk management should reflect that in my opinion.

Here are the charts that matter as you've seen the rest many times.

 DIA 1 min has been showing the signal for a pullback, but the DIA has been hanging in there, this morning may have been a tip off.

 A closer look at the same chart on an intraday basis, the DIA makes a little head fake move above resistance and fails on a negative divergence, perhaps it's time for the DIA to crack on a pullback.

 IWM 1 min shows a very small 1 min negative, it's very small as most of the IWM is in line or confirmation.

 This is about as bad as the 10 min chart gets so you can see it looks better than the other averages. We might want to keep this in mind when looking at longs to add in to a pullback.

 QQQ 1 min this morning is in line for the most part, a small negative on the bounce attempt to fill today's gap.

 The 10 min negative divergence here is large enough that I think playing the pullback is worthwhile, but ultimately there's still a lot of strength in the QQQ to move it higher after a pullback.

 SPY 1 min this morning on the gap fill, pretty much in line.

SPY 10 min negative divergence, even here without looking at longer term charts that are stronger for a move up, the 10 min negative is reasonable for a normal pullback.


Also Considering a Similar Position in FXP

I do like FXP and have the position as a long, I think China will falter before the US markets in the near term, but even for a pullback play, FXP moves the opposite of the market so a pullback in the market should give FXP some near term traction and is another idea that might be worth exploring just to play a market pullback.

Since FXI has a lot more volume, the signals there are better and this morning FXP is in a good position as it hasn't moved up yet.

Here's FXI charts, but remember FXP is the long trade I'd like to play during the pullback, FXI just gives better short term signals so the weakness in FXI essentially translates over to strength for its inverse ETF, FXP.

 FXI 1 min leading negative...

 FXI 10 min leading negative like the market averages.

FXP with a 10 min leading positive, this is the short term/market pullback trade I think may be worthwhile.


UVXY

UVXY is a leveraged Volatility ETF or more accurately "Short Term VIX Futures".

The pullback right as I decided to play the volatility side was perfect as UVXY filled the gap, something I was hoping for last night in early trade, an entry.

As for the charts, remember this is only a short term trade, essentially playing the pullback...

 UVXY 1 min leading positive after a relative positive divergence.

 UVXY 2 min leading positive, essentially te same as above, but showing migration of the divergence.

And the divergence positive out to the 10 min mark, like the market negative divergences negative to the 10 min mark.

Now the SPY has filled the gap and QQQ just about did, hopefully the DIA and IWM follow with some weakness, that should help UVXY or VXX longs gain some traction.