Wednesday, March 6, 2013

Market Update

I haven't posted in about an hour, that' not because I've been at lunch (which I never take-I'm lucky to find time to go to the bathroom, thankfully I have a MacBook Pro that gives me some mobility). I've literally been looking at probably close to a hundred charts in the last hour, I've never seen so many underlying currents at work.

What you need to see is the Leading Indicators Update, I don't now if I have time to get that out and keep on top of this market.

The next thing would be currencies, there are some key events in currencies right now like the EUR/USd below $1.30, this will almost certainly see an invisible hand with an "ECB" ring on the finger pulling some levers in the FX market, just like the NY-F_E_D or Plunge Protection Team (President's Working Group or NY F_E_D-is there really any difference?) The Yen as I said last night will be one of the biggest pivot assets of the day, a move there will almost certainly change the entire market, however I'm afraid that we aren't going to see much until the overnight session when the BOJ is due to put out their policy statement, it does seem to me that it will be somewhat of a lame duck as they are in the middle of a confirmation process for the new BOJ governors, I'm not sure the BOJ will make any big moves ahead of the new leadership coming in and there are questions as to just how many of Abe's picks will make it in.

There are a lot more currents than just that though, it's getting hard to keep up with them all.

While the F_E_D's Beige Book was "Modestly" boring with a word cloud that consisted mostly of "Modest", it does seem the market has reacted somewhat to the release.

Here are the latest screen shots of the Futures, I need to look extensively at the market averages and confirming assets. In many ways, especially in NQ, we have not seen the move that 3C is promising or saying is the highest probability...

ES-S&P Futures
 ES 1 min intraday has picked several divergences and ES has moved as 3C suggested, the 1 min positive hasn't seen that big of a move, I really...REALLY expected more and still think there's room for more, but the recent falling apart of the positive as the Beige Book came out makes me wonder whether that is transitory or the real deal, I think it's the former.

 The most important chart, the 5 min has deteriorated worse, this is what I suspected at the start of the week, "Bigger divergences, MORE VOLATILITY", in any case, this is worse so I don't want to miss the opportunity to get in, but I don't want to jump the gun either and all of the underlying currents aren't making it easier.


NQ NASDAQ Futures
 NQ 1 min intraday also picked divergences and NQ followed what 3C suggested as highest probability, but here we still have a 1 min leading divergence and NQ hasn't really delivered on price as of yet.

The more important 5 min chart has also grown worse here as well as ES, much worse, so I think it may be about a little patience as the market shifts again or changes character and get on track and in sync with the new face of the market.

I'll continue to update and as soon as i feel the probabilities are highest, I'll start calling out the trades.


EUR/USD

This pair generally moves with the market, but it has been dislocated pretty badly which s not good for underlying strength in the market, the assets that are correlated with the market that give it strength or tell us that price is weaker than it appears.

The pair just crossed under the $1.30 level, I suspect that there's a line in the sand there and perhaps the ECB's invisible hand will step in and support the Euro, this would also lend some short term support to the market which we are looking for right now any way.

 This is the Euro in ornage vs the SPX in green, at the green arrow the Euro and the SPX are moving in their normal correlation, one in which the Euro supports the market, in the red box the Euro fell out with the SPX and the $USD gained strength, this puts bearish pressure on the SPX/market and as you can see the upward Rate of Change fell off badly as momentum was sapped from the market, this being one of the reasons.

 Here's the Euro and SPX intraday today, again the Euro fell quite a bit, maybe a bit too far.

If I were an FX trader, I;d be considering EUR/USD long right now as I don't think they'll let sub-$1.30 prices stand without support.

 Here's the 5 min 3C chart if the EUR/USD, note the bad negative divergence and the sharp fall, it's below $1.30 right now.

The shorter 1 min chart shows a positive divergence, this could build, it could just be support, perhaps just enough to take back $1.30, but I'd be more willing to bet on the Euro in the short term right now thn against it, this should also help market momentum to the upside intraday as we have been looking for and as started not too long ago.

GLD April $150 Call Update

I still like this position and if you are interested in the position, I think this is as good a place as any to pic it up, whether long GLD or via options.

The size of the base forming in GLD is what is really looking attractive, the bigger the base, the more upside it can support.

 The rounding bottom is coming along well, on Monday I said I thought we were right at the midpoint (essentially the lows of the base) and it will start moving up from here, it's not going to be a clean, rounding line as there's always going to be volatility, head fake move, shakeouts, etc. Wall Street is never going to make a trade easy if they can help it, that's how they make money (running you out of a good trade and taking your shares on the cheap-All of your shares are belong to us now Ha, Ha, Ha!!!"). However if you put a moving average on price, you should se a rounding bottom pretty clearly.

In a.m. trade today GLD saw a 1 min (intraday) negative divergence send it a bit lower, it looks set to make an intraday move higher which will serve to add more upside rounding to the pattern above, the position is pretty close to going green now, it may later today, but I'm looking at this as a slightly longer term trade unless something changes in which case I'll let you know.

 The 15 min chart is leading at a new high, even though price hasn't quite made it there yet, so I like the looks of this.

The long term 4 hour chart is positive, this is a long timeframe and an important signal, even if it doesn't look as sharp as some of the shorter term signals.

So far, so good.

We Should have our reversal any time now

After we get an upside reversal, things are going to most likely happen much more quickly. Yesterday's QQQ Puts are at over a 20% gain and they were opened right in this area-momentum, volatility, it's all important so some calls are probably going to be in to strong upside momentum and it will not feel natural or comfortable to enter trades like that, but this is where we get the best prices, the lowest risk and best probabilities.

Here are some signs the intraday upside reversal is near...
 The TICK chart went from a downtrend to just breaking that on the upside

 SPY 1 min intraday positive divergence

 This is not so much good news, the 5 min 50 ma has been broken, that's not good for the move started yesterday, the Trend Channel is broken as well, but we often get a lot of volatility above and below these as a change is occurring.


 ES 1 min intraday is positive, it looks like we should get a decent upside move, I'd guess above VWAP, the more convincing it is, the better it works.

 NQ has the same 1 min intraday positive, we should be set to go any time

Volatility is Confirming-Also Possible Trade

I think it was last week, I opened UVXY long  as a trading position, there's also a VXX long as a longer term position.

I'll be looking to add to UVXY as a short term trading position on a move in volatility.

Volatility looks to be confirming what I just showed you in the Futures post, "Game Plan For Today".

I'm trying to build the case a little right now because I think things are going to start moving so quickly that I won't have time to post the charts later, this helps build the case and gives me confidence the probabilities are lining up on the right side.

First the VIX...
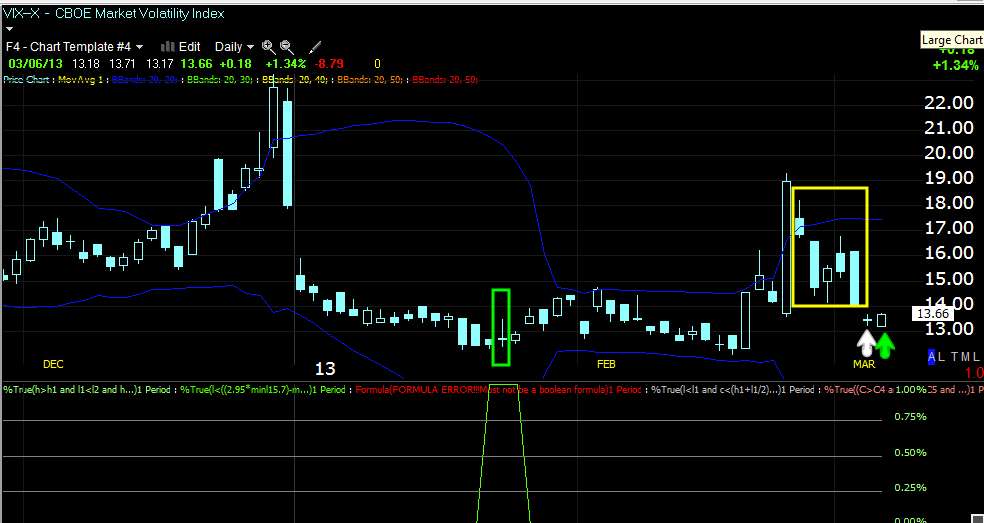
 Since my custom buy/sell indicator gave a buy signal in the VIX (green) it has performed pretty well, after the big move up on Feb. 25th, the next 6 days all stayed within a Rising 3 Methods bullish continuation pattern, yesterday's VIX broke below that, but did form a bullish morning star Doji, so far today with the open below yesterday's close and so long as we have a VIX close above yesterday's VIX close, we have a bullish reversal signal for the VIX and confirmation of that signal, which is bad for the market.

As for the VIX futures (ETFs-VXX, UVXY and XIV), they too are all moving in the right direction and building on the divergences.

VXX-VIX short term Futures...

 Intraday the 1 min VXX which trades opposite the market has a small intraday  min negative divergence right now, this fits perfectly with the ES/NQ 1 min positive divergence, so there's confirmation there.

 More importantly the 3 min positive divergence in the VXX yesterday has migrated to longer charts and is now leading positive on the 5 min as well as some longer timeframes, we also have the flat range as well.

 The leveraged version of VXX, UVXY also has a current 1 min intraday negative divergence which confirms the ES and NQ futures as well as the VXX above.

 More importantly though is the 3 min leading positive divergence from yesterday migrating to longer timeframes like this 5 min leading positive divergence and within a flat range.

 The 10 min chart is seeing migration as well and leading positive, this is what we want to see in a growing divergence.

XIV is the inverse of the VIX, VXX and UVXY so it should have exactly the opposite signals for confirmation.

 1 min intraday it is positive so that is confirmation of all the charts in the last 2 posts.

This suggests we will get our chance to short strength and buy weakness.

 However where it really counts, the 5 min chart is now leading negative, migrating from the 3 min chart from yesterday.

This 60 min leading negative chart is exactly why I want a longer term VXX long position open, I'd rather use the leveraged UVXY for short term trades, but I like VXX for a longer term position to take advantage of a spike in volatility on a market reversal.

So I'll likely be looking to add a little to UVXY long as a trading position and VXX long as a slightly longer position trade.

The most important thing about this post is that it confirms everything we see in the futures and maret averages thus far


Game Plan For Today

The longer charts, the important ones are pretty shot, they look really bad, at this point the short term charts are intraday positive, so strategically I want to short in to the longer term chart's weakness, but short term charts' price strength and I have an idea of where the averages are heading.

I'll be looking at next week's IWM puts as well as some equity trading positions and hopefully some core positions, this is mostly short, but I think there are a few long opportunities as well.

ES-S&P Futures
 The 5 min chart is what is important in taking the weekly options positions, but the length or size of these divergences also shows another shift in character so I want to look at longer term positions wherever they can be found at a good entry, low risk and high probabilities. For now, this is more or less our strategic view.

 The intraday 1 min positive divergence in futures I warned of about 15 minutes ago can be seen here and it looks like futures are already moving on this divergence, this is good for tactical positioning, yesterday's QQQ puts were at a 40+% profit the same day they were opened because of where and when they were opened, no one would say the Q's fell so hard that this kind of gain would be expected.

 ES's daily VWAP, I would say we are headed at least to VWAP, maybe up to the top channel, the higher we can get in, the better, this is the same concept used with yesterday's QQQ puts, enter on momentum to the upside before it fails, that's what gave the 40+% profit.

 NASDAQ 5 min futures are in a very large negative divergence, like i said earlier in the week, there's a change in character and that was earlier in the week, it's more true now.

 We have the short term 1 min intraday positive as you can see so I want to use price strength and underlying weakness to enter positions.


Again, the target should be at least VWAP if not higher, we still have a lot of time left in the day so hitting an upside intraday extreme like the upper channel would not be surprising and would be very helpful.

More Opening Indications

The move in the Dow yesterday and the signals from 3C yesterday and today both seem to be confirming exactly what I thought would happen on such a move, we were less than 100 points from hitting that high which is a drop in the bucket, as I said last week, "If it were me pulling the levers behind the red velvet curtain, I'd take the Dow up there and dump shares/shorts on the retail crowd that was bound to follow on the headline". 

In the meantime, the divergences are doing as you might expect and with the kind of consistiency and migration that was completely missing from the market early Monday, it has built steadily from there.

 DIA 5 min

 DIA 10 min with a deep leading negative divergence, this is a pretty clear signal that what I said above is happening.

 It's not only happening, but at a faster pace and greater size as this 30 min chart shows, that's a lot of migration to hit a 30 min chart so quickly with a leading negative divergence.

 IWM 3 min

 IWM 15 min

 QQQ 5 min

 QQQ 5 min within the trend

 QQQ 15 min-note today is worse than yesterday, why do you think that might be?

 SPY 5 min

SPY 15 min.

I'm going to show you the futures and what today's game plan is.

Opening Indications

Last night in this post, "Headline: Dow New Highs- Not a Surprise" I showed several charts such as the negative divergences in assets like High Yield Corp. Credit that was following the SPX in price, but was showing underlying weakness, the point was as I posted last night, "Bot everything is as it appears".

It's very early in the day and there's still a lot of moves in the market that are of little significance as far as analysis goes, they are more about profit opportunities, hitting stops, triggering orders, etc whether it be for something big like setting up positions and leaving retail holding the bag or whether they are simple profit from the bid/ask spread and order flow/volume rebates.

In any case, there are some interesting signs on the open that are a bit bigger than the typical a.m. games.

 On the open commodities have turned south vs the SPX (green), which is not a typical reaction for a risk on move, the driver of the move in commodities seems to be strength in the $USD.

 Here are commodities again this morning vs the $USD in green, note the $USD has moved up which pressures nearly every risk asset.

Here's the $USD vs. the SPY on the open, this is a lot more pressure on the market than we saw yesterday.

On the other side of that coin, the Euro is falling against the SPX, not a direct negative impact, but a sign of one as the $USD is likely higher with a lower Euro as we saw above.

 The Yen is still supporting the market as it is lower, this is what I said last night would likely be the pivot currency for today, perhaps the pivot asset.

 Here's a longer term view of the correlation between the falling Yen and the rising market, but recently the Yen has moved from a solid downtrend to a lateral move, it's changes in character that lead to changes in tend, a move up in the Yen will pressure the Carry trades and at that kind of leverage, pressure the market.

 The $AUD which is probably my favorite currency for leading signals bottomed first in a positive divergence and led the SPX higher, it was confirmed at the green arrow, but has since gone deeply negatively divergent with the SPX, this is one of the big red flags in the market.

As I showed, HY Corp. and Junk Credit that trade almost exactly the same, were showing 3C negative divergences yesterday, that seems to be showing up in price as Junk Credit falls this morning vs the SPX.

 For a new higher high in the Dow, the TICK chart is pretty mellow, it has been hovering around +600 and -750.

The TICK layout I created here shows the SPY with a negative TICK trend, you can see it on my custom TICK histogram at the bottom as well, there are a lot more signals, but I want to keep watch over the market, I'll post important developments as they arise.


Both ES and NQ are seeing intraday 1 min positive divergences now although they are not very big, so I'd expect an intraday move to the upside shortly.