Tuesday, June 25, 2013

$USD

The $USD is starting to move down from the early/pre-market spike up. Normally the market would head up on the correlation, but we've already seen the market/USD not responding to that correlation.

Mu initial guess is the $USD is showing a bit more price (not underlying) strength because of the US economic data coming in better than expected on thee whole today. Normally this would send the market lower by itself because of the F_E_D and QE3, however, if we are indeed at the start of the market move up that I have expected, then the $USD moving up on good economic data makes sense and the failure of the market to respond with a move lower would also make sense, it doesn't mean the correlation is broken, it just means both assets are temporarily moving according to different agendas or market forces (the USD responding favorably to good economic data and the market holding in a lateral position rather than dropping as it "seems" to be starting its run to the upside.

We will see shortly if the current dip lower in the $USD has legs and if the market will take advantage of that or at least intraday underlying trade will start to prime prices for a move higher.

Market Update... Still Rangebound

To be clear I don't see anything that has changed in any profound sense, for instance the 30 min charts whether the Index futures, Crude oil , The Yen or the $USD all have suggested a strong move, I think we are already in the early stages of that move, so as far as that goes, I don't see anything that is standing out or changing that view.

Intraday it has been choppy and more or less like a range, as I said, these are very dangerous as traders get bored and don't stay on their toes and these are often the areas where you have to be most vigilant.

That being said, the intraday charts are not being contradicted in any way, they are just as "Blah" as intraday trade is so there's nothing unusual there.

For instance as mentioned before, take a look at the TICK chart.
There was a short, early trend, but since it's just wide chop, mostly on the bullish side as TICK has hit +1250 and is around the -500 to -750 on the downside, so while this chart looks and feels like the market, a closer inspection does show better intraday performance among stocks in general.

I think this is probably a pretty normal consolidation, traders will get bored and take positions according to their beliefs about the market, that may in fact be what part of this is about.

I did say I noticed the averages showing better intraday signals, I also see HYG credit looking better, this doesn't rule anything out like a run to the lower end of the range, but it is these signals that will really give us a good idea of where we go next and about when (on an intraday basis), as I already said, the probabilities for the next identifiable trend continue to favor a nice upside move.

Even the VIX Futures look "Blah".

One word of warning, these markets that seem boring, can change VERY quickly. I've often wondered if they shouldn't be classified as a form of market manipulation by Wall St. or at very least, a market concept beyond the "Technical" description of "Consolidation".

Improvement in the Averages

Since the first market update, the mixed averages are all now showing improvement, there's still some mixed averages, but they are at least all moving in the same direction toward better looking intraday charts.

I'm going to check on some Leading Indicators as well as Arbitrage assets.

As far as the look of a choppy consolidation in the market, take a look at the 1 min NYSE TICK chart, it shows the same thing, lots of chop.

USO Update and P/L

This position turned out pretty well and I expect it will continue to move higher, but I want to take early momentum before it fades as I'd rather take the gains and re-enter the position if possible at a better price point.

Here's the P/L and then the charts.


+38% or about a $3500 gain

 A falling dollar should send USO higher and I do expect the $USD to fall, it's just whether I can get a better entry or not which I suspect I can if we chop sideways or pullback. Futures were part of the analysis as well.

The 3 min chart, among others suggests USO moves higher over the next (week or so I'm guessing) , however again we have an intraday negative and with a 1 and 3 min that usually means at least an intraday pullback, there's no sense in letting those profits slip away waiting when the position can be re-opened likely at a better price point.

Crude Futures (Brent)  5 min looks like a pullback or congestion as well

 The 15 min CL suggests the same.


The 30 min looks strong for a continued trend.

Not much moves straight up or down, there are pullbacks/corrections/consolidations/head fake moves, etc.

It seemed appropriate to continue with the "Hit and run" option positioning that has been so effective since we returned to that.

I'll be looking for a new entry, I will also note that the 30 min chart above would suggest that an equally strong move is coming in the averages, which just so happen to be positive as we already know on the same timeframe.

Taking Gains and Closing USO $32.50 Call

FX

FX is strange as well this a.m.

The last (nearly week) and last night I posted the correlation between the $USD and the market, this morning it is a bit strange...

In the "Pre-Market post" I said this about the $USD 1 min chart as of the time of writing (just before the open)...

"The $USD looks like it will have an early pullback effect on the market, but the 5 min chart is worse so that effect that is on the 1 min USD chart is capped and likely for the open."

Below is the $USD vs SPX 1 min chart...
 You can see the recent and normal correlation between the two right up to yesterday (USD is green) and the early strength in the 1 min $USD chart.

According to the correlation the SPX (red) should be moving lower, that's exactly what I said pre-market. The fact that the SPX has moved almost against the correlation, at first glance appears to suggest the market is a bit stronger than it should be (as the $USD up this a.m. normally means the market pulls back".

 This is the 1 min $USD chart, it looks like it will pullback soon, that should send the market higher, "should" but this is one of the curiosities in the market this morning as the SPX is not responding with a weaker move, but rather a stronger move.

The market's correlation with the 1 min Yen above is almost 1:1 meaning the market now tends to move with the Yen, this chart suggests early pre-market weakness in the Yen will soon see a move to the upside.

Both charts would suggest the market see some strength as the currencies react to their divergences, it is strange however that the SPX has broken ranks with this correlation that has been nearly perfect for a week, my first impression would be that the SPX is stronger than it appears right now, but I don't have solid objective evidence of that right now, as mentioned in the last update, the averages are a bit scattered. I'm going to try to see why that is.

Early Update

I know it's not that early, but as far as the market right now, it is early in determining what the most probable intraday path is.

Part of what is making it difficult is the fact that all 4 averages look different, most have the same general theme which I would say would most likely be an intraday or near term range, I can only guess at it, but as of now for an average like the SPY I'd guess between $158.50-ish and $157.

In a range we can get a good feel for what's going on. That is what I expect as of now. Certain averages look better than others like the DIA I mentioned last night, again this morning it looks better or actually good.

Ranges can be dangerous things as they kind of lull us in to a sense of complacency or boredom, but they are most often the area you need to pay the most attention to.

I'm going to continue going through assets and see if there's anything odd sticking out. There use to be something called the morning range traders used and it was very effective, an a.m. range would develop and then the market would break over or below it and you had a good idea of where the market would close based on that. I haven't seen that for a while, but there are quite a few common technical patterns recently that are popping up in strange ways.

For now, it's just patience and gathering information.

I'll post some charts shortly.

Gapping Up...

The "reasons" given for last night's move up in the SPX futures were supposedly a "rumor" which is the same rumor that has been floating for days, that the PBoC was going to inject liquidity in to their system, then the market momentum algos took over, the PBoC came out and denied the rumor saying liquidity was ample, but momentum already started and it kept going.

To me, this is the CNBC explanation, after the fact, grasping at anything that seems to fit because they don't have an understanding of how underlying flows work.

If this PBOC rumor was enough to move the markets overnight to gap the SPX up, why didn't it do so when it first appeared (I believe late last week)? Simply because the process was not complete. I said before the market even opened that the process should be over early this week, maybe as early as Monday afternoon, now that process seems to be over. I said on Saturday in the email I posted yesterday before last night's ramp that the normal catalysts would apply, but to expect F_E_D rumors to float to help start the market, we got even better, the two biggest F_E_D hawks were both out yesterday sounding like doves, no rumors, no Hilsenrath, straight from the hawk's mouth.

It just really bothers me when people give simpleton answers to a complex market, it doesn't do any of us any good.

In any case, we should gap up, we talked about this process last night in the Index futures, stocks, the $USD, credit, etc and expected it, here it is, do we really need to resort to recycled rumors that had no effect the first time to explain the markets?


ES 1 min..
 ES accumulating before the European open...

ES as of right now, it looks good, but I expect the normal a.m. volatility.

We have a rather heavy economic calendar today, that hasn't seemed to have any effect so far, so this is about something more than knee jerk reactions to rumors and economic data.

ES has now caught up to the 5 min chart as explained last night (as well as other Index futures).

The $USD looks like it will have an early pullback effect on the market, but the 5 min chart is worse so that effect that is on the 1 min USD chart is capped and likely for the open.

The 15 min chart I mentioned as likely to see more damage (USD) has overnight, so you can trust things that we saw and showed you days ago that are coming to pass as we expected based on objective analysis or you can believe in after the fact ,recycled rumors.

It really does matter as to whether you want to be kept in the herd or break free from the heard, think for yourself and understand the market (before it happens). It also goes to the issue of having objective data ahead of time you can trust rather than after the fact recycled rumors that do you no good at all.

Have a great day, it should be interesting as usual, but it is doing exactly what we expected based on objective signals and at the time we expected, even the catalyst we expected came true on the first day better than we expected.

Monday, June 24, 2013

Daily Wrap

I want to share with you an interesting email between myself and a member this weekend, in fact on Saturday. I had just finished explaining my view, the same I expressed on the site today, that institutional money isn't going to take large positions for a move to the upside, the danger of getting caught without a chair when the music stops is just not worth it for them, the point really was the same as what I said earlier, "Don't expect to see 15, 30 and 60 min positive divergences".

His response to me was:

"This suggests the bulk of the upside will have to come from a combination of upside biased HFT algos, short covering panics and, eventually, bulls jumping in long on the assumption the market has reversed. "

My response to this was the following:

"That's the obvious stuff, but I wouldn't be surprised if the F_E_D let a rumor slip, picked up by the WSJ that helps, remember they have a lot closer relationship than they disclose as evidenced by the minutes being emailed to 154 trading firms over a day early. They'd rather see them make money in the market than have to bail them out.

That's just one theory, but there could be numerous things along those lines."

So is it just coincidence that two of the F_E_D most Hawkish members came out today sounding like doves? It was Kocherlakota and Dallas F_E_D's Fisher.

Kocherlakota said, "There is a mis-perception in markets that the Fed has turned more hawkish."

This coming from a hawk! Fisher was also putting out similar dovish comments, again another major hawk. So was my weekend theory just a lucky guess, or does it really hold water? So far I have to say, I'm really surprised that this comment from Saturday has been as accurate as it has been, not Hilsenrath, not 1, but two F_E_D members and not doves, but the Hawks!

Time will tell on that one and I don't really think it will need very much time. This morning in the "Pre-Market Update", " I wouldn't jump to any conclusions to fast, "

Europe was down as could be expected after Asia, but a curious thing happened. Considering European stocks broadly were at lows for the year, you'd expect a flight to safety trade, but the Swiss 2 year yield jumped up over 10 basis points to a 22 month high (Yields move opposite the asset) so where's the Safe Haven trade today? I think al things considered, that's not only an interesting question, but perhaps not a very surprising development, money pretty much either flows to risk assets or to safe haven assets, there's what you might call a disconnect or a sort of dichotomy today.

In the U.S., it's hard for me to make the same comparison between say TLT (20+ year treasury bond fund) and the market because as I've been saying for well over a month, I think something big is happening in TLT and this is actually a position I was long and would like to be long again.

While I have no argument whatsoever with the market being "Done", in fact I said I thought it was done on May 22nd when we put in a One-Day Key Reversal (we haven't been able to make anything stick above that level for more than a day) and I've made the case for a lot longer than most with the charts to back it up, but things aren't always as simple as we suppose. We think the market is bearish, the market is about to drop like a rock and then we have expectations that it does so immediately, that's not how things work, so I would not judge this chart too quickly either, just as I said this morning when it was clear we'd gap down.

The daily SPX with a 100-day ma.a. and 2 strong bodied down days followed by a high volume (Friday) with support right at the 100-day, today's break below the 100 seems clean, technical text book, but this is exactly why I wouldn't pass judgement so quickly on this chart.

That was the exact same advice this morning...
We started the day with an overnight slide causing a nasty gap down, but after that the market didn't do much more on the downside, in fact it built a range and headed higher, the only late day resistance along the 10-min 100 bar m.a. at what I earlier called a bull flag- this wasn't a gap fill, which I'd feel less confident about.

Last night I showed you the 30 min negative divergence in the $USD, with the correlation the way it is now, that is bullish for the market in the near term, I will tell you though once you get to the heavier underlying flows like 60 minutes, it's exactly what I'd expect to see for a market on it's last leg (perhaps even pinky toe).

 The positive divergence I showed you last week and the week before in the $USD fired off just like 3C said it would, as you already know though, as it was doing so, the USD correlation flipped 180 degrees. That was then, this is now, a falling $USD raises the price of equities, Oil, most commodities and likely gold and silver as the historical correlation has been.

If you need to see the correlation with your own eyes, here you go.
This shows the mirror opposite or inverse legacy arbitrage (historical $USD) correlation since last week when it flipped, for goodness-sakes (I never thought I'd use that word), look at today's action alone!

Remember earlier I said the 1 min $U?SD chart was pretty much useless so I looked at the 5 min and said, "This is the near term path of highest probabilities, the $USD follows the larger trend of the 5 min $USD and falls" that's what allowed the market to make some upside gains off serious opening lows.

Following that logic as 3C divergences move from short to long and in a situation where the longer term is already in place, all they need to do is connect. So the 1 min moved based on the negative in the 5 min...
 5 min $USD

In similar fashion the building pressure on the 15 min chart should move the 5 min lower and link these timeframes up with the already leading negative 30 min posted above. That means a fairly significant $USD move down, you know the current market correlation, which just so happens to have confirming signals on the Index futures' 30 min charts as shown last night.

Interestingly, the same process described above for the $USD is playing out in the different timeframes in the Index futures like ES.

 ES 30 min leading positive, this is the highest probability, strongest trend for any upside move, it pretty much is capped here, but this can still produce a very respectable and scary move.

 The 1 min chart, like the $USD is almost feeling a gravitational effect from the 5 min, as the 1 min and 5 min strengthen, so does the 15 min which in turn pulls on the 1 and 5 min until the gap between 30 min and the lower timeframes is connected, this process shouldn't take long at all. In fact last night I said,  the following to give you some idea of what to expect...

"NQ 30 min shows the same, so in my view (same as last week), it's not really a matter of if, more when (which I think is just about anytime as the process is pretty advanced considering volatility) and the other question is "How", will there be a final head fake move, a gap up, something else? I'm pretty sure Wall Street isn't going to just make it easy unless they want to encourage retail to jump on the ship, if they make it easy, they are like the vampires inviting you to dinner, but we can still play the move."

 This is the 5 min ES chart, not only improving and exerting influence on the 1 min, but as usual, migrating to the 15 min, the connection is almost made.

ES 15 min

I don't want to make too many assumptions about what we see in Es's VWAP, but I can certainly see the argument made that this area that we have been seeing accumulation in since last week, could be considered to be confirmed by VWAP.
No market maker or specialist filling sell orders would have a job very long if they were filling at the lower ES S.D. and at VWAP as the best price. It could however be said that the middle man would be doing a damn fine hob in accumulating under VWAP, whenever the market moves to VWAP they work the bid/ask and maybe let out a little supply until they are at the lower S.D. of VWAP. 

As far as the late afternoon move today, do I think (by that reasoning) that's selling? I'd say if you looked at the divergences, where they started higher and how VWAP has been acting, I'd say this is the start of a move and not distribution at the upper S.D. of VWAP, for any price move to begin it has to cross the upper S.D.

So that's interesting too.

HYG (Credit) as well as the illiquid High Yield Credit and our sentiment indicator HIO (to a degree FCT as well) weren't leading the market lower as they'd usually do when a move lower is coming or a leg lower, they were nearly in lockstep with the SPX all day, for that matter, so were treasuries, but again I think something bigger is going on there and I think they'll head significantly higher so any chance to add to them down here being taken wouldn't surprise me.

In FX, the Euro and the $AUD were at least supportive intraday and moving closer to the correlation they use to have many, many months ago, in some cases they are leading the market a little so there's some supportive behavior there, although not jumping off the chart.

Yields also remain supportive and are at one of the larger dislocations they have been at. As a reminder, yields act like a magnet for equity prices, they typically revert to the mean and meet up with each other, that could happen by yields falling, but as I already said, most often it is yields that act as the magnet for stocks.
Yields in red and the SPX in green.

I've seen some people since the market close (mostly on Worden chat) noting that commodities were not showing the same relative strength as the SPX, or they were not as supportive as one might expect, but as we already know the $USD is going to be the main driver of price now, not the USD/JPY like this time last week. If we look at commodities vs the $USD, commodities acted EXACTLY as they should have today, there's no point taken away from commodities relative performance vs the SPX.
Commodities in brown and the $USD in green, a nearly perfect inverse (legacy arbitrage/historical ) relationship.

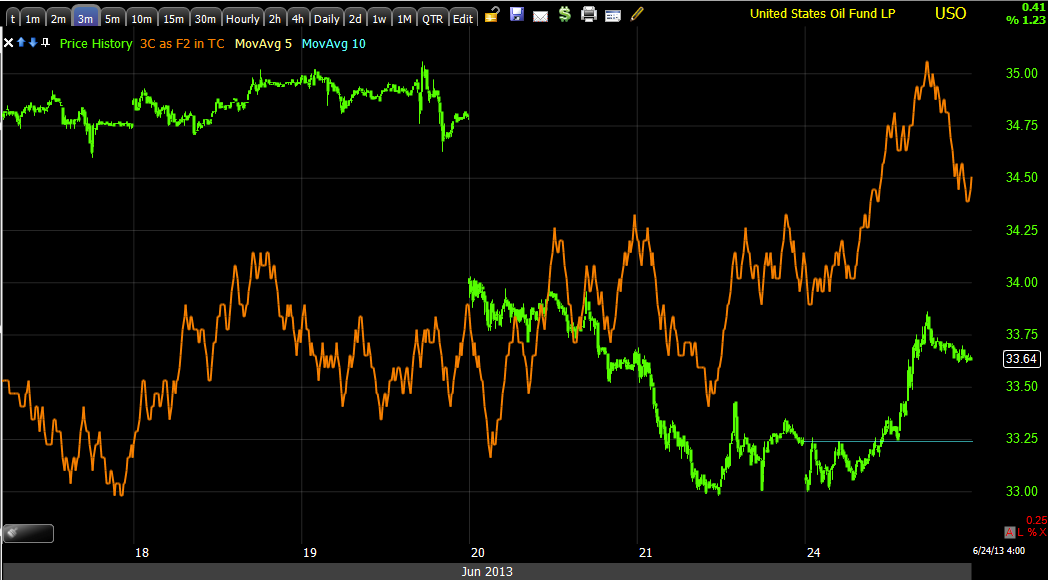
If I replace commodities with a specific commodity, oil (USO we see the same relationship occurring...
USO (brown) vs the $USD.

If we take that a step further (as you know I really liked what I saw in USO today)...
 USO 1 min

Migration through USO 3 min

A pretty strong 1-day move in USO 10 min.

If these divergences fire off and we have no reason to believe they won't, what does that tell us about the tight correlation of USO with the $USD? It tells us the $USD moves lower as the $USD futures show (and were shown last night) and what do we know about the market's most recent correlation with the $USD? It's inverse or opposite, therefore following the logic leads us to higher USO, lower USD and higher....SPX.

If that chain of events is correct, then we should see it in the averages, I didn't draw on these at all and remember I didn't expect to see much past 5 min, maybe 10 min here and there, but nothing in 15 min+.

(large 1 day moves on a 10+ min chart are indicative of strong last minute accumulation)

The DIA has been one of the standouts surprisingly to me, this is a 15 min leading positive, but the real story is the move in 3C made today alone.

The IWM 10 min is also leading positive, you can see where it went negative (distribution) before prices fell.

The QQQ 5 min isn't as strong of a timeframe, but the divergence certainly is strong and long enough to be a serious contender.


And the SPY 10 min leading positive, again the main story here from a 3C perspective is the speed and size of a 1-day move on a 10 minute chart.

The overall message is that which we'd expect from following logical correlations should show certain divergences in the averages, there they are, they're in the Index futures as well.

I'm not going to chase down all these stocks to make the point, but they are in the bellwether stocks as well. As I showed you earlier today, AAPL didn't see that much volume on the break below the two triangles, it did see it on the break below the psychological level of $400 which I posted about before it happened today, look what they did with the volume (and this speaks to the NDX-100 because of AAPL's weight).
Not only did the 10 min 3C chart fly, but the volume that hasn't bee there for a stock as large as AAPL, showed up today below $400.

That's going to be it for now unless I see something crazy in the futures. As I said, the market is not going to make it easy for anyone long or short. If you were short this morning then you started off very excited and then grew more and more worried as the day went on, I felt it as I closed half of a +22% gain in a core short, IOC; when I closed IOC it was down over 7% intraday, it closed just over -5%, so I made the right move at the right time. The point is, the market will try to scare and shakeout longs and shorts alike, those guys on Wall St. have expensive cars and homes in the Hamptons as well as some things I won't mention here, to pay for, it doesn't matter to them where the money comes from, it's a zero sum game so taking it from longs or shorts is irrelevant.

I'd just remind you of the volatility, just like this morning and today's market, "Don't judge too quickly), including the SPX just under ,the 100 day and try to make decisions and analysis objective, not emotional which is as subjective as you get. You get paid to take risks, they should always have probabilities and an edge, we aren't gamblers, but it's not really accurate to assume everything moves as you expect (actually it may move as you expect, just the way it does it may throw you for a loop).

Right now, the intraday 1 min ES and NQ futures are leading positive, the $USD is leading negative and the Nikei futures look decent right now.


Final Update

After looking at the charts, L.I's, and especially 3C and TICK, this move looks like a REAL (believe it or not), consolidation (bull flag).

That would be the flag on an intraday 5 min chart of the SPY. I can update my system and get the internals and have a better idea.

The closing candle is a star after a hammer with decent volume on both.

The DIA's closing candle was even nicer looking,a Doji on increased volume (which isn't surprising as the DIA actually looks even better than the other averages.)

The Q's and IWM both put in Stars with nice long upper and lower wicks. All of these candles from the last 3 days in all of the averages are a perfect break under the 50-day moving average which is easily the best known average, even for new technical traders, this is the place most consider an asset either a buy or sell and interestingly the volume looks exactly how you might expect for a break under the 50 m.a. and the 3C charts in the area look like I would expect them considering everything else.

 The daily QQQ with a 50-day moving average-note the volume as price is under the average.

Now I tried not to draw on this chart, except to highlight the last 3 days.

QQQ 5 min 3C during the same period.

If you recall in an earlier post my, "Thinking like a crook" section, it's really just understanding the logistics and difference between trading 100 lots and institutional size positions, they have to do a lot more than just decide what stock they want.

I'll have more after I look at the updated  data and hopefully after I see futures