Tuesday, October 8, 2013

Bounce / Trading Positions

I was going to cover several different assets each in their own post, but they're all moving so fast I need to put them in one post.

These all look good for at least a leveraged long position and they may in fact be position for a much wider move.

Here are some examples:

 FAS (3x long Financials- I already have a trading position opened here).

XLK or the Tech sector, TECL is a 3x leveraged long ETF for TECH.

AMZN, although it looks pretty good for a bounce, I'd rather look at bounces in AMZN as potential shorting opportunities rather than playing it on the long side for short duration long trades.

Goldman (GS) looks like it has a good bounce in it.

URRE on a longer term is looking really strong on this 30 min chart, I don't want any kind of leverage , just URRE long.

The SPY 5 min is now seeing positives, so positions like UPRO (3x leveraged long SPY) might be an option if you prefer to stay away from options.

 ES/SPX Futures intraday 1 min is looking much better, the 5 min chart has held up all day.

ES 5 min, as seen last night we had the signals for pullback/consolidation Friday at the red arrow, late yesterday the start of a turn around since Friday's signal, that lasted through the night and today the signal has stayed in a positive divegrence.

I looked at the weekly performance of the Core Equity positions (almost all shorts) and they are still running around  7 Times better relative performance than the market, as ween below on the weekly performance...

That's #17 of 1018 competing portfolios with an 11.36% gain for the week vs the SPX's 1.71% loss, remember since most of the core positions are short, the portfolio should be green with the market losing ground on the week.


I think I have enough short term long positions to hedge any draw down in the core shorts, but I may add to the short duration long positions if I have room, if the signal is really attractive and feel it's not excessive risk.

XOM Trade Follow Up / Add-To

I opened a call position in XOM last week, November $85's that are still doing ok at a -10% loss which isn't bad for calls from last week. I thought of adding to the position as I entered at $2.44 and they're around $2.19 now, but for the room I have left, adding doesn't make much sense, however you may like the position which is for a short term position only.


We've had good experiences thus far trading XOM, the last call position was set up at the white "C". you can see previous gains from calls and a core short that was covered for the time.

I went over XOM here...

This is what XOM looks like now...
 The 2 hour chart showing XOM from a core short to covering the short on some accumulation and opening a call the same day as I expected a counter trend bounce, it looks even stronger now, but ultimately I'm really looking forward to adding XOM back to the core short line-up, I just think that will be at higher prices.


 1 min chart positive

3 min positive & the 5 min is starting to go positive as well.

Even though it needs an intraday reversal process, that process doesn't need to be very long, it can easily complete today in the next hour.

The XOM 30 min chart shows a range, a leading positive divegrence in that range so as I mentioned earlier with another asset, this is like an explosive upside move just waiting to be unlocked and the key is the intraday charts in the 1-5 min range.

If there's an extremely low entry and extremely strong 1-5 min charts, I may add to XOM, but in general I have very little problem with starting a speculative trading position, but in my view it needs leverage.

ERX is an ETF that would be similar, Energy with 3x long leverage, I do however like the XOM charts a bit better.

Market Update Charts...

So far as of this writing, the $AUD & EUR are moving in to positive divergences although it's early. The $USD is seeing price bump to the upside, but doesn't have very good 3C support on an intraday basis, but has excellent support where it really counts, the 15min - 4 hour charts, that's what counts moving forward. Intraday the Yen hasn't seen a negative 1 min divegrence, but again where it really counts out at a 60 min chart, there's a strong negative and this is what helped the market last night, this is the only real help the market will get moving forward it appears.

As for the averages, they are starting to get their intraday act together...
 SPY intraday

SPY 2 min

DIA intraday 1 min

DIA 3 min

QQQ 1 min (I will get a full set of QQQ charts out, as the Q's and IWM have held higher ground the longest, they have some of the worst looking underlying trade because they have been in great position to distribute in to).

QQQ 2 min

IWM 2 min

SPY TICK Chart is improving, this isn't a slam dunk yet, but it's decent improvement on the day.

The NYSE TICK channel for today is pretty defined, just draw in the trendlines and a break above them will spell a change in character intraday


Market Feeling Around for an Intraday Bottom...

Charts coming, maybe some quick trades.

NFLX (Core Short) Follow Up

Yesterday I put NFLX up yesterday because in my view...

"NFLX did everything it had to do to form a great double top in the new technical analysis.Looking at NFLX, my judgement tells me there's probably a little better entry, my gut tells me, "Who cares?"

 This is the gist of yesterday's post, the head fake double top which is an excellent long term core short entry with very little risk as stops can be placed just above recent highs, although I prefer a little room.

The Core Short Position in NFLX is nearly filled out, but I'd love to add a little here if I can, I just don't think the risk management parameters will allow me to add much more than maybe 10% of what's already in place.

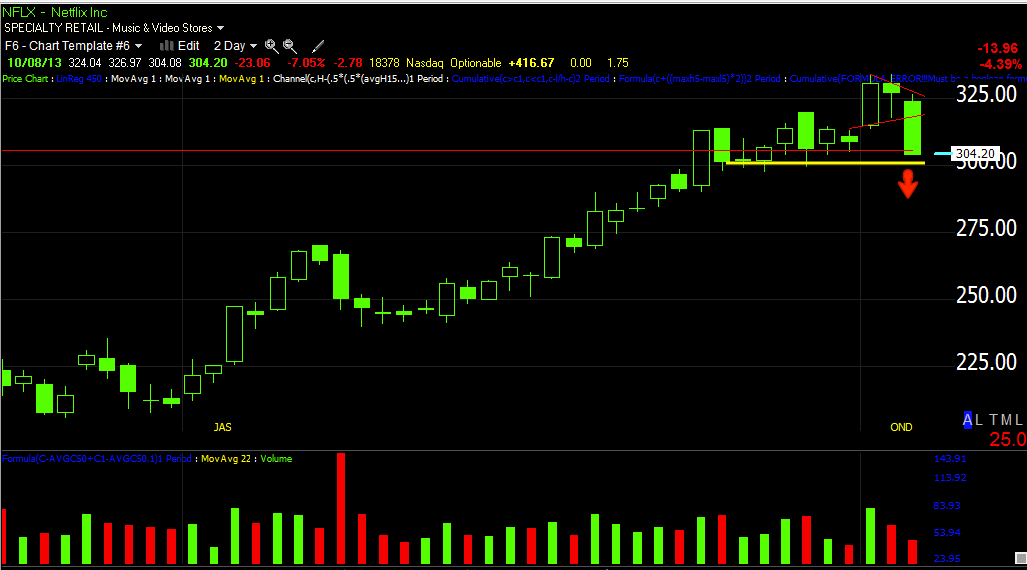
I wouldn't want to chase NFLX here today on a 4+% move down, but I'd say generally speaking, any position or add-to ABOVE $300 is a decent area for the long haul which is what these core positions are meant for, trending trades.

This is the triangle that formed yesterday. Once again, Technical traders get taken for a ride, the sym. triangle has no inherent bias, it depends of the preceding trend which was up, so it becomes a consolidation / continuation pattern that technical traders expect to break to the upside, this one clearly did not which is what manipulation of Technical traders is all about. Sometimes there's a head fake breakout move to suck in more longs, sometimes there's a Crazy Ivan that will break on both sides of the triangle to clear all orders, both limits and stops before moving down. The fact there was a triangle right above the double top, was why I really didn't care if there was a slightly better entry (which there was after NFLX was posted yesterday. 

Symmetrical triangles were published at least as early as 1948 in John Magee's "Technical Analysis of Stock Trends"  that is now in something like its 10th edition, it's pretty much the text book of T.A. that most everything else derives from although Charles Dow did Technical Analytical work in the late 1800's that others added to.

 Since most stops around the $300 area have been cleared several times, it will probably take a move a bit lower to hit some of the stronger hands.

I'd consider NFLX a short on any bounce above $300. The $318 area looks interesting, I'd also leave a little dry powder for a move above $328.50, not a lot, but some.

 NFLX charts yesterday looked horrible as they do today...

but there are still a couple that haven't been completely destroyed so there's still a chance for a decent entry on a bounce.

 It may look something like this... If it were me steering NFLX up here, I'd go for the stops just under the $297 area, but it already looks like quite a few are capitulating just on fear...

This is broader selling, there's no specific spike at a price level so I don't think it's stops, it looks more like fear or capitulation.

After I hit stops under $297, I'd take NFLX (with all the shares I accumulated on the cheap under $300) and bounce it up to at least $320, ultimately over the next few days if I could get it above $330, that's where I'd take it...Just thinking like a crook.

They'd need to distribute shares picked up on the cheap on the way up, I'd expect a large portion to be distributed right above $300 and then the rest the closer we got to the apex of the triangle. I'M SURE THE BULK OF THE INSTITUTIONAL SHORT IS IN PLACE LONG AGO, THIS WOULD JUST BE A CHANCE TO AVERAGE UP THE ENTRY PRICE A BIT.

The 4 hour chart continues to fall apart so I don't think it will be much longer before there's irreparable damage, actually I think we are already past that point.

Keep an eye on NFLX, I'm setting some price alerts and see if I can add, being there's so little room (if any) to add, I'll be looking for the best area possible which is close to the apex of the triangle.

In my view, AMZN and NFLX are two shorts at the top of my list.

Index Futures Held...

Es...
 These are all 5 min charts of the Index futures, I only notated Es (SPX futures), but each Index has the same signals at the same places (Friday afternoon negative, late Monday starting to go positive, overnight futures going more positive and all of them holding up so far through this morning's a.m. trade).

 NQ 5 min

TF 5 min

Now the averages need to do the same, there are good long term signals that raise the probabilities that the intraday charts will be positive like this increasing 30 min SPY (formerly only positive to 15 min)...
The chart above shows the weaker accumulation of the week of the 23rd until that Friday and stronger since. I look at a chart like this as a sort of treasure chest that has a strong amount of momentum and surprise locked away, the intraday charts from 1-5 min are the key to opening it.

FX Engine

I posted it so many times and I swore yesterday I wouldn't post it again so I won't...exactly, but by now you know Friday's EOD analysis said to look for early consolidation this week which I qualified as Monday, weakness is not the same as consolidation although when looking at price alone it appears to be, say if you took the Dow's close yesterday of -136 points. I figured by late Monday we'd start seeing some improvement, we saw some, but very little until after hours or more appropriately the overnight futures session.

This is last night's Midnight Futures Post...

"As far as currencies go, all of them held up in to the close ($AUD, EUR, even the Yen and USD) vs the SPX...I talked about the USD/JPY former carry pair looking like it would reverse to the upside soon and provide the market some support"

So this is what happened last night after I posted the above...
This is what the 60 min Yen looks like, as I explained yesterday (and many times before as a general concept) and last night....

"For the USD/JPY to help the market it must rise which means the second ticker in the pair, the JPY (Yen) must drop and it is showing a  5 min negative which is good for timing if there's a longer divegrence already in place... This 60 min Yen (I mentioned as being negative today which was a big move from the 15 min chart) is very significant for the pair as they have a lot more influence than most traders realize on the market averages."

The 60 min Yen was plenty negative and the 5 min was a good timing indication of a move, here's a closer look at what happened...
This is the Yen in candlesticks and ES/SPX futures in purple on a 5 min chart. The overnight decline in the Yen boosted the carry pairs like USD/JPY (AUD/JPY & EUR/JPY) and sent ES futures higher.


From last night's post...

"The $USDX 15 min chart not only went positive at the week's lows, but reversed price and headed higher and we are still leading positive suggesting more, which should move the currency cross and give the market support. All of these smaller events have to be examined for trends and when patterns start confirming, you start to get a higher probability composite picture."

The USD/JPY gained ground overnight from Yen weakness and $USD strength, this in turn sent ES/SPX futures higher...

This is a 1 min chart of the USD/JPY in red/green candlesticks and ES/SPX futures in purple and how the carry cross lifted the SPX futures as expected.

Other Carry crosses were lifted as well, all helped the SPX futures overnight (or broadly the Index Futures).

So the strength we started to see developing in Index futures last night as per the midnight post...

" Today 3C is in line as the consolidation takes place and tonight we have our first positive divergences since Friday's EOD post calling for early week, short duration weakness...5 min  NQ / NASDAQ futures were negative in to Friday and in line today and are showing the first hint of a positive divegrence ...TF or R2K Futures  Show the same distribution Friday leading to the consolidation/pullback prediction or analysis is probably a better term, today and tonight we have the first sign of a transition and it's on track with Friday's EOD analysis."

 ES 5 min chart with a stronger 3C positive which started just after yesterday's close.

ES 15 min leading positive divegrence which started around midnight last night...

NQ/NASDAQ futures 5 min chart positive around midnight last night...

And a strong 15 min TF/Russell 2000 leading positive divegrence that has strengthened since midnight.

Essentially the USD/JPY and other carry crosses, gained last night largely due to JPY weakness, which in turn lifted the Index Futures as was expected.

However, for now, this is what some of the currencies are looking like in early regular hours trade.
 The Yen slid overnight, but the intraday 1 min is positive, this puts the brakes on the carry crosses that helped the market overnight, but it is still a 1 min intraday chart.

You can see the divergence showed up in the carry cross of USD/JPY which lifted overnight...

However the bottom line remains...
 The longer term $USD remains positive

And the longer term Yen remains negative.

So all in all, this morning's trade is not much different than we'd expect, but underlying trade in the currencies is an engine for the market averages that have not only held up in price, but are looking better and better in underlying trade.

Now it's just a matter of regular hours trade showing the same kinds of improvements and usually we have to wait until after a.m. trade which is full of manipulation to hit orders and stops before we can verify the likely probability. A.m. trade should burn off soon...

Just Finishing Post

Just wanted to check in and let you know a post is on its way, I had to check and recheck the charts and capture quite a few.

So far the market may not seem like much, but it opened again in the range, that's something and there's a few other things. The next post will show you what the first of those was and I feel pretty confident that as I start the next post, the charts I see just starting to confirm in regular hours, will have done so.

It looks like the analysis that started Friday afternoon for this new week and continued yesterday and last night, is right on track.

Midnight Futures

It takes a while for futures to settle in after the close and AH trade, I check throughout the night, but usually by this time there should be something going on.

As far as Friday and I won't post this again, the Late day market update called for continued consolidation early this week (Monday) and that could be either through time or through price, honestly though with the negatives we had Friday (beyond 1 min), the consolidation is almost always going to be through price. I thought because of the stance of the 5 min chart Friday that the consolidative behavior wouldn't last long (as in most of the week) so today did pretty much what we called for based on Friday afternoon's signals. On the other hand, I wasn't particularly impressed with today's late day action, but timing something to the exact half a day is pretty tough. 

What drives me nuts is the Financial media or media in general reporting that the market did XYZ today because of XYZ, not one mentioned the doubling of Interactive brokers margin from 50% to 100% in two days, of course I understand that the majority of listeners wouldn't understand what that means and they have to dumb it down, but I just hope more sophisticated traders can make up their own minds and not fall for the dumbing down of Americans when it comes to Financial decisions.

Whatever the market was upset about today, you can be sure by this post from Friday, that it had already telegraphed it Friday and as nothing economic or on the government front happened today, you just can't blame that for today's action, especially when it was telegraphed before the bell even rang today.

In fact, in my estimation, there hasn't been any significant change away from the consolidative behavior today until tonight's futures and those are just getting started. You might ask, "Consolidative? The Dow was down 135 points or -.90%!?!?" However, when looking at the SPX we didn't make a lower low or new low for the consolidation area, the NASDAQ 100 closed within Friday's real body (above the open) forming a bullish Harami,  the $COMP stayed within the range and didn't make a lower low as Thursday is anchoring the range, the R2K was above Thursday's range low, as was the NYSE. While a nearly 1% drop sounds bad, it has to be put in context and from last Monday the SPX is only down -.33% (one third of a percent for the last week), the NASDAQ is even less at 0.09%.

Again, we take the information as it comes and do the best we can with it, but this is a really difficult area to trade and make money with any consistiency for the last week so we've been a little less aggressive.

This is the range on a four hour chart since last Monday, as you can see the trend is "lateral", literally sideways chop which is a very difficult environment to make decent trades in that don't need to be watched as if you were a day trader, but nothing lasts forever and it seems to be part of a process.

I thought there were some interesting candlestick patterns and just because they weren't absolutely text book doesn't mean the concept of the textbook version wasn't there and it doesn't mean it wasn't effective. Technical traders often suffer from thinking the market should look like that one cherry picked example they see in a book when in the real world you'd be lucky to see such a clean example 1 of 100 times, it's the concept that is important.

At #1, we don't have an official Harami bearish reversal and it's not an official "Hanging man" negative reversal, but it was close to both and had the same effect, a downside reversal in the range. At #2, that isn't an official "Falling Three Methods" bearish consolidation/continuation pattern, but the effect was the same and the 4th candle was the EXACT outcome the price/candlestick pattern should produce. #3 Wasn't a perfect bullish Harami reversal or even star for that matter, but again, the concept was close enough for it to be effective. #4 was "almost" a bearish Harami reversal or "almost" an "Evening Star" bearish reversal, but again the outcome was the same. The main point is momentum on the upside was very strong, the next day not only did momentum in the size of the range fail, momentum from open to close and lack of a follow through close failed as well, the market went from strongly bullish to indecisive and that's generally where reversals occur. Physical momentum is the same, as it wanes, it makes it much easier for a change in direction to occur.

As far as CONTEXT goes, I said that I thought we'd see some improvement (relative to early trade) in the afternoon.
There's no large 40 or 50 point dislocation, but there's a clear change of character and it takes place largely toward the close and overnight trade so lets look at the Index Averages.


 5 min ES / SPX Futures are negative in to Friday afternoon just as the averages showed and thus the afternoon EOD Update's directionality for the start of the week. Today 3C is in line as the consolidation takes place and tonight we have our first positive divergences since Friday's EOD post calling for early week, short duration weakness.

5 min  NQ / NASDAQ futures were negative in to Friday and in line today and are showing the first hint of a positive divegrence on a significant timeframe (1 min isn't significant overnight for futures).


5 min TF or R2K Futures  Show the same distribution Friday leading to the consolidation/pullback prediction or analysis is probably a better term, today and tonight we have the first sign of a transition and it's on track with Friday's EOD analysis.

Treasuries confirm Friday's analysis as well as today's fulfillment of that analysis.
 Treasury (30 year) futures have been moving opposite the market so a positive divegrence Friday leading to price upside today fits perfectly, tonight's signs of distribution are right on time as well

The 15 min chart shows the same thing, accumulation Friday (as it should be the opposite signal that is showing up in Index Futures) and a negative divegrence tonight and this is a more significant timeframe.

As for the Nikkei 225...
The NKD 225 Futures are not screaming upside, but the 15 min chart has a decent process in place with increasing accumulation.

As far as currencies go, all of them held up in to the close ($AUD, EUR, even the Yen and USD) vs the SPX, so it seems likely that Interactive Brokers margin hike of 200% over 2-days was likely the culprit in today's late day trade. I'm not saying the market would have had some positive or even green close otherwise, it's just helpful to know what fundamental events transpired and if they are transitional or trend changing, I'd call this one transitional.

I talked about the USD/JPY former carry pair looking like it would reverse to the upside soon and provide the market some support, here are the charts for $USDX and Yen Futures.
 For the USD/JPY to help the market it must rise which means the second ticker in the pair, the JPY (Yen) must drop and it is showing a  5 min negative which is good for timing if there's a longer divegrence already in place.

 This 60 min Yen (I mentioned as being negative today which was a big move from the 15 min chart) is very significant for the pair as they have a lot more influence than most traders realize on the market averages.

For the pair to make a move higher though, it takes two to tango, the USD being the first ticker on the pair must rise.

The $USDX 15 min chart not only went positive at the week's lows, but reversed price and headed higher and we are still leading positive suggesting more, which should move the currency cross and give the market support. All of these smaller events have to be examined for trends and when patterns start confirming, you start to get a higher probability composite picture.

As I said and I will show you the NASDAQ 100 tomorrow because it REALLY looks horrible, it will be near the top of my list for assets to short when the time is right, which is not far away and I may even look at a short position even sooner with some kind of hedge to protect the position in case it's a little early. At this stage of the market, I think it's not such a bad thing to be a little early as long as you have allowed enough room on your stop. 

By the way, the new site is nearly finished and this is what one of the new additions will look lie, the RISK management calculator that gives you the stop for the 2% rule as well as the maximum percent of portfolio position size.
 You put in your portfolio value (all data is private and can't be seen by anyone including me), you put in the cost of the shares, your intended stop and your maximum position size as a percentage of portfolio, I usually use 15% which is the only real protection against gaps. As a general rule, I wouldn't invest any more than 20% of portfolio in any one stock, I prefer 15%, that's plenty of diversification. By law, Mutual funds can't put in more than 5% of portfolio in to any one position meaning they have to have at least 20 positions by law, which is a performance killer or over diversification in my opinion.

Then chose long or short trade and Hit the submit button and...

You get the number of shares the 2% rule will allow based on your portfolio size, the cost of the stock, your stop, etc. You also get max position size, the lesser of the two is your max. shares. The wider your stop, the better chance your trade works, but the fewer shares, the tighter your stop, the larger your position size can be, but sometimes a tight stop can allow for 100% of a portfolio to be invested and we never want to do that so there's the maximum position size as a percentage of portfolio rule as well. There are a lot of other new features and resources that I'm really excited to share with you.

In any case, the point being that today as mentioned several times during regular hours, I was not impressed by afternoon trade, it looks a bit better in the overnight session, but that needs to stick in regular hours. Leading Indicators were no exception, but there were still a few interesting signals.
 Yields are for the first time for only the second time in this range, leading positive.

 Commodities are showing some relative strength vs. the SPX.

Here's a close look.

And while HY credit is not making the same intraday higher highs it was making last week, it is still positively dislocated and leading the market which is a little rare for HY credit, but it has been a great leading indicator in the past.

So that's about it for now, we'll see if the overnight futures solidify in to tomorrow, that would be about the right time as far as expectations from Friday were concerned. Not much happened today that alters that in any meaningful way.

As I did say though, I do want to show you the NASDAQ 100 and just how bad it looks, you'd probably not think so based on price action relative to the Dow, but it is really looking bad. There's a chance it improves for the near term, actually I think a decent chance, but there's such significant damage already done that it has to be near the top of the short list.

I'm not up[dating futures again tonight, but I will in the morning.

I may also show you some more features of the new site which I'm really excited about, we've actually been working very hard on it, although it has taken far longer than I suspected, I think ultimately it will be worth the wait.