For the Dow making a new record close (there's still an intraday high it hasn't taken out from September 18th, the last F_O_M_C knee-jerk reaction which was also the high before the market headed lower the next day, that's just about 28 points higher) on the lightest volume of the year excluding holidays, a lot of things seemingly had to happen and there was a lot going on.
You probably know about NASDAQ's blackout (doesn't it make you wonder what will happen on real movement and volume?). I can't say the NASDAQ blackout was beneficial to the market or not with all of the other correlations, but here's what happened
NASDAQ 100 in green and the SPY in red.
I thought as recently as this morning I had said the Dow was the laggard in not having made a new high (I know the NDX is not technically a new high, but it's as close as we are getting), that's a very obvious target...
That's just too obvious a target and while the closing high was surpassed, the intraday high from the last F_O_M_C policy statement (Sept. 18th) with associated knee jerk reaction that lasted 1 day, is still about 28 Dow points away.
The thing about a new closing high and it being an obvious and juicy target is that it's a confirmation move and technical traders buy breakouts on confirmation, technically today was one,
but there was no volume to be found, I can't distinguish the break to the new high looking at intraday volume.
The point being is there's no strength in this market, yesterday we had 3 of the 4 averages in the red and very near break-even and the SPX made an all-time new high on pathetic volume and a 0.13% price increase.
As I was saying yesterday, if we saw that 10-years ago we'd be running for the hills. Today we had all the averages in the green at new highs on the lowest volume of the year, but the R2K spent more than half the day in the red until it had put together an afternoon positive divegrence which could be seen pretty clearly whether looking at the Russell Futures or the IWM and in the same post, the SPY Arbitrage was activated as the carry trades all started failing and none recovered through the close which was evident by 2-2:30.
It's the "silliness" I was talking about, VXX, HYG and TLT where used right as the last of the carry pairs (USD/JPY) failed, that was just about 2 p.m. when the SPY arbitrage came online as the VXX dumped and HYG pumped as can be seen in the linked post above.
The Dow however got as helping hand from something at least semi-organic and real, that was IBM's $15 billion (additional)
buyback.
This is the Dow-30 intraday in an ascending triangle just as the IBM news broke.
In case you are wondering, the Dow 30 is not equally weighted among all 30 stocks, just like the NASDAQ has their own proprietary schedule. IBM happens to be the #2 most heavily weighted component of the Dow-30
HYG being among the 3 assets in the SPY Arbitrage iis also the most influential even on its own, it had actually been underperforming all day until it was called up right before 2 p.m. and once again on the closing ramp.
There it is being called up for the SPY Arbitrage above and once again for the close. Since Junk Credit trades almost exactly alike, but has no market correlation for intraday manipulation, I wondered if it too saw either of these two ramps and it didn't.
Of course since TLT was already down on an expected pullback it was in place, only VXX needed to be moved...
The first plunk in VXX (actually at 2:11, I was close with the slider)...
And the second may have been a natural correlation rather than part of the ramp, but note that VXX
refuses to make a lower low as the SPX made a higher high, that's not a normal correlation.
Comparing spot VIX to VXX (short term VIX Futures) you see even more silliness than earlier today when I first showed you.
In red is the Arbitrage asset VXX and in green, spot VIX, look what happens before 2 p.m. and then in to the rest of the afternoon, spot VIX rises.
Both sentiment indicators are divergent again, one particularly at the ramp close.
Sentiment 1 dislocating from the SPX
Sentiment #2 diverging from the trend and especially at the closing ramp.
Yields which have been an excellent leading indicator also were on the move as mentioned earlier.
Shorter term intraday Yields disconnecting with the SPX, Yields lead the market and tact almost like a magnet for prices.
This is a longer term view of Yields v the SPX, they lead positive to the left before the SPX, the led negative at Sept 18th highs and led positive at 10/9 lows,
although the size of this divergence makes it very hard to see, it was actually a very clear leading indication and of course now they are showing the worst leading negative indication, I doubt they'll fail "this time".
One other Indication I checked was the Most Shorted Index I maintain of R3K names and create an index vs the Russell 3000...
The MSI is in red, the R3K in green, not what I'd expect. However I will say that many of the trading shorts, nearly all (and all have at least 3x leverage) aren't down more than 3%, some even less than that.
I hate to borrow a chart from someone else, but if it gets the point across that' what matters.
Probably the biggest problem for this move/cycle off the 10/9 lows is credit, it's as simple as , "Credit leads, stocks follow" and credit is not biting.
I don't thin the market gets around this. The diagonal line that looks like a short squeeze in the market was expected to behave that way until today, however today you can see there were a number of saves deployed, I'm guessing the ultimate target was the new Dow high, but there was nothing for them up there, no volume, no buyers. We have insane margin and the lowest volume day of the year.
Even HYG which seems to be used more and more on its as the algos read is as institutional risk on, was already accumulated and ready long before 10/9 is now seeing massive distribution.
HYG distribution...
I know Bernie is up tomorrow and I have no idea what he'll do, all I know is Monday we had a $5bn Open Market Operation and that resulted in the Dow-0.01%, the SPX +0.13%. the NDX -0.03% and the R2K-0.37%
When I look at the charts above, I look at the long term charts of many of the same, the 3C charts, the change in market structure as HFT liquidity can disappear instantly and the massive margin at all time highs on all time highs and the lowest volume of the year, and the markets breaking down nearly every week now with really nothing stressing them... this just smells like opportunity, opportunity, opportunity for those that sit right and hit it right.
As for AAPL and the December $535 Puts, I closed them not because of any gains, but because of something else I saw.
The P/L was essentially break-even...
With a cost basis at $28.25 and fill at $28.40, with transaction costs it's about flat.
Remember the IWM has just put in an intraday positive divergence and AAPL had one all day.
This intraday positive had been in play earlier in the day, the IWM's intraday positive just blasted off intraday and I just wasn't willing to take the chance when there's a half-way decent chance the divergence fires, sets off my price alarms and I can re-open the position at higher levels, lower cost and less risk including opportunity.
I did note the intraday volume swelling up which is often indicative of either a stop run which happened earlier or a reversal candle and intraday we do have a small hammer, you can see a few different depending on the timeframe, the point is it lifted off the lows on some volume so if the trade comes tomorrow and the signals are there, I'll put it out there again.
I mentioned Financials...
I'm glad to have opened FAZ rather than a put, I'd even settle for SKF or even XLF.
This daily 3C chart is big picture and it's not pretty, but we're talking about a 3C negative divergence trend that's size easily surpasses some of the worst looking assets in 2007.
On a more reasonable trading level, the 60 min which is still a huge trend shows smaller areas of accumulation and larger areas of distribution, this tells me they've just been doing enough to sell or short shares higher, sending it up on a little accumulation and then hitting it hard with distribution.
The 5 min trend is very useful for the 10/9 cycle, it shows the accumulation in to the 10/9 lows, confirmation and distribution which is right now on a level that I just wouldn't ignore, I'd take this short and if possible I'd add to it if risk management allowed an I either saw a head fake bounce or as short profits accumulate, pyramid the position up.
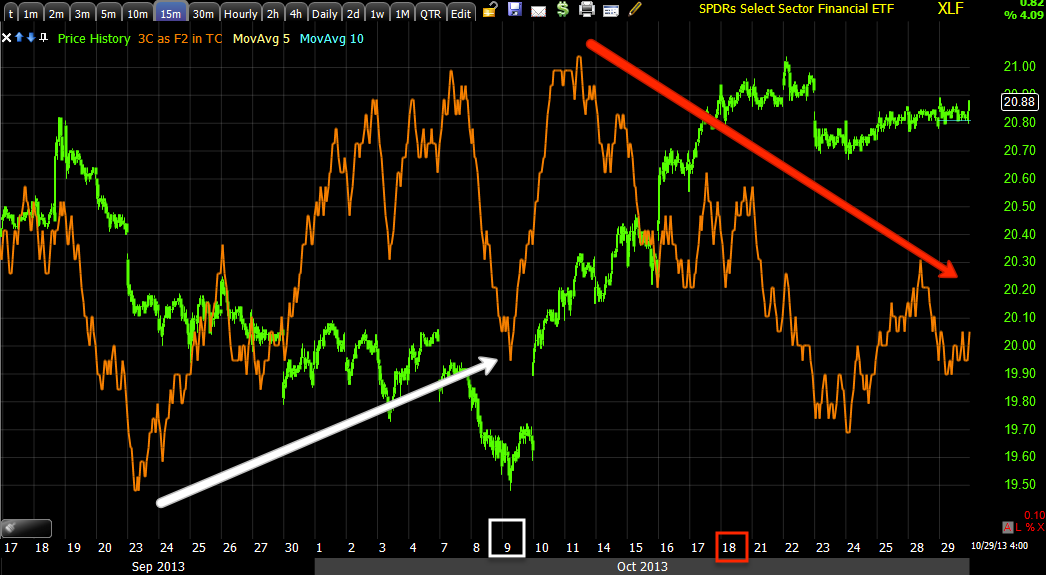
The 15 min shows the trend very clearly as well. The 18th keeps popping up in just about every asset as being a day that started something.
I'll cover Tech real quick too...
Again the daily is really ugly, but notice it wasn't until after prices moved above the range that it really deteriorated.
This 15 min chart is lust like the rest of them, accumulation in to the lows of 10/9 and distribution on the 18th,
for those who think there isn't clearly set up cycles and manipulation of the market, just look at any number of charts I've been positing since the 18th or before the lows of the 9th, it's just not coincidence.
Again the 5 min chart is perfect for this cycle, accumulation (Stage 1), mark-up (Stage 2), distribution (stage 3) and stage 4 is decline.
Intraday, it's this pop that I liked today, there's no 3C confirmation even on a fast 3 min chart, in fact the opposite so I continue to like TECS or XLK short.
As for Gold, I think the story is pretty clear although it's very F_E_D sensitive, but so far the larger trend looks to be coming on the upside while we pullback near term opening up some great long opportunities. As I said earlier about gold and gold miners, the cycle that is set up is already so large, they had to have factored in the F_E_D and discounted it so I feel if there were a move in gold that was counter to current expectations, I'd think it would be transient and gold would flip back on track.
Crude pulled back a bit today as expected, I'd expect a bit more, but intermediate term I think oil/USO is headed back toward the $38.50 area.
You may have heard already that Steve Cohen of SAC is pleading guilty, which comes with a $1.2bn fine and they have to stop managing money. I was just talking about the normal 2/30% (2% management fee and 20% incentive fee), I didn't know SAC was a 3/50 company, but I had mentioned there were some out there when we were talking about Dan Loeb. In any case, it may get interesting as what's in the fund gets liquidated unless it's absorbed which I doubt.
I'm going to try to leave most of the forward looking analysis for tomorrow before 2 p.m. We did have a F_O_M_C meeting in which everything just started moving off the charts, sort of like Friday the 19th of this month and we knew something was up, we went long pretty heavily and it paid off so I'm always on the look out for that kind of action/.
The most important thing I can say right now is the same thing a always, you know what it is...
"Beware the F_O_M_C market knee jerk reaction", it's almost always there and almost always wrong or reversed within a couple of hours to a couple of days. Take a look at the reaction on Sept. 13th 2012 and look at September 18th 2013, the knee jerk was strong, emotional and ultimately failed and was faded the next day (in 2012's instance it was faded about -8% over several months, but 1 day of rally only).
Things are rarely what they seem, thinking back to Sept. 13th 2012 again, that's when QE3 was announced and I got a lot of emails that said
"Don't fight the F_E_D" as we had shorts on and emotionally I totally agreed, but we had strong negative signals and they paid off after the initial onslaught of buying that day subsided the next day. Trying to stay unemotional during this initial few hours is crucial. Unfortunately the time when I've learned the most about future F_E_D actions and the market's reaction has been watching the market during the press conference that we won't have tomorrow, I can remember what Bernie said on Sept. 13 and that it was 2:24 p.m. and it stopped the market right then and there, he had changed F_E_D language slightly and the market really picked up on it.
I'll check futures as usual before I turn in and see if anything stands out. Right now ES, NQ and TF all have 1 min negatives so a little downside soon wouldn't be surprising, but that won't hold overnight this early. They also have 60 mins and TF in particular (Russell 2000) has every timeframe negative now which is usually a good timing signal.
Have a great night, get some rest, tomorrow's going to be draining I suspect.