Thursday, December 12, 2013

Trading Portfolio: Management

The first thing I'm going to do is lock in profits in UVXY long, FAZ long and SRTY long and raise some cash. I'm leaving PCLN short in place as a hedge for any possible sudden moves to the downside in the market (for the time) and MCP long will be left in place.


Trade Perspective

As I said last night/yesterday, if I'm to put out any new trades or close some, this is all in the context of very short term trades, not having anything to do with core positions and not having anything to do with any changes in opinion or data, it's simply trading on a shorter term basis and only for the trading portfolio and maybe some options in some situations.

Therefore I want to give a little perspective to reinforce this point because in the past when I've taken very short duration long trades it has caused some confusion for some members thinking I've changed my primary analysis which isn't the case.

For example, just looking at the QQQ, most trades that "may " be taken on the long side will be in the 1-5 min positive area, I don't think they can get much further than that. The longer the timeframe, the stronger the signal.

First, these trades are not for everyone, there's nothing wrong with sitting in some of the positions we are in like SRTY (3x short IWM) and just riding out a correction, if you don't have the time, risk appetite or feel comfortable, it's better to just wait on the sidelines, the probabilities are still with these trades seeing more downside, but everything corrects and the trades I'm talking about are more about trading the corrections if there's good reason.

QQQ 2 min, from very negative to in line which is better 3C relative performance, but don't forget this is a very short term chart and very short term and not very powerful signals.

The same is true of the 3 min chart, this is the range where most of these short duration trades would be made, 1-5 min  charts.

 The more important charts like this 10 min  say, even if there is a correction, the probabilities are after it ends, the market heads lower.

This 15 min chart says the same

As does this hourly chart.

The most aggressive trading stance would be to trade some long positions on a short duration trade and then re-open the current short positions as the long trade starts to end.

The next most aggressive position is just sitting tight, letting the market bounce (if it can) and entering or adding to short positions as that bounce nears its end.

The least aggressive and the longer term, higher probability perspective is to just ride out a correction without making any changes, this is perfectly acceptable, if anything were to change so drastically that this course of action would be endangering positions, I'd let you know.

The first thing I would do in the trading portfolio and/or the options portfolio in certain cases would be to lock in profits and raise cash, then from there I'd make decisions about whether it makes sense to enter counter probability long positions.

I hope this makes things a bit more clear, basically all we are doing is adding some more short term trading to the mix, but it doesn't change anything about our analysis and core positions at all.


A.M. Observations

Good morning,

All I can say is I knew I'd regret it last night if I didn't post what I saw and this morning it was pretty much spot on for short term trade probabilities and for the change of market character (longer term probabilities).

Just about the time I wrote that I thought Index futures were bottoming last night partly because a negative divegrence I saw in the Yen, meaning the EUR/JPY moves higher, it was the bottom.

 This is the 5 min negative divergence in the Yen, a lower Yen is typically a higher EUR/JPY which is typically a higher market.

However seen above on a 5 min chart, ES (purple) is not tracking EUR/JPY worth a ...nickel? This is another change in character that really means something, something NOT GOOD for the market and those trying to ramp it on a whim.

 intraday on the 1 min you can see ES is following the movements now that the Yen got knocked down, but still a major problem.

At 8:30 we have a little spike in Index futures from Initial Claims which apparently had some trouble being "seasonally adjusted", thus creating the biggest spike since 2005 excluding Sandy and the worst print since March at 368 on consensus of 320, this is also good for the market very short term as I suspected last night we'd see..

The $USD gained a bit on the Claims data, treasuries knee jerked down and up and gold didn't do much.

 This is the 5 min chart of ES, the white box is the lows I mentioned last night when writing the Daily Wrap and my opinion that we were seeing a bottom (short term) out in. Note the positive 3C divegrence, I only care about these on 5 min charts and higher for Index futures and all of the major Index futures have it, so we should get an upside bounce which is fine, I'd actually like to trade it, but we'll get to that.

Remember the pullback in gold, I got my target in GDX so it was plan your trade and trade your plan, otherwise this morning that DUST position should see some more upside, but I don't think that will last for long, we'll be looking for a NUGT long entry to get back in to.

As far as oil, I thought we'd get a pullback, the correct word is "correction" because a correction can be either through time as seen above or through price which is a pullback, but both have the same effect of wringing out the dead leaves.

We'll be watching USO for a position as well.

Now, understand that I may be closing some bearish/shorts in the TRADING PORTFOLIO to ride the market, don't assume this means I'm now bullish on the market, I'm bullish on a bounce that I think can be traded, but that's about it, it has NOTHING to do with any other analysis or any other longer term or core short positions.

So lets see where the opportunities are.

Wednesday, December 11, 2013

Daily Warp... FAIL

I wasn't going to post this tonight with the other post, but now is no time for complacency, as things get further down the rabbit hole volatility increase, ranges and gaps increase, unpredictability increases and you can even see some really big moves on the upside that don't mean a thing.

After looking at the market and thinking back to what happened today, there was a serious effort to put in a base that at least the IWM could correct from, this is normal behavior, even for a bearish tone which may be one of the biggest changes, "normal behavior" because we haven't seen it in 4 years.

So as I mentioned, a base was under construction to bounce off, it just saw a complete FAIL.

I don't have all the charts, but enough. If you look at sentiment you can see what happened there alone.
 sentiment was moving toward a small bounce, then a total FAIL, this was evident in 3C, a positive divegrence/base was building and then wiped out.

They haven't given up yet...
 The other sentiment indicator took a cue from their efforts to salvage the situation, just compare the noon hour and after action with the SPY arbitrage below.

Yep, tried they did, but even with that it wasn't enough to even stop the bleeding.

The SPX futures saw the biggest drop in 4 months, the VIX saw the largest gain in 2 months, right on time after yesterday's note that the VIX had not only hit the average we were looking for, but put in a bullish reversal candle...
I hope you are taking down the concepts and not just listening to the posts because every move in the VIX right up to today was predicted weeks before hand giving you the chance to get ready, I was watching positions work today quite comfortably, no stress, no chasing trades, the signals were there in advance, the work was done at the best prices.

As for the VIX, I know they want to get a bounce, but the cat is out of the bag here so if they do get a bounce in the market it's going to likely be an insignificant correction in the VIX before it heads higher and the market lower.

This is why I say "I wouldn't enter a market correlated long with your money"...
The SPX makes the breakout move that many people think is such an important event, they pay too much attention to price, there's nothing to learn there that everyone with eyes doesn't already know, but seeing the distribution in this area is worth knowing. Seeing the SPX is now in a position in which 1 gap down can take out more than a month of longs on super-turbo charged margin and negative net worth is exactly why I wouldn't enter a market correlated long, flip to a bull.

I could care less that the Russell 2000 broke below it's 50 day moving average today, but I know technical traders care and I can use that against them just like Wall St. does, what I do care about though...
Is the R2K is making lower highs and lower lows, this is Bernie's favorite measure of the "wealth Effect", therefore the NY F_E_D's open markets desk's main priority. The R2K should always lead the market, but here it's leading in the wrong direction.

These aren't big moves, but as I said, there's not a lot to learn from price, the real stuff is under the surface.

Take the Percentage of NYSE stocks Above their 40-Day Moving Average, from their last high in October, the SPX has moved up exactly 0.58% (still want to talk about how this market is just unstoppable on the upside?), the percentage has gone from the Octobeer high of 82% to the current low of 33% and the market has barely moved (+0.58%), that's market breadth totally falling apart and part of the reason I was ticked at BAC's "Big Breadth Revelation", they saw 1 indicator of 50 that are all falling apart.

The Percentage of NYSE Stocks 1 SD > 40-Day m.a. over the same period has gone from 66% to 15%, the same indicator except 2 SD's went from 41% to FOUR PERCENT! The SPX is trading up here and the percentage of NYSE stocks trading 2 standard deviations above their 40-day is only FOUR PERCENT!!!!


As warned about a week ago, Transports got walloped today, there's a short there.

Check out the NYSE A/D line...
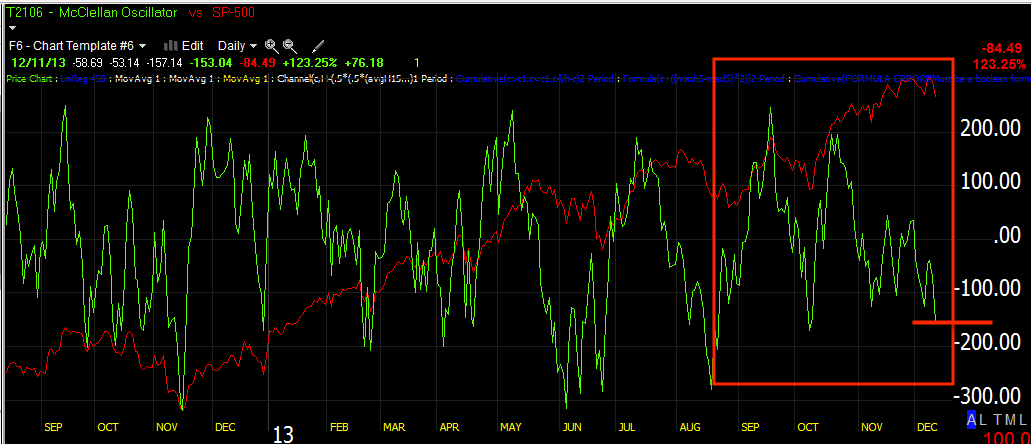
Not only has the NYSE A/D line failed to cross October's high (vs SPX red), it's now at the May 21st levels although the SPX is 6.77% higher, that's a problem with breadth...BANK OF AMERICA!!!

Indicators I rarely post, but watch are all negatively divergent and this is the best way to use them, Zweig and the MCO (vs the SPX)...
 Zweig Breadth Thrust...

McClellan Oscillator

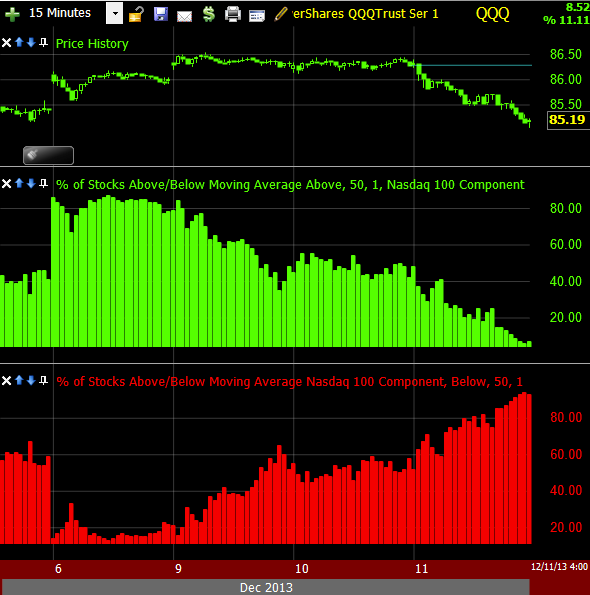
Looking even closer at the breadth picture, here's some of my indicators for the NDX component stocks vs the Q's...
 15 min Count New Highs at 250 bars and Count New Lows

Intraday 15 min NDX A/D line at a new low

The percentage of NDX stocks above their  15 min 50-bar moving average and below it.

I can't really make this case any stronger and I'm not trying to convince you of anything other than what's in front of you, the reason is this is what you need to remember when we make those trades that make you want to cover your eyes, hold your nose and jump, the ones that every fiber of your emotional being is saying, "Why are you doing this?" These are also the trades with the best entries, the best timing typically and believe it or not, the least risk.


However I think they'll still try, don't ever get complacent, but I'd also say don't get too wrapped up in what the market does overnight or early in the morning, DON'T BE MYOPIC, LOOK AT THE BIGGER PICTURE.

If the market had put together a halfway decent base that could be traded long today, I'd probably do it, but like one member told me of his plans, he'll wait for any bounce and short that, that's thinking, that's patience and using the probabilities to your advantage.

The market is going to get where it's going, like Jesse said, "time" and in my experience, realistic expectations and those can be gained by looking at past reversals and bear markets a day at a time and think about how you'd feel on that day if you had all of your children's education fund in the market, you need to make it emotionally meaningful to make it useful because you have the advantage of knowing what comes next, we don't have that in real time, we live on the right edge of the chart, but knowing what is normal will keep you from freaking out and making an emotional decision because the market was up 1%.

So, do I think they'll try again tomorrow, yes I do, BUT TODAY WAS A FAIL AND THAT IS SOMETHING NEW IN THE MARKET'S CHARACTER.

One reason I think they'll try again is the intraday Yen charts look like it will pullback, even though the Carry Crosses aren't as effective if effective at all, they may give them a try, they certainly gave the SPY arbitrage a try today and the market still failed. However one of my favorite (NEXT DAY) indicators is the custom layout I designed to keep track of the Dominant Price/Volume Relationships among the major averages.

Today our dominant theme was strong, 20 of the Dow 30, 60 of the NASDAQ 100 and 289 of the SPX-500, that relationship was Close Down/Volume Up. This is a short term capitulation event, the problem is the momentum on the downside never gave any room, we didn't have any reversal candlesticks, but considering the VIX, a pop might be what we get.

I'll be looking for the divergences because I will, if I have good reason, take out a call option and add a few percentage points. If I don't have good reason, I look for other trades and let the ones opened already... work.

Some other things I see was an effort to knock VXX down with some distribution. HYG was out of the game, it seems no one wants to risk getting caught with their pants down in credit, but I'll be watching there too.

The USO pullback we expected looks like it's coming as well as the Gold/GDX and NUGT positions, they should open up again shortly so those are some nice trades. MCP should be working shortly as well and UNG should pullback soon and we can play that with DGAZ, then enter UNG long when that's done. If the market can get a little base together (there's room along side today's action, the range would be wide, but it could work), then in the trading portfolio I'd enter a FAS position being I can't use any options there, that was the point.

I may even move SRTY and a few others around IF the charts warrant it, but this doesn't change the Probabilities which are rip-roaring strong on the bearish side, I know we've had to wait, but I think that's largely because this will likely be an epic, historical opportunity, it won't be emotionally easy, but it should be rather straight forward with a lot of opportunities.
I think the market may be (INDEX futures) putting in some lows right now, but either way it doesn't matter, if we go lower, we're all set for it, if we get a bounce we can make some extra scratch and set up more trades in line with the probabilities, we're in a good position.

When I look at the October Cycle charts, I know this is the spark that starts a fire, we haven''t seen anything yet, I'm thankful I stumbled on 3C actually trying to create something a bit different. I am really just thinking right now about getting my "Fluid marital situation" resolved and funding my account, I'd like to enjoy this with all of you.
 SPY October Cycle, this is like the fuse and this isn't coming back even if we do get some pretty intense up days...

The IWM, the Channel Buster here means the IWM has a fast and large plunge ahead of it.

And the POctober cycle for the Q's... I don't even have to draw the divergences.

Like I said at the top, I wasn't even going to write on this subject tonight, but there are opportunities and I wanted you to see what it looks like when Wall Street itself FAILS.


This and That and the Other

I have made the case for the market, there's not much I can add to it accept to update it and look for or manage positions.

There are some really nasty structural defects in the market that I think will exacerbate a real panic decline which is what most of us like to think of when we think "bear market", but did you know on average there are just about as many up days as down days in a bear market? Then of course Wall Street will try to keep you guessing if you are really in a bear market or if you may be near the bottom of one; how do you think traders felt just 2 and a half months after the initial 1929 market crash when the market rallied for the next 5 MONTHS and gained about +45%? How many do you think may have thought, those 2.5 months of crash were just a fluke, especially after a bull market of about 8 years that gained almost 500%?

Did you know there were at least 5 (more depending on how you count them) of these bear market rallies like that first one mentioned above? 

My question to you is this, looking back at the most easily identifiable bear market in equities, "Do you think you would have had the fortitude to reap the reward of approx. 346 points of a possible 386?"Or do you think watching the market day after day for 5 months push higher and higher may have scared you out of your positions? Even if you had the benefit of multiple objective sources that all pointed the same direction, which established the direction of highest probabilities?

What about this?
After the initial decline and what looks like capitulation volume possibly calling an end to the decline, and BEFORE the counter trend rally I mentioned above, what about a month of higher highs knowing the market had gained 500% before this 2.5 month anomaly?

Yes, trading is hard and Wall Street is there to make it even harder because someone has to lose in a zero sum game for someone to win.

I'm just trying to point out a few things, like how narrow our view can be sometimes, this is the 1929 crash in full.

To ride that bear down seems pretty easy when you look at it like this, but I just showed you a month long period and a 5 month period, had you exited out of fear at the end of that, you would have missed the rest of the gains from 300 points to about 44 points. It always seems so much harder when you're in the middle of a day and the market is up half a percent and you feel panicked. This is the hardest lesson I ever taught in my years of teaching trading, to get people to look at historical charts with emotion, to understand how you would have felt, to understand what is normal and what is not.

What if you had this 3C chart back then? 
Knowing this chart confirmed most of that huge rally and then seeing a change in character at the white arrow where price suddenly saw a huge increase in the upside Rate of Change and 3C started telling you distribution was taking place? Unfortunately we can't see what the 6 other timeframes we use had to say back then, I wish I knew, but knowing this  (which does not show how far the DOW actually fell to the right), would you have been able to use the data because I haven't heard of too many other indicators that predicted the reversal?

This is why I quote people who are smarted than I am and who can say it far better than I ever will be able to, respected traders like Jesse Livermore, a man who was a notorious bear during this period and known for bear raids, known for making his vast fortune (3 times) selling the market short (not that I am saying I'm a perpetual bear, I just want to be on the right side of the major move).

It's advice like this that is so easy to dismiss when you are too close to events or your risk management is not up to par, but looking back historically, there's a reason this man is considered the "World's Greatest Trader...

I think rather than talk about the little things which we already know (of course I'll cover anything relevant), maybe it's good to contemplate some advice from those who we can learn from.

For instance...

“I learned early that there is nothing new in Wall Street. There can’t be because speculation is as old as the hills. Whatever happens in the stock market today has happened before and will happen again. I’ve never forgotten that.”

Even with HFTs and all of the other changes, 2007/2008 bore a lot of resemblance to 1929 in a scaled way, but as I always say, the market is fractal in nature for the very same reason he says there's essentially, "Nothing new under the sun".

I'm sure you've heard the full version of this one...

“Money is made by sitting, not trading.”

“It was never my thinking that made the big money for me, it always was sitting.”

Men who can both be right and sit tight are uncommon.” (We'll deal with this again)

If we consider those quotes, it's clear what he's saying, once you know the probabilities, stick with them, but how? This is where the lesson is yours to learn, what prevents you from "Sitting"? Too big of a position size? Too tight of a stop? Emotions? A partner who doesn't support your trading? Unrealistic expectations of how much money you need and how much money you can make trading for a living?

This one is hard for even me to contemplate...

 “Don’t give me timing, give me time.”

I understand this is in the same category as the above, however one of my things is trying to nail down the timing, but I do understand the quote in this context. When I did NOTHING else but trade (that means no additional income which can be a very stressful job), I blew up an options portfolio because as you've probably heard me say, I was using them exactly the way Wall Street designed the derivative products and the house always wins.

It wasn't until I started doing the exact opposite of the allure of options, for instance spending more and buying quality over spending less and buying quantity or buying expirations that were in many cases, 10 times longer than I anticipated needing, that I finally was able to use options as a tool when needed.  You always here the stories of option trade jackpots, hitting the timing just right with a large supply of out of the money options and a 500% gain, but you don't hear the rest of the story or see how it ends. With options, I've learned to try to get the best timing possible, but the most important thing to my success with them is to have enough time on the contracts, that's what made the biggest difference .

How about these two...


 “Nobody can catch all the fluctuations.”
 “The desire for constant action irrespective of underlying conditions is responsible for many losses in Wall Street even among the professionals, who feel that they must take home some money everyday, as though they were working for regular wages.”

What can we learn and apply? For me, patience is a big part and having good reason to enter, exit or otherwise change or leave a position alone.

I've made the mistake of making too many trades, when I first started trading full-time I didn't have a supportive spouse, I felt I HAD to show her I could make a regular paycheck so I turned away from my then chosen method of swing trading as I may have to wait weeks for the gains and started day trading. I was able to make some money, but at 100-200 trades a week, my transaction costs alone could have easily paid all of my bills for the month.

As you saw today, earlier there was some evidence for opening some new trades, but it wasn't enough. In the past, I can't say I would have had that same discipline or patience, in fact on of the hardest things for me to stop doing was chasing trades, the hardest thing for me to do was learn to take a trade even when price and popular opinion as well as my own emotions were totally against it.  However I learned that these positions gave me some of the best entries and they actually had the least risk. I suppose you could say I not only had to learn patience, but I had to learn to trust in faith and probabilities because there's no (LEGAL) greater edge than the best, objective case you can make for probabilities.

Also the action or the need to get back losses quickly, this is a business, there are business costs and not every business will survive, that's just truth. However a surefire way to destroy your business is by making it personal and treating it like gambling.

Those are just a few things to chew over and there's no right answer for everyone and you may disagree, but I think someone so successful that JP Morgan himself had to ask Jesse to stop shorting the market to prevent a collapse of the banking sector and economy in 1907, deserves to be contemplated.

For my part, we all know what the recent Investor Intelligence Percentage of Bears has been, all time lows, we also know that Investor Intelligence is one of about 3-4 sources that is used to construct "Dumb Money " indicators, essentially, when dumb money is at extremes like this, you want to be on the other side of the boat.

Since I have always kept only a tracking portfolio because of time constraints and because I want to keep track of all ideas put out there, it's not an optimal representation of what a real model portfolio would look like, having 20-60 stocks in a portfolio is not my idea of trading, it's over-diversification in my view. However, at times as you know, especially when there's been a significant shift in the market, I like to see how the tracking portfolios are doing vs the bulk of traders, in other words, see how our positions measure up against the crowd.

I only recently started a "Trading Portfolio" mainly to see if I can maintain my level of commitment to the site while trading my own portfolio without risking my money due to not having time to pay enough attention. I've long considered this, there are several issues that I have had to consider such as trust of members that I'm not front-running a trade in a small cap and then putting it out for the membership, I think I can do that with timestamps to prove that the idea was given to members before I acted on it. One of the other issues is the "Follow" issue, I don't want a portfolio like that to become a "Follow me" portfolio because there's no idea that I'd put out and wouldn't trade, but I may not have room to trade an idea, that doesn't mean it's any less of a good idea. I'm sure you get the point.

So I'm seeing how it is going and I'll likely start a small portfolio because I don't want to miss the opportunities this market is giving and going to give which I think will be historic, a small portfolio will alleviate some of the "Front running" concerns and I think it would be a good lesson in risk management which the new site has some new additions like the 2% rule calculator because small portfolios with larger transaction costs are by far the hardest challenge. I'll see how it goes, but I'm thinking as soon as I wrap up the transient marital issues later this month (if you know what I mean) I'll likely move forward with the new site opening.

In the mean time, I did check today to see how the positions we set up in advance fared against the crowd.

THE TRADING PORTFOLIO IS ONLY 9-DAYS OLD, there are no options used, just equities and ETFs, I run about 6 positions on average and so far that portfolio is up +13.7% since 9-days ago.

To put that in perspective, the median performance for all hedge funds is 6% as of November for the year, if I wrapped it up for the year right now I'd double their average  performance and these guys make 2-3% in management fees and 20-50% in incentive fees for profitable trades above the high water mark.

I was surprised that none of the tracking portfolios had huge gains, yet they outperformed the group by a wide margin.


 I first heard of this site because MIT had a trading contest using it and it's one of the most realistic with margin maintenance, trade slippage, interest, transaction costs, etc. Unfortunately it was only after I had opened a good number of positions I found out that you can't see anything else other than another member's rank and last trade unless you pay a monthly fee, I should have checked it for webmaster tools, but since then I've found no other substitute outside of a spreadsheet which can't give all of the same reality based functions without a lot more programming know how then I have. CBOE also has a pretty interesting site, but there's no way for me to migrate open positions to the new site without opening new trades and that defeats the purpose.

The portfolios performance below starts with the trading portfolio which was just opened. The "Rank" is versus all other players on the site for the timeframe seen to the left (weekly/monthly), I've actually won numerous times which is supposed to come with a cash prize, but I've never seen that. The "Return" is for the same time period and it shows the SPX's return for the same.

Below that (blue) you can find out how many other contestants there are, for example, the Trading Portfolio at the top ranked #57, below you can see that is 57 of 6,527 other "players".

You'll also see the options tracking portfolio which I keep separate and the Core position portfolio.

The point of sharing this is not bragging rights, I've had much higher scores and not shared them, it's when we have transitional moments because it shows me how we did vs. the crowd so in a way, it's a sort of "Sentiment" indicator. On a week like this where the trading portfolio places in the top .008%, I can see we were on the right track while the majority were pursuing a different course.

Keep in mind that all of these except the newest "Trading " portfolio are WAY over diversified for me (I can achieve diversification with 5-6 positions without killing performance), I'd never run a true portfolio like that as your winners represent a very small fraction, but when the entire portfolio does well, I know we have good stock selection.

On average our "Core Shorts" have been outperforming the SPX by a 7:1 margin on down days, (if the SPX is down 1%, the entire tracking portfolio is down -7%) which is fantastic.

*See below for additional comments

Trading Portfolio Weekly


Options Tracking Portfolio


Options Tracking Portfolio


Core Position Tracking Portfolio


Core Position Tracking Portfolio 


I have a board meeting to attend in which I'm making a $160,000 decision for the community as Treasurer and Secretary (In FL, a corporation only needs a President and Secretary, they are must haves).

I'll take another look at the market and emails when I get back, but I think pondering some of the quotes from above may be a very useful exercise.

When the new site is online, we have a ton of new tools and features that will open your eyes to your trading, trading in general and lots of other details you'll find no where else as well as new features like the Risk Management (@% Rule) Risk Calculator and much, much more.

Market Update...THIS DOESN'T LOOK GOOD

The lack of a respectable (even intraday) base has gone from bad to worse, this is just the nature of the market and why I always go with the probabilities even when it's a tough trade to make or hold because I've had years upon years of experience with 3C and I know what the probabilities are with the indicator and I know I've never seen anything literally "This off the charts"

In the words of John Templeton...

"“To buy when others are despondently selling and sell when others are greedily buying requires the greatest fortitude and pays the greatest reward.”

I'd add to that, that you must have an OBJECTIVE and OVERWHELMING reason to do so, in any part of life, faith is one of the hardest things especially when your emotions are telling you something different and they are very strong.

If I have found the strongest probabilities, the only reason for me to change course or tactics in mid-stream, even if for only a day, is finding similarly strong probabilities, if I lack them, then any choices I make to the contrary are made from emotions and emotions are usually the best reverse indicator.


So the SPY... I have no reason to move, even for a short term counter trend correction.
 This "could" have been a workable base, it still "could" be with a bit more time, but the probabilities aren't there yet if they ever will be.

The fastest 3C chart isn't even positive which means it has deteriorated.

The 2 min chart is just as negative as it was 3-days ago

the 3 min

Higher probabilities at 10 mins tell me things are very ugly, but we've known that, price is responding to that. Why do you think we are not scrambling to enter shorts or chase the market? We did our work already.

 The 15 min chart, this is very hard to overcome, even short term moves don't stand a chance.

At the bottom I try to put in to context the size of each divergence

The IWM is no better, it lost what it had yesterday

And the IWM 15

Look at the QQQ 10 min

GDX / NUGT / DUST

OK, DUST, a 1-day trade for a counter trend move in NUGT is now done, I could have likely squeezed an extra percent or two out of it, but it just wasn't worth it. I accomplished what I set out to do, not only to hedge the NUGT long, but to make some extra scratch on the opportunity, that's trading.

The P/L for this 1-day position was great...


At a fill of $45.20, that's a 1-day gain of +10.3%

 As far as GDX goes (DUST and NUGT are the 3x leveraged short/long versions of GDX) it filled the gap or enough for me.

DUST didn't quite, but ETFs try to track performance on a 1-day basis in most cases, they don't always succeed, sometimes it's good for you, sometimes not.

This is DUST though losing 3C momentum, the first negative divergence is showing up and I suspect it will grow and become more powerful until DUST heads down and NUGT is a long again (maybe a day or two?)

DUST 2 min migration

GDX 1 min positive.

All that GDX/NUGT need now for a new entry is to put in the reversal process which won't be that big considering it was just a gap fill so I may be re-entering NUGT tomorrow.

Remember this tells us something about the market, GDX/NUGT trade like Gold and gold trades opposite the market right now for the most part so you can kind of get another perspective or piece of the puzzle to compliment your analysis and it's not an area many traders would look, but that's what you need to do to beat the masses, think outside the box.