After looking at the market and thinking back to what happened today, there was a serious effort to put in a base that at least the IWM could correct from, this is normal behavior, even for a bearish tone which may be one of the biggest changes, "normal behavior" because we haven't seen it in 4 years.
So as I mentioned, a base was under construction to bounce off, it just saw a complete FAIL.
I don't have all the charts, but enough. If you look at sentiment you can see what happened there alone.

They haven't given up yet...


The SPX futures saw the biggest drop in 4 months, the VIX saw the largest gain in 2 months, right on time after yesterday's note that the VIX had not only hit the average we were looking for, but put in a bullish reversal candle...

As for the VIX, I know they want to get a bounce, but the cat is out of the bag here so if they do get a bounce in the market it's going to likely be an insignificant correction in the VIX before it heads higher and the market lower.
This is why I say "I wouldn't enter a market correlated long with your money"...

I could care less that the Russell 2000 broke below it's 50 day moving average today, but I know technical traders care and I can use that against them just like Wall St. does, what I do care about though...

These aren't big moves, but as I said, there's not a lot to learn from price, the real stuff is under the surface.
Take the Percentage of NYSE stocks Above their 40-Day Moving Average, from their last high in October, the SPX has moved up exactly 0.58% (still want to talk about how this market is just unstoppable on the upside?), the percentage has gone from the Octobeer high of 82% to the current low of 33% and the market has barely moved (+0.58%), that's market breadth totally falling apart and part of the reason I was ticked at BAC's "Big Breadth Revelation", they saw 1 indicator of 50 that are all falling apart.
The Percentage of NYSE Stocks 1 SD > 40-Day m.a. over the same period has gone from 66% to 15%, the same indicator except 2 SD's went from 41% to FOUR PERCENT! The SPX is trading up here and the percentage of NYSE stocks trading 2 standard deviations above their 40-day is only FOUR PERCENT!!!!
As warned about a week ago, Transports got walloped today, there's a short there.
Check out the NYSE A/D line...

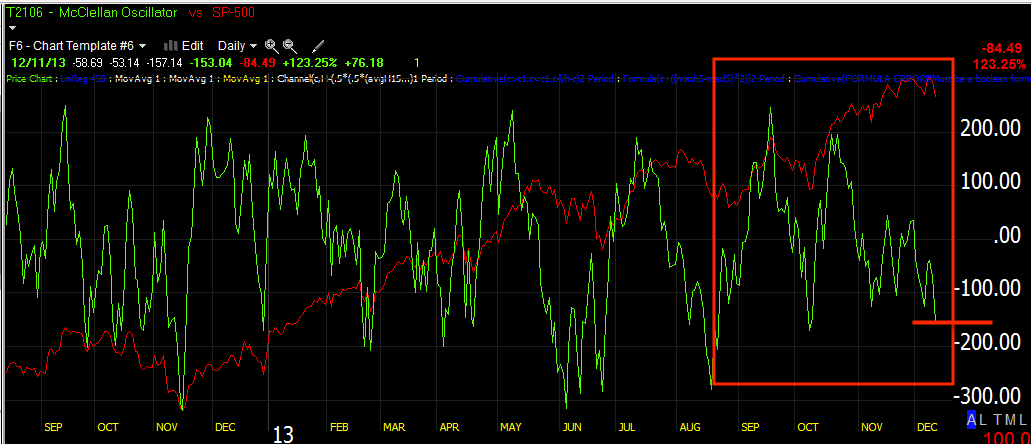
Indicators I rarely post, but watch are all negatively divergent and this is the best way to use them, Zweig and the MCO (vs the SPX)...

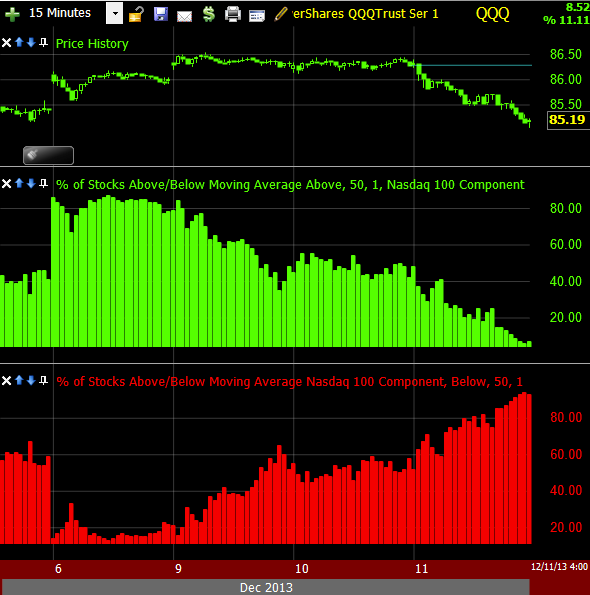
Looking even closer at the breadth picture, here's some of my indicators for the NDX component stocks vs the Q's...


I can't really make this case any stronger and I'm not trying to convince you of anything other than what's in front of you, the reason is this is what you need to remember when we make those trades that make you want to cover your eyes, hold your nose and jump, the ones that every fiber of your emotional being is saying, "Why are you doing this?" These are also the trades with the best entries, the best timing typically and believe it or not, the least risk.
However I think they'll still try, don't ever get complacent, but I'd also say don't get too wrapped up in what the market does overnight or early in the morning, DON'T BE MYOPIC, LOOK AT THE BIGGER PICTURE.
If the market had put together a halfway decent base that could be traded long today, I'd probably do it, but like one member told me of his plans, he'll wait for any bounce and short that, that's thinking, that's patience and using the probabilities to your advantage.
The market is going to get where it's going, like Jesse said, "time" and in my experience, realistic expectations and those can be gained by looking at past reversals and bear markets a day at a time and think about how you'd feel on that day if you had all of your children's education fund in the market, you need to make it emotionally meaningful to make it useful because you have the advantage of knowing what comes next, we don't have that in real time, we live on the right edge of the chart, but knowing what is normal will keep you from freaking out and making an emotional decision because the market was up 1%.
So, do I think they'll try again tomorrow, yes I do, BUT TODAY WAS A FAIL AND THAT IS SOMETHING NEW IN THE MARKET'S CHARACTER.
One reason I think they'll try again is the intraday Yen charts look like it will pullback, even though the Carry Crosses aren't as effective if effective at all, they may give them a try, they certainly gave the SPY arbitrage a try today and the market still failed. However one of my favorite (NEXT DAY) indicators is the custom layout I designed to keep track of the Dominant Price/Volume Relationships among the major averages.
Today our dominant theme was strong, 20 of the Dow 30, 60 of the NASDAQ 100 and 289 of the SPX-500, that relationship was Close Down/Volume Up. This is a short term capitulation event, the problem is the momentum on the downside never gave any room, we didn't have any reversal candlesticks, but considering the VIX, a pop might be what we get.
I'll be looking for the divergences because I will, if I have good reason, take out a call option and add a few percentage points. If I don't have good reason, I look for other trades and let the ones opened already... work.
Some other things I see was an effort to knock VXX down with some distribution. HYG was out of the game, it seems no one wants to risk getting caught with their pants down in credit, but I'll be watching there too.
The USO pullback we expected looks like it's coming as well as the Gold/GDX and NUGT positions, they should open up again shortly so those are some nice trades. MCP should be working shortly as well and UNG should pullback soon and we can play that with DGAZ, then enter UNG long when that's done. If the market can get a little base together (there's room along side today's action, the range would be wide, but it could work), then in the trading portfolio I'd enter a FAS position being I can't use any options there, that was the point.
I may even move SRTY and a few others around IF the charts warrant it, but this doesn't change the Probabilities which are rip-roaring strong on the bearish side, I know we've had to wait, but I think that's largely because this will likely be an epic, historical opportunity, it won't be emotionally easy, but it should be rather straight forward with a lot of opportunities.
I think the market may be (INDEX futures) putting in some lows right now, but either way it doesn't matter, if we go lower, we're all set for it, if we get a bounce we can make some extra scratch and set up more trades in line with the probabilities, we're in a good position.
When I look at the October Cycle charts, I know this is the spark that starts a fire, we haven''t seen anything yet, I'm thankful I stumbled on 3C actually trying to create something a bit different. I am really just thinking right now about getting my "Fluid marital situation" resolved and funding my account, I'd like to enjoy this with all of you.


Like I said at the top, I wasn't even going to write on this subject tonight, but there are opportunities and I wanted you to see what it looks like when Wall Street itself FAILS.


No comments:
Post a Comment