Monday, July 7, 2014

IWM Wants to Bounce

As it should be as the IWM (should) leads the market, it has been beaten up the most intraday, it's no wonder the MSI is looking so weak today, however it does want to bounce, which I would use for any tactical entries (selling or shorting price strength) as this doesn't look to be anything more than that. I have the best signals for a bounce in the IWM, Russell 2000 futures have an intraday 1 min positive, but at 5 mins 3C is following price nearly exactly.

Here's the IWM, with the Dow still holding 17k which isn't a surprise on the first test, it should move most of the averages, I like the Q's in particular for a possible short (SQQQ long) entry or a put option position.

 This is why the IWM bounce doesn't really matter and why I'd use it to sell/short in to, clearly negative at intermediate timeframes like 15 min...

Clearly negative on 60 min longer timeframes, note the positive at the mid-May area where we expected a move above the SPX's 3 month range.

 1 min IWM intraday

2 min positive relative divergence (weaker form)

5 min relative divergence (very weak ).

As I said, it looks like a bounce only, the averages have had a lot of dispersion in relative performance, if I were to play anything as a short term weekly call on an IWM bounce, it would be IWM calls, but I'm not so sure I'd be willing to take that risk unless there were significantly more improvement.

Market Update

The market is trying to put together an intraday bounce based on Dow 17k "perceived " support and an intraday oversold condition in the IWM.

Really there's nothing too special or exciting here, none of the averages other than the IWM/TF are even showing a positive divergence intraday and Dow is just trying to hold 17k as support as you'd expect on the first test of the area.

Personally I'd use any intraday bounce to my advantage tactically to enter positions I may be interested in on the short side that are already well positioned, Financials may be added to that list momentarily, although I have liked FAZ for a bit now.

The Most Shorted Index looks like this.
 MSI (red) v. SPY


Russell 2000 futures do have an intraday positive divegrence 1 min

As does the IWM, but the other averages look like the SPY.

SPY in line

And of course the Dow 17k is a psychological level so initial support at the area is not surprising at all.

High Yield Credit keeps selling off

Here's a closer look specifically at HYG vs SPY the last 2-days.

The market clearly took a risk-off tone last week, especially Friday in risk assets.

Treasuries continues to rise as they were last Friday, one of several things that stood out.


Z Position Update

Z is a short position entered last week, July 2nd Trade Idea: (Swing) Z .

You may recall the only thing I didn't like at the time was Z didn't have much of a reversal process, but it was also very parabolic and they tend to have a more narrow reversal process and we've had a couple of days adding to it since then. I was getting this post ready as Z had hit it's advanced ROC price trend line (the advanced price ROC we typically see before a change to a different stage like from rally to top or a reversal, the change in character is what is important and this seemingly "bullish" change of character is often a red flag warning of a reversal to come.

Since capturing the charts for this post, Z has broken below the trend line, volume was not special and there is a 1 min intraday positive, but the last one failed so we may get a bounce and test that trend line or perhaps even head fake above it, but for now I'm leaving the speculative sized (half) short in place as I don't like the tone of the market since the F_O_M_C and this just doesn't feel like the kind of market I want to get too fancy in without excellent reason and a 1 min positive divergence alone is not excellent reason.

 Daily chart change in price ROC...

The reversal process widened out which I was happy to see. The trend line is the increased ROC price trendline, this is what I was putting this post together for, since then it has already broken down through the trend line.

 The longer term 60 min chart, leading negative at the increased ROC/price area.

The 15 min chart with one last accumulation pocket to push Z higher, it was obviously used to sell in to.

The 10 min chart showing the same.

This is the only chart with a positive, the last one failed. The 2, 3 min charts are in line, confirming the downside of price. I'd need to see the 2, 3 and maybe even 5 min chart go positive before I really considered any bounce that would be worth mentioning.

And the latest capture...
The trend line is broken.

As I sid, not much to do here, I may set some price alerts around the trend line as that may offer a nice add-to or new position entry if we do get a bounce.


Filling Out the SCTY Short Position

You may recall there were a few things I was looking for in the initial SCTY trade set up, one of which was a bearish engulfing pattern which is playing out on a longer 2-day chart which is even better as far as I'm concerned. Last week I brought the partial position up to 2/3rds size on the gap up as that was the first step in a bearish engulfing candle and the lowest risk entry (the phased in 2/3rd size position is up about 3% ), I said I'd fill it out on the confirmation, although we haven't closed there yet and there may be a better entry intraday later, I'm not that concerned about it, I'm looking at this from a bigger picture perspective.

Here's the last SCTY update from last week, Thursday July 3rd, SCTY Position Update.

 This is the larger theme in SCTY, a H&S top at the top of the right shoulder, this is one of of my favorite places to get involved in a H&S top, one of only 3.

 The bearish engulfing candle is playing out over 3 days, however on a 2-day chart it looks like this...

 2-day, that's exactly the confirmation of the long wicked star just previous to the last candle that I was looking for.

As for the 3C underlying trend for the right shoulder, there's accumulation at the neck line to form what became a right shoulder and about +50% rally and then a leading negative divegrence/distribution in to the highs and head fake (which is actually the bearish engulfing candle).

 As for timing, here it is on a 3 min chart, pretty much as clean of a set up as we could ask for and the exact set up that was originally posted on 6/30 (the last day of quarter end window dressing), Trade Idea: (Swing Trade Plus) SCTY.

As mentioned above, I'm going to go ahead and bring this up to full size, first target is around the $47-448 area.


NFLX Reiteration

I still really like the NFLX short in this area, it looks like a high probability/low risk entry in this area which is the classic rounding top with a head fake move that looks like an "Igloo with a chimney".

 Here's the shape of the NFLX move mentioned above.

The long term 4 hour chart's underlying trend is very ugly, this looks like a significant top in NFLX.

As for the most recent move, (right shoulder-like), there's some early confirmation and then pure 3C negative divergences and they are the worst at what would be the "Chimney" or head fake area (false breakout).

 This is the 1 min intraday at the head fake area, we always want to try to confirm the move as being a head fake or a real breakout, this does not look like a real breakout, but the head fake move we see about 80% of the time before all reversals on any time frame.

And the 10 min chart also seeing the same leading negative divegrence/migration, you saw the 15 min chart above.

Again, I prefer wider stops on new positions, especially tops/bottoms, I prefer to take on fewer shares to allow for a wider stop, with an equity short you can always pyramid them up (see Making More Than 100% on a Short)

QQQ Looks Interesting

We had several posts for an AAPL call trade for an upside move I've been expecting. Intraday there's some weakness starting to build in to the AAPL move higher, we'll have to see if that migrates to longer timeframes, but it seems to be effecting or at least not helping the Q's which are looking interesting up here for a fade trade, maybe puts or SQQQ long (3x leveraged QQQ short).

 AAPL 1 min intraday losing a little steam intraday, this has not migrated to the 2 min chart, but I wouldn't expect that with the 1 min just starting to go a bit negative.

 2 min chart still in line...

AAPL 15 min accumulation at the head fake move (yellow)/ stop run.

There appears to be more upside in AAPL, we'll have to see how the intraday divergences progress. As for the Q's...

The Q's were already going negative last week (1 min intraday).

And the 3 min chart negative at the area I'd call a head fake move above a channel or flag-like price pattern.

I may wait for a 5 min chart before looking at anything too serious here as the BTD mentality is rampant this morning thus far.

Opening Indications

Opening action is pretty dull thus far, the Dow did briefly lose $17k and the R2K retraced Thursday's NFP gap.

 Dow briefly losing 17k, of course the "Buy the Dip" crowd seems to be out as would be expected until at ;least
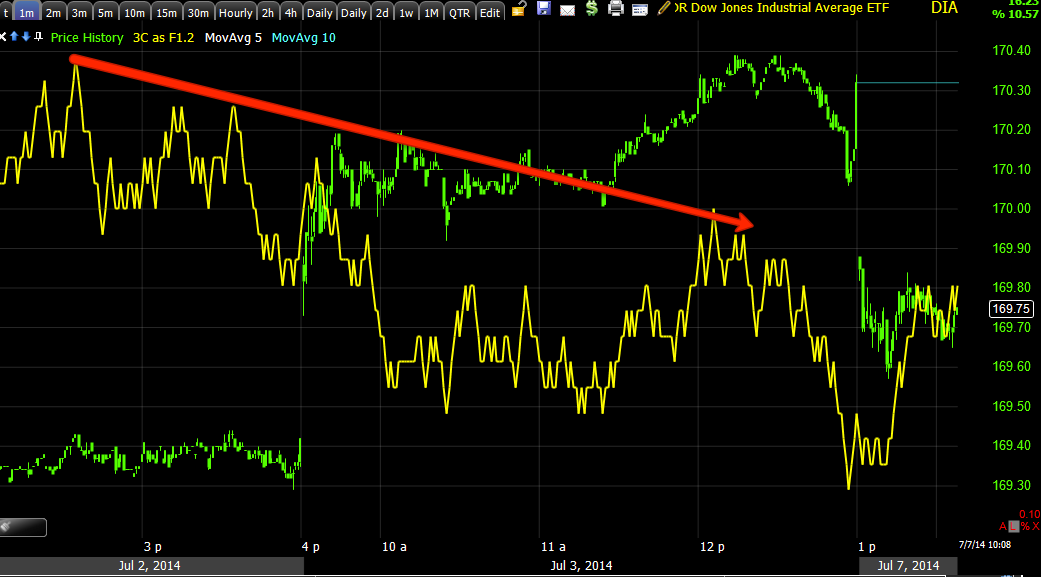
 DIA intraday from Thursday's close with a negative divegrence, 3C picked up right where it left off as you see for the DIA.

 As well as the IWM as the 5 min charts were telling us this move above the channel or flag-like price pattern was being sold in to.

Russell 2000 futures have already taken out the NFP lows.

R2K futures already took out the NFP knee jerk low from Thursday

 It looks like the buy the dip crowd is out as the 1 min IWM is seeing a positive divegrence developing here, but again nothing too surprising or exciting as of yet.

Treasury futures keep climbing though, however USD/JPY has found some short term intraday support around 101.85.

Nothing unusual in TICK sta so far.


A.M. Update

Good morning, I hope everyone had an enjoyable and safe weekend.

The massive US data dump Thursday, which initially knee-jerked as good news is bad news as it probably should have considering the bigger picture and the F_E_D, was quickly reversed, but many things weren't making sense Thursday even as the markets (Dow/SPX) moved to new highs on the half day trading.

I mentioned several of these strange outlier events in Thursday's Daily Wrap, including professional risk sentiment selling off, High Yield credit selling off, VIX not weakening as it should have intraday, the retracement of treasuries with this chart from Thursday's Wrap,

 10 year yields falling despite the rising SPX Thursday.

 Treasuries have now filled Thursday's Non-Farm Payrolls gap as well as...

The USD/JPY which hit $102 stops, but no breakout, I showed this later Thursday as it already started moving to the downside just after the 1 pm close.

The SKEW Index rose again and is over 142 and well within "Black Swan" territory. Gold has continued the pullback we expected and thus far in Europe, shares of miners are pulling back as we expect in the US. Nat. gas for those interested is also down among other commodity softness like the PMs.

Asian markets traded with a softer tone as it diminished from mid to late last week to overnight, the Nikkei -0.37%, Hang Seng -0.03%, Shanghai +0.03%, essentially flat.

Europe is trading with a softer tone, mostly down around 0.50%, the CAC 04 down closer to 0.75%, Financials are underperforming and as we have seen for the last month plus in the US, Utilities, a flight to safety trade are outperforming.

We'll see what early tone looks like, but I'm sure you know I think we are at the edge of something as we are sitting on top or just sliding off the edge of a lot of H&S top right shoulders.

Although Index futures haven't retraced like treasuries or USD/JPY yet, I think they will, that was the point of all the strange action pointed out Thursday.

Here's ES/SPX futures which have been softer since opening this week.
 ES 1 min overnight to present...

ES 5 min and where it needs to go to retrace the NFP gains from Thursday. It will be interesting to see how the 3-day weekend effects opening trade with retail likely placing Dow 17k limit/breakout orders so I expect early tone to probably be a little stronger than later tone, but that's a gut feel.

However we did end the day Thursday with 3C inrtraday negative divergences, Intraday distribution high in to the close,  especially in the QQQ and even over a 3-day weekend, 3C tends to pick up right where it left off, I realize that's a partly cloudy forecast, however that's just the facts of the matter (why we thought they'd wait until Thursday for Dow 17k and how 3C tends to open the next trading day).

Other than that, we have AA kicking off earnings season tomorrow after the bell. My gut feeling is that analysts have a little "too lofty" expectations for EPS and overall earnings for the quarter.

In any case I do expect we'll see the NFP gap filled, the important thing is price movement, that's where we get the most information for forward looking forecasting.

I'll also be looking for positions that are in especially good looking areas, as you know.

Hope you have a great week, I'll be back shortly after the open.

Thursday, July 3, 2014

Daily Wrap

Yesterday in the post, Dow 17K 4th of July? I had noted what a lot of you were writing in, essentially,

"Many of you have written in today suggesting that the Dow $17k is being saved for the 4th of July 3-day wekend where retail can fester and gloat in the new DJ-30 high, setting them up for a nasty surprise on the open of next week...however I don't see why a move above 17k yesterday and further moves today and tomorrow wouldn't be just as if not more effective, it almost seems as if there may be limited firepower to accomplish this goal and that (if what many of you think is correct) it has to be preserved for the right moment like tomorrow's half day in which there will be a skeleton crew on Wall St. with EXTREMELY thin volume making the market a lot easier to move, that still tells you something about what firepower is left in the market if that's what needs to be resorted to."

If I were very sporting I may take out some weekly DIA calls (next Friday's expiration) for such an event, I don't see any positive divegrence in the Q's and we have seen the averages with a 1+% gain in the Russell while the Dow prints red on the same day so if I had to choose, I'd go with the Dow calls, but I'm not that sporting that I'd be willing to see if there's a gain there still available to collect come Monday morning when the market reopens at full staff, higher volume."

This morning on 8:30's massive data dump (3 major economic releases, the most important being Non-Farm Payrolls or the "Employment Situation"), the Index futures' initial reaction was to the downside as good employment news is bad Central bank liquidity/accommodation news.

 However to add to all of the algo craziness (which headline to follow?), at the same time Draghi of the ECB was giving a press conference after the ECB left rates unchanged; he managed to talk the Euro down (as he typically does, however short lived) which sent the $USD up +0.4% which is the best 1 day gain in 2 months (EUR/USD pair) and subsequently the USD/JPY which had already been trading higher due to a stronger $USD rather than a weaker Yen, which is something we've seen in $USDX divergences recently which is part of the reason I suspected a GLD/GDX pullback as they move opposite the $USD as do most commodities.

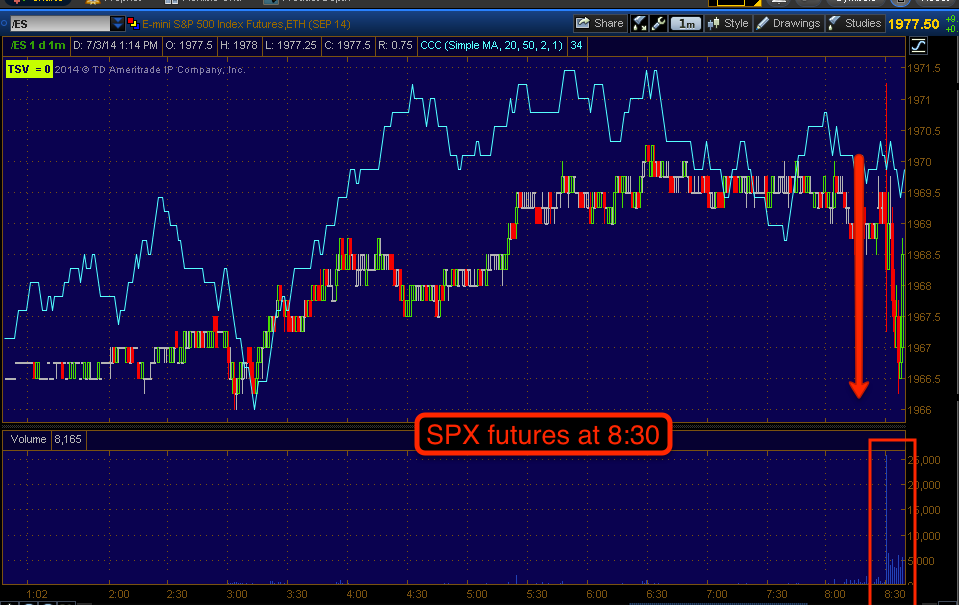
ES futures at 8:30, all index futures initially dropped.

However the EUR/USD fell hard...
 sending the $USD higher...

USD at 8:30 spikes which in turn sent the already trending up USD/JPY pair spiking higher...

USD/JPY with Es/SPX futures in tow (purple).

Even the AUD/JPY managed to gain after the RBA sell-off overnight on bad retail sales and comments from the Australian Central bank, however that carry pair is fading as FX futures are still trading.
 AUD/JPY vs ES (purple) at 8:30 a.m. and AUD/JPY fading after normal hours close. For a more realistic perspective, you have to see the 60+ pip overnight drop...

AUD/JPY with a 60+ pip drop on retail sales and comments from the RBA, the normal hours move looks a lot less impressive here. This is somewhat significant because the AUD/JPY has been one of the only pairs index futures have followed since the BOJ has tried to maintain USD/JPY within a band not to exceed $102.

That's exactly what happened today as USD/JPY hit stops at the $102 level, which I'm sure sent the Bank of Japan scrambling to get the currency/pair back under control.
 USD/JPY today hitting stops pre-market > $102, the BOJ's upper limit of where they'd like to keep the pair.

As you can see by this 4 hour chart of USD/JPY vs ES (purple), the USD/JPY hasn't been an effective carry trade since April and the SPX Futures are drastically dislocated from the pair.

In fact, to better understand the carry trade and why it tells us something about the market, I have some charts. The Carry trade allows institutional money to leverage their Assets Under Management, so long as the Carry trade doesn't decline, they not only make money on the trade itself, they can leverage their funds by as much as 100:1, in some cases even more, but as you can imagine, all it takes is a small move to wipe out the entire fund which is basically what happened to Long Term Capital Management, the Rock Stars of managed money, they just pushed leverage too far and got bit by it, much like retail traders are doing today.

First, what is the carry trade?  This is when investors/institutional money/hedge funds borrow or sell a currency with a low interest rate, in this case the Yen as the BOJ has held very low interest rates since the mid-1990's. At 2007, the Yen carry trade was estimated to be about $1 trillion, but the rapid appreciation of the Yen in 2008 collapsed that carry trade. After borrowing/selling the Yen and then taking the proceeds (on extreme leverage), they buy a currency yielding a higher interest rate like the $USD at the time, the AUD and Euro which makes up the 3 major carry pairs. The difference between the rates can be a substantial profit that the carry traders make. There's danger when the rates between the two currencies fluctuate or say the $USD falls in value vs the Yen, then the leverage factor can cause substantial losses, again read about Long Term Capital Management for a good real world lesson on the subject. Carry Trades are most often used by institutional money when they feel the stock market is stable and in a bull market as this is a way they can leverage their Assets Under Management (AUM),  increasing their leverage to increase gains in unrelated positions like equities or commodities.

Here are the 3 major pairs since 2005 to present. One of the uses of the carry trade for market analysis is when you see the uptrend in the carry start to collapse, that means the carry traders are closing their positions which requires them to often first sell the asset they bought like a stock or commodity, then to sell the first currency of the pair (USD. AUD, EUR) and then return the original currency they borrowed and sold, the Yen, then the trade is closed, this tells us what they think about further gains in the market or elevated risks, no one in finance has forgotten LTCM or how the collapse of the carry trade in 2008 contributed to the US/Global financial crisis.

 This is a monthly chart of the USD/JPY carry trade with 2007/2008 in the red rectangle at the date axis and 2009 in the white rectangle, ES in purple is making the lows of 2009 as you can see. After Institutional money felt there was a trend beyond a bounce and that the F_E_D's accommodative policies were going to be there, you can see they leveraged up their AUM as the USD/JPY quite strongly through the mid part of 2013, since 2014 the trade has been on the decline while the equity market whistles past the graveyard ignoring the red flags popping up.

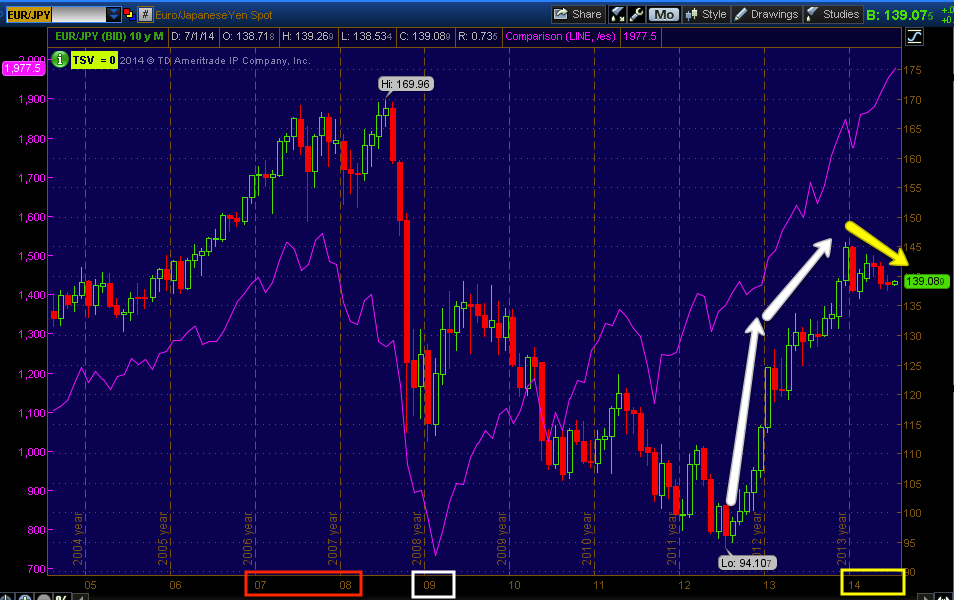
 This is the EUR/JPY Carry, you can see it was in effect in to the 2007 top and collapsed in 2008, it tok a bit longer to restart this carry pair which didn't really kick in until 2012, it too has turned to the downside during 2014 (yellow). As you can see by the candlesticks in 2008, the carry trade can collapse VERY fast, which is part of what caused such an extreme lock up of the financial system in 2008.

And the AUD/JPY which also collapsed in 2008 as the Yen appreciated, this carry was re-started on a less aggressive basis right at 2009 lows, however over the last year and a half it has been moving in a pennant at best. Again, in each of these charts note how ES and the carry trade have close correlation, except right now, as I said above, the equity market s seemingly whistling past the graveyard.

Back to today's event (I just wanted to show the mechanics of what moves the market)...

As USd/JPY blew through $102 stops at 8:30, ES broke out above the volatility of the 8:30 market around 8:54 as USD/JPY provided the ignition for stocks to move higher.

USD/JPY breaks 102 at 8:30, ES breaks above the pre-NFP highs before 8:30 at 8:54 (above the white trendline). As you can see in late trading (around 3:45) the USD/JPY is fading.

This caused an immediate hammering of the VIX on the open, which is now at new lows still stretching back to February of 2007.

 Unlike yesterday, Daily Wrap as the SPX (green) totally ignored the decline in VIX (red)...

Today the VIX gapped down on the open, closing at a new Feb 2007 low (the last VIX low was also Feb. 2007 just a little over 2 weeks ago).

 What was strange however, as the market gapped up via the normal VIX relationship
 Intraday gains after the morning gap up didn't push the VIX or Short term VIX futures any lower as they should have continued to move in mirror opposite fashion to deeper, lower lows on the day,  this suggests some element of protection being bid in VIX (options) as well as VIX futures.

A longer term view of VIX shows today's closing lows and Feb 2007 (yellow) as well as the normal inverse relationship, when volatility is at extreme lows the market is complacent as we know clearly and this often marks a market top (red arrows), when the VIX is high, fear is running rampant and often marks a market bottom as it did in 2009 and after the 2011 -20% crash (green arrows).

While the headlines will talk about new highs and VIX at multi-year lows, it's what the crowd misses that gives you an edge, the crowd seems to have missed intraday VIX activity.

Although the IWM was one of the first to give us a positive divegrence yesterday along with the Dow (see yesterday's afternoon market update, Dow 17K 4th of July?) and closed +0.70%, strangely around 11 a.m. just before the European markets closed, the IWM/Russell 2000 went dead in the water.

 IWM's afternoon positive divegrence yesterday, in which I had posted the above chart and the following, 

"The DIA has a leading positive divegrence, not the typical, but it should do the trick in a half day market with volume VERY low, this is a  2 min chart. I don't usually trade any divegrence unless it's at least out to a 5 min chart so this small period on a 2 min chart doesn't cause me to want to take that risk...IWM intraday 2 min positive, again I would not take the risk of chasing this."

 Here's today's 5 min IWM chart, just before Europe closes it goes dead in the water.

And an odd intraday divergence in the IWM on the 2 min chart which is against the backdrop of larger negative divergences like this one pointed out in the same post yesterday, Dow 17K 4th of July?

The larger underlying trend of the 15 min chart from yesterday's post linked above.

Even with SPX & Dow gains of +.54% and ATHs, the SPX is now on its 54th consecutive day without a gain above 1% which was a record at 48 days not seen since 1995 as market gains/volatility remain extremely low.

Another oddity suggesting our post, Dow 17K 4th of July? from yesterday was right on is the fact that two different markets took the same information in two VERY different ways.

Although the initial knee jerk reaction among the 5, 10 and 30 year treasury futures was an immediate and sharp sell-off on the Non-Farm Payrolls data...
 10-year Treasury futures sell off on the 8:30 NFP...

The equity and bond markets interpreted the data very differently.

SPX (green) vs. 10 year bond yields. 

It seems the market's focus was simply Dow 17k over a 3-day weekend to let that fester and stew, likely setting up a host of limit orders from retail who happily go off to work after placing them over the weekend or in pre-market.

The bond market seems to have taken this much more rationally as the F_E_D is closer (actually beyond ) to it's stated objective of 6.5% unemployment as we hit 6.1% today and considering the inflationary data (and perhaps JPM's moving up their F_E_D rate hikes by 2 quarters in what they themselves described a a rare change that they can't remember having made in recent memory) just as James Bullard warned last week, "The Market is wrong, it doesn't understand how close we are to normalizing rates" (paraphrased). This is the trajectory the bond market took today as 10-year yields fell as protection in the safe haven asset was bid up rather than chasing equities higher.

On top of that flight to safety move in the bond market, we are seeing continued concern as I have been pointing out, yet few in retail seem to understand or even be aware of.

THE SKEW INDEX HIT ANOTHER HIGH TODAY AT 142.28, JUST BELOW THE 6/20 HIGH OF 143.26.

 It's not just the move in to the red zone and highest readings since the CBOE (same people who provide us with the VIX) started publishing SKEW, it's the speed at which the Relative change or Rate of Change has taken place, and specifically in the same month as the last F_O_M_C.

Perhaps those dots that edged higher on the F_O_M_C's charts release on the 18th are really being taken very seriously by smart money or perhaps it's Yellen unconcerned about a stock bubble the same way Greenspan said Housing prices will never fall  or Bernanke's  Subprime is contained. 

Whatever the reason, missing this indicator and what it means is asking for serious trouble as those who know the most are acting the most fearful.
Here's SKEW's intense ROC since early June in to the Black Swan Zone and well in to the 140's.

Why do I say smart money is scared? You have to understand what the SKEW index is telling us, here's a quick definition from the CBOE:

"The crash of October 1987 sensitized investors to the potential for stock market crashes and forever changed their view of S&P 500® returns. Investors now realize that S&P 500 tail risk - the risk of outlier returns two or more standard deviations below the mean. The CBOE SKEW Index ("SKEW") is an index derived from the price of S&P 500 tail risk. Similar to VIX®, the price of S&P 500 tail risk is calculated from the prices of S&P 500 out-of-the-money options.  A SKEW value of 100 means that the perceived distribution of S&P 500 log-returns is normal, and the probability of outlier returns is therefore negligible. As SKEW rises above 100, the left tail of the S&P 500 distribution acquires more weight, and the probabilities of outlier returns become more significant. Since an increase in perceived tail risk increases the relative demand for low strike puts, increases in SKEW also correspond to an overall steepening of the curve of implied volatilities, familiar to option traders as the "skew".Perceived tail risk increases when market participants increase their probability of a catastrophic market decline, what has come to be called a “black swan”.

In short, normal retail options traders are not typically buying puts as they see this market as a never ending upward slope (they don't seem to understand it was the F_E_D's policies that kept the market high and we are way overvalued in terms of forward P/E's with an economy that couldn't support a flat market, but most importantly the thing that kept asset prices moving up is moving out of the business of accommodative policy and even worse, preparing to hike rates which is the EXACT opposite of accommodative policy)  and certainly not extremely low strike price puts and not in such demand that their values exceed the Black-Scholes model for pricing options premiums. 

In short, low strike puts are being bought in increasing size (it's not retail buying them) as to send the SKEW in to the red zone and it keeps moving higher. Smart money's perception is that the market faces a high probability of outlier returns 2 or more standard deviations BELOW the mean or what is known as a "Black Swan". The crash of 1987 was known as a Black Swan.

Adding to the things the crowd missed...

Despite the recent sell-off in one of the most used market manipulation levers, High Yield Corporate Credit which should tell you something as Credit tends to lead and stocks follow yesterday we saw a flattening out of HYG, I speculated HYG might be used today to goose the Dow to 17k, however it couldn't have been further from the truth. HY Credit wanted nothing to do with today's move, they weren't buying it.

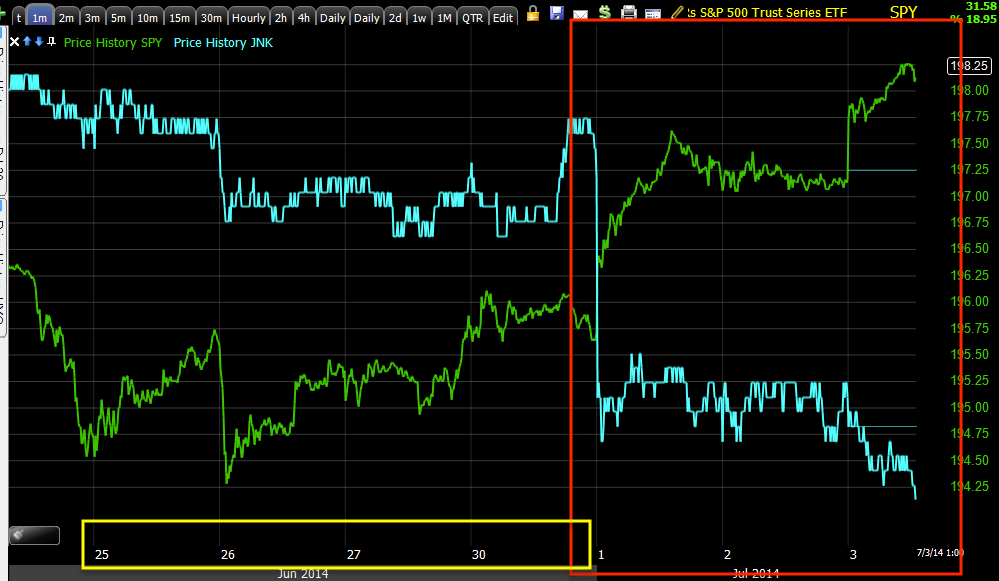
 HY Corp. Credit's recent sell-off, which is rare as it is used frequently as part of the SPY arbitrage to manipulate the market's higher by fooling algos in to thinking smart money assets are in a "Risk on" mode, but someone has decided they've hung around long enough and aren't hanging around any longer in this VERY liquid HY Credit instrument (meaning it's a lot easier to get out of quickly).

Yesterday I speculated that the flattening in HYG's recent downtrend may be in preparation to be used today to help goose the Dow above $17k, I was wrong. Not only was it not used as a manipulation lever, it wasn't interested in following the market in a "Risk on" mode, it didn't care about Dow 17k and kept on selling and getting out.

I noted that there seems to be clear evidence for a Wall St. sponsored flag-like price pattern, we saw enough accumulation in to the 25th of June to say it was a Wall St. cycle and as I often say, "Once Wall St. starts a cycle/move, they rarely let it fail". The only other place we saw minor intraday accumulation was on the 26th as Bullard had made his "Market's are wrong" comment pre-market which sent futures lower and threatened to disrupt the flag pattern with a break below the lower trendline, we saw accumulation there on a stick save, otherwise the only question I asked was how it would resolve and my guess with about 80% certainty was a head fake move above the flag as we normally see. 

Looking at our professional sentiment indicator, it seems they saw the exact same thing and were doing the same thing with the intent of the entire pattern to be to sell in to higher prices which I've already showed you yesterday via longer term 3C charts and intraday that this flag pattern and the head fake above have seen deep negative divegrences. Add this to the list... Our Pro sentiment indicator (Leading Indicators).
They are moving along with the flag-like price pattern and at the head fake where distribution would be the heaviest, they are pure sellers, perhaps buying Treasuries and VIX with the proceeds as we see in the charts above.

But that's not it, more evidence mounts... One of Institutional money's risk on assets like retail would use biotechs or momo stocks is High Yield credit, take a look at the same flag-like area and the same head fake move above only after Q2 has ended and see what high yielding Junk Credit is doing...
Much like everything else we've seen from 3C, to treasuries, SKEW, smart money sentiment, HY Corp. Credit, High Yield Credit has sold off hard, the head fake move waited for the end of window dressing and I can only guess as to why,  during window dressing you are trying to achieve a certain outcome that requires buying stocks, during distribution you are trying to achieve a different outcome that may include selling those very same stocks you bought only a few days earlier for window dressing.

Either way, Credit leads, stocks follow and credit was not buying this move. As I mentioned today in regard to maybe picking up some QQQ puts, it's likely our (and I mean our as so many of you wrote in) Dow 17K 4th of July? was spot on and that's why I decided to wait for Monday as that would be the entire point of Dow 17k on a 3-day weekend, but I did want to show you something so you can understand 3C a little better as I was seeing late day divergences (negative) and interested in QQQ puts...
 This is the QQQ with a 3C negative divegrence intensifying in to the close as mentioned intraday today.  I also included in yellow the Advance/Decline ratio so you can see the negative divegrence in the Q's wasn't for no reason, the actual NASDAQ 100 components advance/decline was deteriorating in to the close. In green, new NASDAQ 100 component stock highs and in red, NASDAQ 100 component stock new lows in to the close, note the uptick in new lows, there was distribution of components in the NASDAQ 100 which shows up on a 3C chart of the QQQ.

Here's a more trend friendly view on a slightly longer chart, make sure you know where today started.

As for positions, I'm happy to see Z broaden out the reversal process a bit, I don't think it will be huge because of the parabolic move, but it makes me a lot more comfortable and I may bring that up to a full position.

MCP you know the story, you saw the charts, it's pretty hard to ignore and seems like there has been inside information on that one for sometime as a recent competitor in the industry just got a fund injection.

As for SCTY, the candle I was looking for looks to be darn close.
At the top of a right shoulder with a Doji and a nearly full bearish engulfing which if it forms all the way will be at least a 3-day chart so the candle reversal will be larger based on the longer chart which fits with expectations.

I might be most excited about our gold and miners trades, I suspect we will get the pullback we have been waiting for, we were able to keep +50% gains and only left 6% on the table, when we see the accumulation in to a pullback, we'll wash, rinse and repeat, except this time I think we move through resistance of the base and to stage 2, obviously the timing of the pullback entry will be key to exceptional gains as well as confirming what I already feel is probably a 90% probability, but we always want to make sure.

I'll have time this weekend luckily as I said in our, Dow 17K 4th of July? post

"Personally I wouldn't mind if any downside was put off over the weekend, it would give me more time to gather more assets that are ready to enter positions in rather than scrambling all day and in to the night."

To gather more assets that are looking ready. 

That said, have a fantastic and safe Fourth weekend!