Friday, October 3, 2014

Quick Market Update

While it's not as obvious in the SPY, DIA and QQQ, the IWM is definitely throwing negative divegrence signals to the point,  it is coming down intraday, that may help answer some of the other questions as we see how it acts as it comes down.

I'd expect the other averages to follow, but perhaps the IWM leads and has the worst relative performance.

Closing Out Oct. 3rd XLF $23 Calls

On September 24th I posted, Trade Idea: (Short term options) XLF Calls which was a speculative long position on Financials, those expire today and are up 144% from yesterday, while still being at about a 50% loss.

These were a speculative size so it's not anything that hurts, but I figure I might as well take what's left of them rather than take a chance on the rest of the day and them perhaps losing all value.

If I has an expiration that was a week or more longer, I'd hold them without question, but they do expire today for me so I'm going to go ahead and take the loss of about 50?% of the position and salvage what's left.

Futures and Leading Indicators

Earlier in the week and numerous times in the past I have said that the 5 min Index futures' charts divergences were a minimum for me to take a TRADE, we quickly got those for confirmation and we have some other interesting things going on. Leading Indicators are proving the concept, but also are giving us a message, right now it's very early in that message so although I understand what the bias is, I don't yet understand what the timing is as they are rather new.

There are quite a few charts here so if you don't have time to look at them now, maybe swing back later as these are probably very pivotal in understanding short term trade, the Week Ahead as well as how you can use the price movement right now (not by chasing it) to your advantage.

Lets take a look...

What I'm considering is multiple timeframe analysis and multiple asset confirmation.

 As already proposed, it seems as soon as 4 p.m. Tuesday hit, we already started seeing accumulation for Oct. 11st which is where I expected some accumulation and a bounce to start forming because the accumulation would have to wait until the Window Dressing period had passed, there's no point in selling poor performers to get them out of your portfolio in your holdings filing only to add them back in accumulation for a bounce. The end of the quarter, which I'm not entirely sure where it ends (may be different for different types of funds) for reporting, but I suspect 4 p.m. on the last day as there were signs of accumulation right after Tuesday's 4 p.m. close.

In any case, the bare minimum 5 min chart (NASDAQ 100 futures) above is in place.

We even have a strong SPX Futures 15 min divegrence, again note the heavy accumulation late Wednesday when I made the quick end of day changes out of SRTY and SQQQ and in to URTY and TQQQ which paid off yesterday alone and continues to today.

 NQ (NASDAQ Futures) are also confirming the divegrence on a 15 min chart so this looks to be a strong divegrence, even though a fairly small base.

As mentioned earlier, get use to seeing sharper bases like this as counter trend rallies in a declining market or bear market are quick, rip your face off and very strong rallies, they have to be to have any effect.


And the Russell 2000 Futures (TF) also confirm.


We have positives out to a 30 min chart on ES above.

Also NQ

And TF, that's multiple timeframes and a strong divegrence itself even though the base is small. How is this possible to get that much gas in the tank in such a short period? It was the size of the declines and all the stops they hit, look at volume as these were being accumulated. As I said at the time, "There's huge supply available at cheap prices" and I wondered why traders never ask themselves, "Who's on the other side of this trade?" Someone is and that;s an easy way to accumulate in size , quickly with apparently no one catching on to what they are doing as everyone is focussed on price rather than underlying trade.

 We even have a 60 min positive in SPX Futures, however...

NQ and TF 60 min charts are closer to in line.

So the feeling I get is that this bounce has the capacity for a significantly higher move than what we've seen thus far, but does it pullback and widen out its base?

I also mentioned treasuries this week looking like they are seeing rotation out of their safety and in to risk assets, this is 30 year treasury futures on a 5 min chart with a negative divegrence

 ... and look at the day, out of T's and in to Index futures.

 The 15 min 30 year Treasuries also have a leading negative divegrence, so I'd expect to see TLT lower in the days ahead, but there definitely looks to have been rotation from safety to risk, which I would think wouldn't be worthwhile for a 1 or 2 day bounce so again this points to a bigger move than what we have seen thus far.

 Even the 30 min futures show a negative divegrence.

And as far as multiple asset confirmation, the 10-year Treasury futures on a 30 min chart also have a negative divegrence.

 As do the 5 year T's, which is what we use for a leading indicator, the 5 year yields, so a dropping 5 year treasury means a rising yield and they tend to attract the market toward them like a magnet, so more leading indications of a higher move.


As for TLT, the 20+ year Bond Fund... I have to wonder how much of this may have to do with PIMCO redemptions as Bill Gross, co-founder of PIMCO in 1971 just left the company to join Janus, thus there are bound to be redemptions just from loyal clients who want to follow him to Janus,. The question is, how much of the 3C signals of distribution are PIMCO liquidating to meet redemption calls (while  bill Gross gets to pick up the very same treasuries on the cheap) and how much is rotation in risk off to risk on?

 TLT 30 min showing our August 28th "pullback" call at #1, then at #2 our call for the end of a constructive pullback and gains from there  with more recent negative divergences like the Treasury Futures above. Again, the same questions regarding PIMCO swirl around.

 TLT 5 min negative and a turn down

 And the sharper TLT 2 min negative with a little support today, this makes me wonder if we see lower prices today and whether those are op-ex related or perhaps base widening or just messing with sentiment before the weekend and taking the market higher early next week.

My custom VIX inversion indicator is not seen above as there's no signal, but the custom SPX/RUT ration shows every confirmation/non-confirmation signal that has guided the SPX above with a current positive signal in the indicator.

 HYG, High Yield Corp. Credit's longer term picture as it leads the market since June and in to our August cycle , it once again is leading this bounce as well.

Here's a closer look at HYG's positive divegrence vs the SPX, again another sign of early warning that allows us to enter at the best prices and lowest risk.

 Look at the HYG/SPX correlation intraday!

And HYG's divergences, a 10 min positive so there's good support from HYG.

The 3 min chart is in line or better

The 1 min chart doesn't look like the market is going to lose much ground today, at least thus far so the pullback and wider base theory don't look strong right now.

 Longer term HYG's 4 hour chart should leave no question as to where this market is headed.

Sentiment is all over the place, our first indicator has a nice leading positive for the bounce

Intraday it has a slight negative, again, the question of whether a bigger base is coming,  which would be useful to any who wanted to enter a leveraged long ETF.

Our second sentiment indicator seems to suggest we do see near term, maybe an intraday pullback.

Right now yields are perfectly in line with the SPX, however if the Treasury Futures (5 year) charts are correct, then yields should rise and they tend to pull the market like a magnet.

Finally HY Credit put in a leading positive signal, but looks a little like it's in consolidation move here.

The questions are pretty simple, I do think we get nice additional gains in to next week, but do we pullback a bit today to widen the base, if so, the gains could be even larger than I anticipate at present and you may have a chance to enter or add to long trade positions.

As we see weakness building in, like the Sentiment chart above, we'll want to watch for more of that as that's our key to start entering and filling out short positions, many of which are still in set up mode and just needed some upside market support for near perfect entries from a risk/reward and timing perspective.

This is a good baseline to judge additional market updates by.

A.M. Update

It's a rough morning after a 7 hour drive last night and getting about an hour of sleep so hang in there with me as I get up to speed (connection problems and everything else this a.m.).

Futures were up overnight, presumably or at least in part due to worse than expected European Services or non-Manufacturing PMI's with only Russia and Germany beating, however Germany missed on the all important manufacturing earlier this week as Germany is the manufacturing dynamo and growth engine of the EU.

So it seems bad news is good news , either that or the op-ex pin was higher, but either way, all of our recent data has pointed to higher prices in the near term which is why some of the leveraged core short positions were flopped over to long late Wednesday.

On the Non-Farm Payrolls, we have good news is good news as the 248k beat over consensus of 215k and above Augusts's revised +180k (up from 142k), which breaks the +200k addition streak, but has now created the longest job growth streak in the US's history since tracked. The unemployment rate dropped from 6.1 to 5.9.   F_E_D... steady as she goes, QE will end this month.

However the F_E_D whisperer (not my creation, but a great name) from the WSJ warns not to get too giddy about the jobs beat as it is a F_E_D net negative, earlier rate hikes perhaps?

In any case I'm interested in what the market does and thus far here's what we have...

There was a bit of an MSI short squeeze, nothing impressive enough to capture.

 While the SPY, DIA and QQQ's 1 min intraday chart is trying to catch up to confirm the gap up,  because late yesterday we had negative divergences in to the close in the 1-3 min range suggesting a little more base building before we move too far north on the bounce.

However, this 5 min positive is still the bottom line, this is still the sponsor of the bounce and it still looks great, even though the bottom is very "V" shaped, but we'll be seeing more of that as downtrends continue like the IWM's and bearish trend counter trend bounces will be sharper like this so we'll have to get use to seeing this.

 DIA trying to catch up as well, but the bottom line is this 10 min positive (note the prior negative,nearly perfect forecasting).

 QQQ 2 min shows the negative afternoon divergence from yesterday.

QQQ 1 min shows the market trying to confirm the gap up...

And the QQQ 15 min leading positive divergence is still the bottom line or the most important chart for the bounce itself regardless of intraday trade.

 The IWM 5 min and the IWM is the only average that seems to not be trying to confirm the gap up this morning.

 Here's the 2 min negative from yesterday

And the 1 min chart not trying.

Since capturing these, all averages EXCEPT the IWM, have confirmed the gap up on a 1 min timeframe, we'll see what happens , if they can get to 2 min, if so, then our base building is probably done and we continue to bounce from here.

Is anyone glad we closed FXP yesterday?

I'll be adding some additional small updates as I catch up and find new indications that are of use to us in either entering the long trade if you haven't already or managing it, depending on what those 2 min charts do now and the IWM of course.


Thursday, October 2, 2014

Daily Wrap- Get Your Contrairian Hat...

I'd say about a week or so ago I said, "I don't like it when too many people are calling for a top at once", bear markets surprise, often they decline sharply on what is otherwise good news, a testament to how important market breadth is as even good news can't sop the rot that has set in from turning to an all out collapse.

I made mention of Elliot Wave International's Robert Prechter, even though I personally don't follow Elliot Wave Theory (as I notice many practitioners son't agree on the count and they always have the fall back "Alternate Count", like saying the day will be partly cloudy so if it rains you are right, it if doesn't you are right.

There were also two Hindenburg Omens which generate a lot of talk, but we've seen numerous clusters and while I don't doubt they are a condition that precedes a bear market, I do not believe that they are in and of themselves a harbinger of a bear market.

In other words, there are too many people bearish right now and that includes even retail. Since I've had an intense interest in the psychology of bear markets and how investors that made a killing on the way up so often lose it all on the way down, a member sent me an article that touched on some of this.

NASDAQ Market Timers represented by Halbert NASDAQ NewsletterSentiment Index is interesting as a contrairian indicator. Since the Sept. 19th high, HNNSI has declined 75.5 percentage points from a net long 68.8 to a slightly short positioning of negative -6.7% so the typical "Buy the Dip" crowd, is not in fact buying the dip and this on an approximate -2.85% decline.

What I found interesting was the same indicator back at the Tech Bubble top of March 10th saw a n 18% decline over the next 3 weeks and during that period HNNSI actually rose, even though the -18% was 2% away from a media's definition of a bear market, the longs saw it as a buying opportunity and from there, it's easy to see how small bear market counter trend rallies can keep their sentiment bullish as a new low is made which they then swear they'll exit the position once price reaches the area in which they entered long, of course it never does, but each bear market rally gives them hope that "this time the market will get to my entry", even though the market knows nothing about your entry and as easy as that, you can understand psychologically how people lose it all in a bear market. After 5+ years of one scenario, it can be difficult to adjust to a totally new scenario, in fact most don't believe it's possible, that's the "New Normal" crowd or the "F_E_D has our back" crowd, both are desperately wrong as history has proven over multiple centuries and all kinds of bubbles.

Last Friday I was thinking about the number of bear market calls and uneasy, but I wasn't thinking of that in regard to the post-window dressing/post Q3 bounce which it seems we are well on our way toward making a reality, although looking at the bigger picture, I believe that sentiment does have something to do with the fact the market looks ready for a bounce , yet this doesn't change any of the bearish realities of the market, just perceptions of when and where. Looking at year to date data, I think it's not hard to make a case for a bear market right now especially as the Russell 2000 leads and is negative on a year to date basis as well as a 2014 basis.

Now the specifics...

IT doesn't take a candlestick charting guru to see today's closing candles were all bullish reversal candles from the SPY's Hammer, the QQQ's long-legged Harami reversal, or the IWM's bullish Thrusting candle RIGHT AT THE COMPLEX H&S TOP'S NECKLINE!

Take the closes as well, after the initial decline the SPX managed to close perfectly at unchanged on the day. The NASDAQ 1000 pretty close at a +0.03% gain, the Dow just as close at a -0.02% loss and the IWM putting in an impressive, +1.01% gain on the day, bouncing off support that equals the break of a major year long top!

Today was the R2K's best day in 6 WEEKS! What's that tell you about the late day signals we saw yesterday prompting this post Position Management & Trade IDea : QQQ/IWM in which the long term SRTY long was closed as well as 3x short QQQ, SQQQ long and replaced with 3x long IWM, URTY and 3x long QQQ, TQQQ yesterday. For the IWM repositioning, the timing doesn't get much better than that so we were out of SRTY and in a 3x long IWM the same day it had its best day in 6 weeks.

Last night's Daily Wrap breadth analysis, Sector performance and Dominant Price/Volume Relationship, compared to yesterday's market performance, were spot on today.

As for today's internals, the Dominant Price/Volume Relationship of the component stocks of the major averages was split, the Dow came in with 16 at Close Down/ Volume Down which I call, "Carry On" as there's no strong 1-day implication for the next trading day. However the NDX at 41, the R2K at 1245 and SPX at 205 all came in at Close Up/Volume Down, suggesting a 1-day overbought condition in which the next day usually closes down.

This could indeed be the widening of the base I have mentioned and would prefer to see as I don't think much will happen with tomorrow's Op-Ex max-pain pin, but we also have Non-Farm Payrolls at 8:30, so however they come in, HFT's can set the early tone and interpretation of the data series no matter what it actually is as they can move pre-market futures as the market is all about sentiment, not actual value or data.

As for the S&P Sectors, you saw in last night's post what the 5, 10 and 21 day averages were, not good at all, but also helpful for the oversold condition the market can bounce off even though on a price basis we are not even close to oversold, but on a breadth and sentiment basis, we are right there.

Three of 9 closed green today with Consumer Discretionary leading at a +.46% gain and Energy lagging at a -.52% loss.

As for the Morningstar Industry/Sub-Industry groups, 149 0f 238 closed GREEN, yes, GREEN, a huge change in recent character supporting the bounce concept from last Friday that we already took action on yesterday, there's still time at the right place to get involved.

Our main breadth indicators were essentially as flat as they could possibly be today, another significant short term change in character.

Leading Indicators looked like this...

 My VIX Inversion hasn't been higher since the August cycle base, meaning fear is running high, but not at a buy signal.

HYG led the SPX perfectly today and it ha been brought in to help out which is what we saw earlier in the week and with HYG divergences in 3C before that.

HYG vs SPX on a slightly longer basis leading the market again as usual.

 Our Pro Sentiment Indicators have been strong and today even stronger for a short term move/bounce.

And High Yield Credit which called the top is calling for a bounce here.

Most of all, 3C is giving the strongest signals.

For an overview...

Although we put in strong additional positive divergences today such as the SPY 5 min...
 Also note our theory of no accumulation until Q3 and Window Dressing were over is pretty much correct as yesterday is where accumulation started, Oct. 1 Q3. The 5 min leading positive divegrence is more than enough to hold a bounce trade, but it gets better.

However short term...
 The 2 min IWM is a perfect example of end of day trade suggesting a pullback and/or broadening of the base area which is good from a quick long trade perspective as well as tactical short entries.

However overall, look at the 15 min leading positive divegrence put in today alone in the QQQ.

We have significant divergences, time to build more on the basing area and are already set with trades as well as having preserved gains in SRTY and to some extent, SQQ.

We have Non-Farm Payrolls tomorrow, one of the biggest data points on the week, but early knee jerk responses could set the initial tone which may help establish a larger base. We also have the typical op-ex max pain pin that should last until about 2 p.m. As I said this morning, if we didn't lift off higher today which IWM did and how about MCP, but the rest of the market didn't, then I wouldn't expect anything to start Friday during the op-ex pin, maybe after 2 p.m. when the pin is released, but I rather suspect most of the action will come early next week and then we'll transition back to SRTY/SQQQ as well as any other shorts that allow us a nice tactical entry at lower risk and better prices while this bounce is under way.

I'm off for Georgia, but I'll be covering the market all day tomorrow. Have a great night.


Quick EOD Update

Tonight, after the close in fact, I'm driving from South Florida to Savannah Georgia so I can be there in time to cover tomorrow's market.

I will post an abbreviated Daily Wrap after the close. 

What I see right now is some intraday 3C weakness, I suspect it's either op-ex related or we are going to continue to build a larger base. An Op-Ex Friday is not an ideal day for a bounce to start with the normal max-pain pin in place, unless the max pain level is higher, but after 2 p.m. the market pin is released.

The longer term or intermediate 3C charts support a larger base and if we do get a bit of a pullback, I'm very likely going to add to the 50% URTY and TQQQ 3x long IWM and QQQ positions.

For now though, I'd expect some near term weakness that broadens out the base, which for a bounce, will give it a more stable platform, a base that's easier to trust and a stronger overall move.

I think we have a good speculative counter-probability or trend as the IWM goes, trade in place or still have time to put it in place before re-entering short positions like SRTY. The vast majority of long term core shorts I'm leaving in place, just the easier to trade 3x leveraged ETFs like SRTY, SQQQ and FAZ.

I'll have more shortly.

FXP Follow Up

After closing FXP, the P/L looks like this...

 We have over a +23.5% gain as we closed out at $56.53 rather than $56.18.

Here's where we entered FXP long (white) and today's exit (red). I do look forward to re-entering FXP as the longer term trend in 3C supports a lot more upside, but for the time being, I'd rather take the gains  and wait this out as it is screaming pullback.

FXP (long) Position Management

We first looked at an FXP (2x Short China 25) trade set up in August, Trade Set-Up FXI / FXP, we let the trade come to us on our terms and entered on Sept. 9th, Trade Idea: FXP (Swing to Position Trade) Long.

Since, we have gathered a 23.4% gain since Sept. 9th. All of the near term evidence suggests we see a U.S. market bounce as we expected in last Friday's week Ahead, after the quarter and Window Dressing ended, so far we are on track. China is likely to follow, although I think it's a short term move, you still may want to take action in positions like FXP in which we have a nice gain in a short period to protect the gain and re-enter the trade when the bounce looks to be over.

 First the daily FXP hanging man bearish reversal candle and on volume, is not a good near term sign for this China 25 2x short ETF.

The X-Over system applied to FXP gives a long signal and a pullback target to the area of the 22-bar moving average around $50.

The 1 day trend channel has a stop a bit higher, I think a wider 2-day is more appropriate...

And that puts the stop somewhere around $50 as well

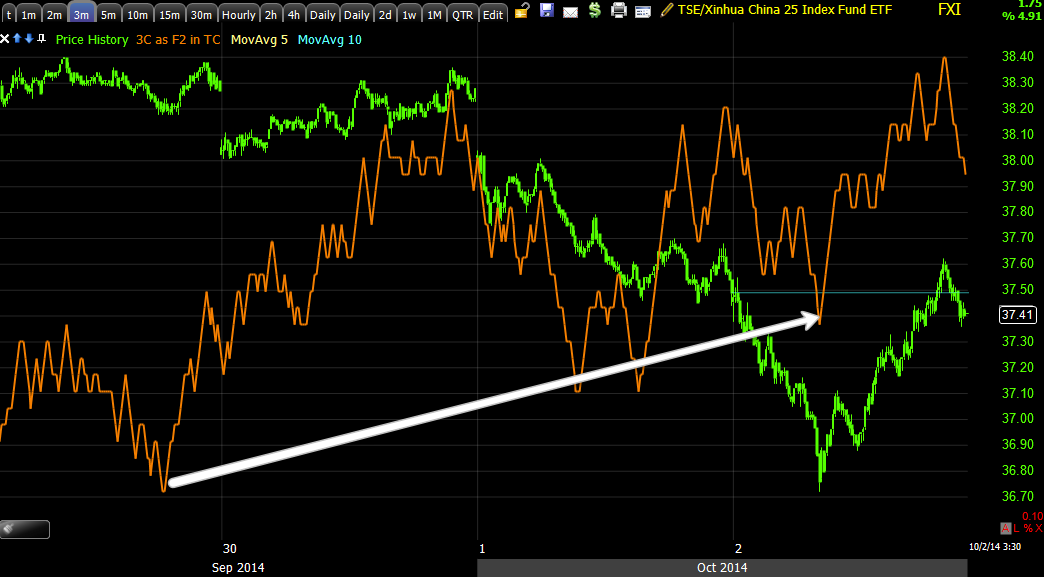
FXI, China 25 long is showing a 15 m positive divegrence meaning FXP should pullback as FXI bounces.

 FXP's 10 min chart has a negative divegrence suggesting a pullback as well and giving multiple asset and timeframe confirmation.

 The 5 min FXP is a better timing signal and it's negative right here where we expect the post Q3 bounce to start to be put together, which makes sense as this is a 2x short on the China 25.

And FXI's short term 3 min chart has a positive divgerence, again confirmation.

As well as FXP's 2 min negative

Overall, I think FXP remains a longer term long, as this hourly chart shows, but in the mean time I expect a pullback and will be closing FXP for the time being to protect those gains until the pullback is over / market bounce over.