Tuesday, December 2, 2014

Transports Trade Set-Up / IYT

Taking a quick look at some airlines and the Dow US Airlines Index, I don't think these have seen anything resembling their bounce, but they do look like they ar preparing for one which makes Transports, a core short I've held open for some time and continue to do so , it's at a -7% loss, but considering how volatile transports can be, how volatile tops can be, it's really not bad draw down. I would consider adding and for those interested in a potential new short position in transports, I'd be setting upside price alerts similar to what we are doing in AAPL. If the trade comes to us on our terms with a better short entry, less risk and a clear skew in probabilities, I see no reason not to take on Transports short.

I believe in the position and have kept it open even at 7% draw down because of the charts and how it has behaved and the changes in its behavior.Again this really hasn't moved much so I think there's a good chance we get a shot at this one with a trade that comes to us.

 First the trend line at #1 was already on the chart. This is an example of an asset that we saw a positive divegrence in, knew it was going higher (along with the broader market that was also showing positive divergences, thus our forecast for a face ripping rally). I could have closed IYT short at that point at a gain, but as a core short position, with what's coming, it wasn't worth trying to trade around this one and potentially miss the AAPL moment.

The trendline at #1 was drawn for a previous post showing the concept of "Wherever you see the first 3C divegrence, price will surpass that". Said more plainly, when the first positive divegrence in IYT was seen, had I bought it at that time (at the red trendline), I could expect price to move at least to that area and 90+% of the time, significantly higher.

The second trendline shows where the Trend Channel had a daily (on the close) stop out for this trend, as you can see it has been hit.

For those of you who know about my Trend Channel which was the first custom indicator I won an award for, it is a objective way of deciding when to get out. Far too many times I have been in trades and had a nice gain and exited only to see that gain doubled or worse. The Trend Channel is not like an envelope channel or Bollinger bands which have pre-determined settings that may or may not have anything to do with the volatility, Beta and character of the stock that the channels are set to track.

The Trend Channel reacts specifically to the individual asset it is applied to, determines what is "normal" price action, volatility, consolidations, etc and then sets an average of the norm and surrounds price with a multiple standard deviation (the channel), a break (in this case) below that standard deviation or the highest point of the lower trend line is a stop out telling us something significant has changed in the character of the stock by a measure of standard deviations above and beyond normal.

This allows the Trend Channel to follow a long term trend, allow the stock to consolidate without stopping it out, which envelope channels can't do,  as the channel is reacting in real time to the most recent changes in trends and behavior. Thus you'll never stop out at the highs, but when you do get a stop out, the easy money of the trend has been made. Often there's additional volatility in a wide, choppy range and if you're lucky you might get a better exit, but usually by a percentage that is so small it's not worth the risk in such a choppy , volatile environment that often reverses to the downside unexpectedly and quickly starting a new trend.

So after the initial stop out as Transports have done for this trend, there's some additional volatility most of the time (the reversal process) and that can be used to enter positions just like AAPL. If Trannies make a move higher after already having given a stop and they show distribution in to that move, that's the highest probability, lowest risk and best entry...the same as what we are looking at with AAPL.

 Much like BABA, Transports have seen a Channel Buster as well. Channel Busters come in a few variations, but the initial break BELOW the channel almost always tells us we'll see a move back ABOVE the channel (as volatility increases and we no longer are trading in the channel).

The most common resolution in this scenario before we even consider anything else in trannies is that the move ABOVE the Channel will lead to a sharp decline back below and start a down trend, which is what we have been trying to determine in BABA since we called its Channel Buster which had a target that was hit , predicted 2 weeks in advance as well as the pullback which started the next day after a strong +4% gain on the day the post was released.

 The long term 2 hour 3C chart is one of several reasons I consider this a long term core short. The up trend at the green arrow saw 3C confirmation agreeing with the move higher and that it would continue until there was a change in the upside rate of change in price (just like BABA) at the orange arrow which was a red flag and warning that the trend was soon to change.

Then we had a spate of numerous negative divergences, on this long term chart you can see the most recent rally has the deepest leading negative divegrence, much stronger than the last divegrence that sent IYT lower and put our position at a decent gain.

 The 60 min chart has much more detail and we relied on this early on. Note the negative to the left at a head fake high (yellow arrow) which is a failed breakout in this case, causing significant downside momentum as it creates a bull trap.

The accumulation I mentioned from the first chart above can be seen in white and the distribution in to the trend is quite clear , especially around the area of recent downside volatility.

 The 15 min chart shows a strong negative divegrence right in to the gap up, almost immediate distribution sending IYT lower and since it has not put in a divergence that has reached this far out, thus I don't see a big  or long lasting bounce and in context of the daily chart and core position, I think you could enter here and a bounce wouldn't change anything and 6 months from now you
'd be very happy you did, probably not even being able to discern the potential bounce we are considering right now.

In other words, when viewing the forrest rather than the trees, IYT is already in a great area, a little help with a better tactical entry probably won't be worth missing the trade potentially, but I believe with price alerts we can probably get a better entry and if not, there are lots of other trades.

The most significant thing about the 15 min chart is the strength of the negative divegrence and the total lack of any positive divegrence on a 15 min chart, which doesn't mean that there isn't any positive divegrence, just not anything strong that concerns me with the open IYT short.

 You have to move to 1-3 min intraday charts to see the positive divegrence, again along the lines of an oversold bounce and near term transports are certainly oversold.

This 1 min chart doesn't show any negative activity intraday so I suspect a bounce in trannies is coming. I'm setting price alerts from $164 to the $168 area and will be looking for an excellent high probability, low risk entry as the trade either comes to us or we move on to something else.


HYG / VXX Another Lever

This post is meant to be taken with the other market updates,  posts such as the earlier, Early Indications and Looks like USD/JPY Lever Will Give Out as these were the assets predicted to help the market (which is telling in itself as the market needs the levers and can't get off a simple oversold bounce without them) with a bounce, thus their failure tells us where the market is likely to fail on a bounce and where we have our best entries and lowest risk.

Again, this early in the day (considering most serious trade is in the late afternoon) and I don't want to prematurely say the signals coming through on early charts (where all new divergences start, even the fade of a bounce) are a signal that this bounce is dying already, but I do have to make you aware of what's going on so when I update later you can see where we've come from and have a better idea of where we are and where we are going.

I'm hesitant to add TLT to this post just because of the possible convergence trade, but for now I'll include some of the early intraday signals until I can get a proper TLT update out, which I'm actually waiting on to see how a few charts pan out which will tell me a lot more as to whether there's a convergence (short TLT/Short SPX) trade in play..

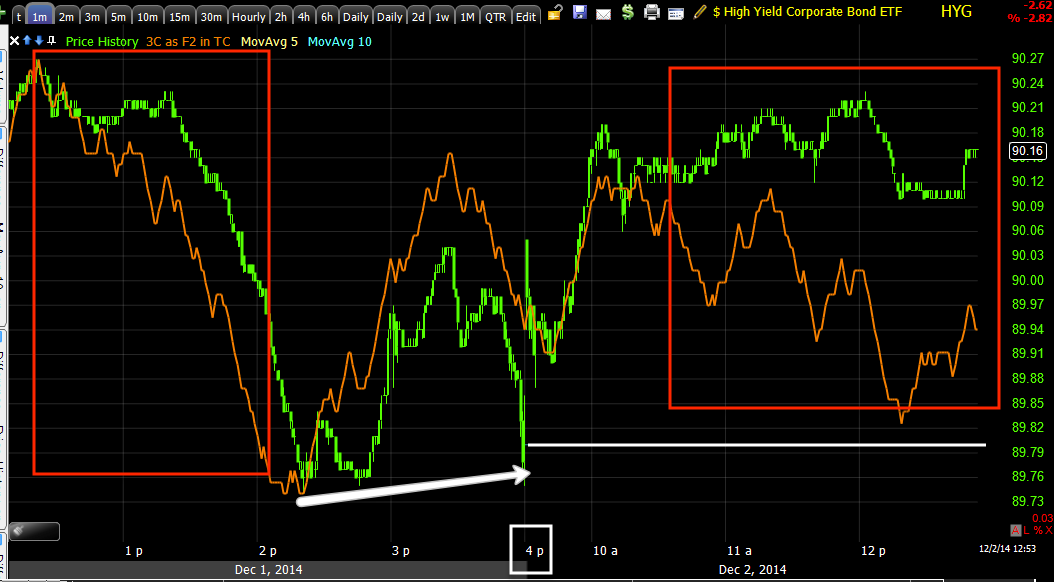
First HYG as this is one of the most popular levers. I can't stress enough that the most important chart for HYG is this one...
No 3C HYG chart below holds a candle to the implication of this chart's leading indication which I can't stress enough how ugly this is for the market overall, it's spectacular and as far as I've seen, without precedent.

I'm going to add a few "Big Picture" charts so you have some context, they provide the roof or floor for any shorter term moves based on shorter term charts.

First HYG...

 HYG 2 hour trend is quite clear, divegrences at every high with a new leading negative low. The price trend itself is clearly bearish even without 3C, but this shows the extent to which HY Credit has seen outflows and is damaged as a leading indicator for stocks.


 HYG 1 min shows the positive divergence LEVER for today's bounce which was at the close yesterday and this morning. It is already seeing a lack of confirmation and negative intraday divegrence.


The 2 min chart showing the same features (the support positive divegrence for the bounce/lever  today) and a negative migrating to the next longest timeframe.

 The 5 min shows the lows that were accumulated on the 19th when I wrote that HYG was causing me some concern with that positive divegrence, the Black Friday (week) sentiment support to make sure the market didn't come down and make consumer sentiment worse than it was in front of Black Friday.


This is the 5 min HYG chart showing the divegrences for it to move green today, activate the SPY arbitrage and act as a lever of market support. I'd say when this chart starts seeing the same negatives on the 1, 2 min chart, we'll have seen the end of this bounce and will want to move quickly to load up on short positions and close out any market correlated longs that some of you (thanks for the emails) entered yesterday- I was hoping that someone took advantage of the information, although I urge a lot of caution and tight risk management.

VXX-Short term VIX futures, the 2nd of 3 assets in SPY Arbitrage which needed to move down today to support the market as was posted numerous times yesterday and pre-market this morning.
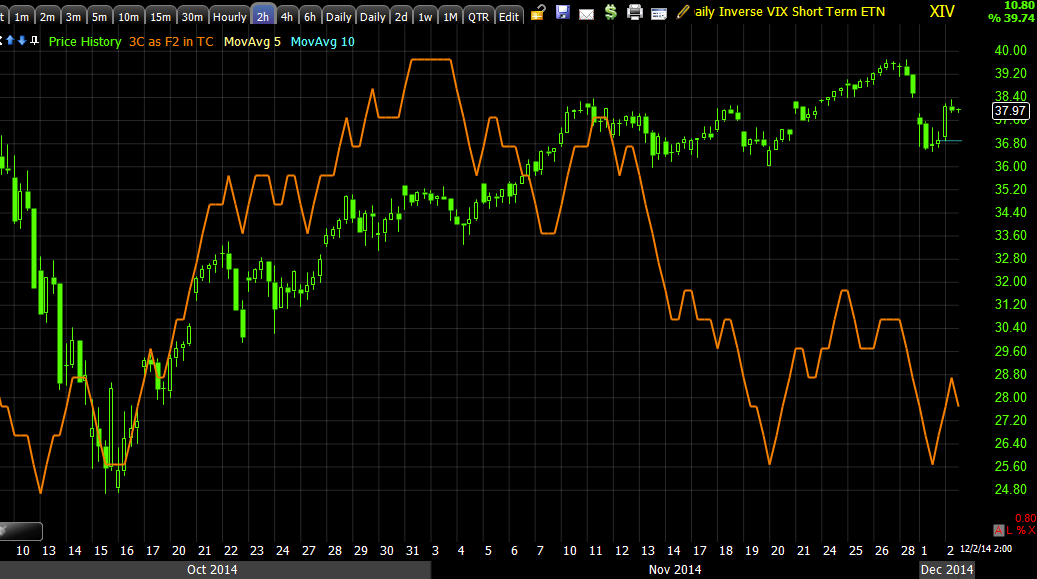
 This 2 hour chart should give you a feel for the big picture. Just for multiple asset confirmation, XIV is the inverse ETF of VXX, it trades opposite VXX and with the market so looking at the same timeframe in XIV...

 We have confirmation via a massive 2 hour leading negative divegrence. Someone has been very busy accumulating protection/VIX.


In the spirit of multiple timeframe analysis/confirmation, this is VXX 60 min leading positive after the last relative negative at the October lows (VIX highs).

And XIV on the same timeframe confirming with a leading negative divgerence.

VXX has seen some recent accumulation last week, interestingly right before Sunday night and Monday's sharp crack lower in the market.

 XIV confirms the same as it was sold in to heavily last week/Friday before gapping lower yesterday.

 VXX's 5 min chart's main feature is a large positive reflecting the 15 min charts above at the same area as well, the minor feature is a small negative to the right which is the ramp/lever to activate SPY Arbitrage which needs HYG higher as it is today and TLT and VXX lower as they are today.

 Intraday VXX is showing improvement and positive divergences/accumulation as the gap from yesterday is filled.

 XIV 1 min confirms as it is sold in to higher prices as it's gap down yesterday is filled.

VXX 2 min seeing migration and a stronger divegrence building suggesting  that this lever is about to or is starting to break as well like USD/JPY.

 TLT (20+ year treasury fund), a proxy for the long end bonds like the 30 year.
 While my larger analysis on TLT will have to wait, the gap down is market support via the SPY Arb lever and all 3 of these assets were predicted yesterday to support the market bounce today.

Again however we are seeing intraday improvement on the 2 min above.

 As well as the 3 min meaning migration or a stronger divegrence forming.

And even on the 5 min.

We'll check these again, I won't have to post so many charts if any as you now know where they stand and anything from here on out tells us a lot more about where we are in the bounce process.

Market Update

I'm going to keep the market averages and Futures updates separate, again because of the chart upload time and the potential for very fast moving underlying trade as well as price.

You'll see VERY clearly in this update why I suspected the Q's would be the under-performer today and also why I believe this is a 1-day oversold bounce event. Remember when I'm talking about oversold it's not traditional indicators like oscillators showing oversold as they can stay that way for a long time, but yesterday using price action and volume we called the exact oversold/bottom around 10 a.m., so I'm using a lot of volume analysis in determining overbought/oversold, not indicators that can show a region, but not an accurate depiction of the actual event.

You'd dop well to learn about the lost art of volume analysis, it hasn't mattered to traders over the last 5 years and they have even outright ignored the screaming red flags of volume analysis as the F_E_D kept QE going, as well as have been fooled in to thinking many price patterns were something they were not because they failed to understand and use volume analysis. Volume analysis will grow more and more important and traders coming up the last 5 or 6 years know nothing about it.

The charts...
 SPY intraday 1 min from yesterday with several small positive divergences, but there's a bit of negative pressure intraday right now. I don't think this is the end of the bounce, but it may be reflecting the beginning of the end if this grows and migrates out to longer timeframes.

As you can see, the initial positive divegrence was never very big, not big enough to support much more than a bounce.gap fill which it is approaching now.

 The SPY 3 min shows the negative from last week and the gap down from yesterday morning because of that heavier distribution. You can see the overall positive / bounce divergence, but here too we are starting to see some damage being done which can increase at a very rapid pace, many times before I'm even done posting an update which is why I'm breaking them up.

 At a simple 5 min chart which should be able to have a decent positive divergence for even a simple bounce, has none whatsoever and the defining feature is a clear leading negative divegrence, mostly last week as we suspected the market was being pinned in place to keep it from declining pre-Black Friday and making bad consumer sentiment , which is now obvious in both weekend and Monday internet sales, even worse.

 As far as the whole, "I believe the move after the October rally will be far stronger to the downside", the 30 min chart above showing the July divergence/decline, the September divergence/decline and the current divegrence is very clear as to how much larger this is and that is what was expected before the October rally even started which was the first leg of our two moves expected (up strongly and down even stronger).

 The QQQ 1 min is nearly perfectly in line. WHERE IS THE POSITIVE DIVEGRENCE?

This is one of a couple of reasons (including Index futures and AAPL's recent charts) that I have believed the Q's would show poor relative performance today.

 QQQ 3 min, again the defining feature is distribution in to something that looks a lot like a head fake/bull trap parabolic move up and an even worse parabolic failure down. 

THIS IS EXACTLY WHY I DON'T TRUST PARABOLIC MOVES, THERE'S THE EVIDENCE ABOVE.

And the bigger QQQ picture speaks for itself.

 IWM 1 min intraday showing some weakness building in, it will have to continue before I'd start calling out short positions to enter.

The IWM easily shows one of the best positive divergences on this 2 min chart, yet it's still only a 2 min chart and a small accumulation area. If you don't have much gas in the tank, you can't go very far.

Again there are some initial signs of some strength being lost already as IWM makes a higher high from yesterday, but 3C does not.


 The IWM 5 min chart is the main chart I'll be watching for timing, as this positive fails, it will be time to start loading shorts, although I have nothing against building or phasing in to positions now.

 And the bigger picture 60 min divegrence is plain.

As for the NYSE TICK , you can see the early up channel busted, which is probably due to the intraday weakening of divegrences. A reasonable +1000 was reached, it's not anything impressive, just a normal move.

And our custom TICK/SPY indicator which shows intraday breadth trends with an early possible decline setting in.

So far everything is as it should be, no surprises at all.


Looks like USD/JPY Lever Will Give Out

In this case, the market's bounce is only as good as its levers that ramp it as USD/JPY did overnight...
 ES / SPX fitires in purple vs USD/JPY (candlesticks) overnight, you can see the early morning hours ramp and then on the cash open at the white arrow.

True this is only one of about 4 levers being used, but it's the one that did the heavy lifting as expected from yesterday and it looks as if it's near giving out.


Although the intraday 1 min Yen is positive and should move higher soon pressuring the USD/JPY lower, this is not the REAL problem, it's in the $USD.

The 1 min USD is negative, but again this is not the real problem, this is just intraday stuff, the real problem is below...

 $USDX 5 min LEADING negative right now with the timing 1 min chart negative and the stronger...

7 min $USDX leading negative  as well in a parabolic move. It looks like one of the market's support legs is about to give out, which I bring up to show you WHY I WOULD BE USING PRICE STRENGTH TODAY TO SHORT IN TO, I don't think it lasts very long and after yesterday morning's snap and last week's crack of the ledge, I think we are a lot closer to something a lot uglier than yesterday's first 30 minutes of trade.

AAPL Trade Set-up

This is essentially a re-iteration of yesterday's AAPL trade set up in the post, AAPL Update.

The Q's are underperforming and it was obvious they would as their divegrence (positive) is essentially not there. The only thing that has the Q's in the green is the fact they are drafting the broad market, but that can't and hasn't held recently as there has been massive differences in relative performance which would be a bright red flag if I were long the market.

The Q's only real hope to improve relative performance as the worst performing of the averages on the day(as expected) is for their most heavily weighted component, AAPL, to drive them higher as it has done in the past week or so.

Thus if AAPL makes the move above the triangle pointed out yesterday it will not only give us a much better entry by nearly 4%, which is also much lower risk by at least 4 % which for my risk management allows either a wider stop which I prefer on trend reversals or a larger position as risk per share drops significantly allowing me to carry more shares at the same risk level. This is why I want to see AAPL above the $119 area for a potential short trade or at least 2 of 3 good reasons.

Don't forget to set price alerts if you are interested.

At present I think there are better trades than AAPL =if I have to decide where to best put my resources o work, but on such a bounce as explained yesterday and above, AAPL becomes much more attractive, however I still see it as a swing trade for now and not a longer term core position as AAPL transforms from a growth monster to a blue chip, more stable income stock like MSFT. Look at MSFT over the last 20 years for the blueprint of AAPL.

 AAPL's gap down this morning saw a positive divegrence that has sent it back up above yesterday's close, just in the green, but this isn't the trade set-up we were looking for yesterday nor today...

 The 5 min chart's overwhelming feature is a large negative divegrence sending AAPL down from Friday's close to yesterday morning's a.m. lows where a huge number of stops were hit right below numerous whole number/psychological levels such as $115, $114, $113 as well as the 30/60 min 50-bar moving average that has defined the trend since October. Thus the break not only triggered stops, but put in a more important "Change of character" which we can take advantage of on some intraday strength as this larger negative divegrence dominates the chart.

On a 10 min chart you see a relative negative changing initial character at #1, a leading negative warning of a decline at #2 and a stronger leading negative at #3, even with a potential bounce, this leading negative is SCREAMING to short AAPL in to price strength as the change of character has occurred, the trend is essentially broken. Navigate the volatility around this initial break and look for some price strength, that's AAPL's X-mas gift.

Early Indications

So far we're pretty much right on track, we have a bounce, although I wouldn't call the day this early in the morning, but as expected:

VXX/VIX futures are declining (part of the ramping lever mechanism because the market doesn't have the strength to bounce without help)...
It looks like a gap fill is likely, we're almost there, but as this 5 min VXX (short term VIX futures ) shows, there's a large positive divegrence and base backing it up , that is still in effect and will soon lead to VIX / VXX heading higher...thus the reason I believe we are seeing only a 1-day oversold bounce today. I made reference to this yesterday and this morning as well, A.M. Update,  when looking at the Index futures timeframes, only the shortest are positive and after, the more powerful longer term starting at 5 and 7 mins are positive, again, only a short term oversold bounce...

HYG is somewhat helpful intraday as a market lever, but the bigger story here BY FAR...
Is how Institutional money and their risk asset (High Yield Credit) is diverging from the weighted averages of dumb money. Smart money is selling thei risk assets nd HYG is deeply leading the SPX negative, by far the largest divergence between the pair we've seen since using leading indicators. The area in white is today's help on the upside in HYG, it's insignificant beyond today's intraday trade.

TLT as expected has also gapped down, although it is showing a growing positive divegrence intraday.
TLT's gap down this morning and positive in white. However I'll be updating Treasuries on their own. THERE MAY BE A CONVERGENCE TRADE IN THE MAKING WHICH IS BONDS DOWN/YIELDS UP AND SPX DOWN AS THEY REVERT TO THE MEAN. For example...

SPX (green) vs 30 year YIELDS which move opposite 30-year bonds/treasuries. Thus TLT moves down and the red yields move up as the SPX moves down. This is the opposite of conventional wisdom in which you'd expect bonds to rally on the "Flight to Safety" trade, but if that bounce in yields (pullback in Treasuries/TLT) is not conventional wisdom and rather a "convergence pairs trade" (short SPX, short Treasuries), then we may be looking at a convergence trade. I'll have to update TLT and Treasury futures in another post to see if this looks like a probability.

The other lever expected , specifically in overnight trade to be ramped as mentioned in yesterday's update, USD/JPY, is right now at a new high on the week at $119.28, helping the market broadly as a lever.
 USD/JPY ramped overnight as posted yesterday,

"I suspect we get some kind of overnight ramp/support"

 ES in purple (SPX futures) weren't following until the cash open at 9:30 when they shot up to USD/JPY's lead from the overnight lift-a-thon in the JPY pair also as expected yesterday.

However as we have been pointing pout, the once mighty 1.0 correlation between USD/JPY and ES is dead, you can see that on a simple 5 min chart, even this morning's ramp on the open in ES isn't close to the correlation... More evidence this is a bounce only, best sold/shorted in to.


TLT, VXX and HYG have come together to do what we also expected, activate the SPY Arbitrage lever which is good for about $.30 cents of the SPY's +.74 gain today alone without USD/JPY.

You could have (and I hope some of you did) play at least a dozen trades, many using weekly options just on yesterday's bounce analysis alone and have a tidy profit to show for it already this morning.

From this morning's 8:02 A.M. Update I said,

 "I do expect Russell 2000/IWM outperformance on a relative basis and NASDAQ/QQQ underperformance on a relative basis."

Thus far, IWM has tripled the QQQ's performance with SPY in the middle...

Also both Silver/SLV and gold/GLD have gapped down as expected yesterday as well, I'll update these separately also.

TICK remains fairly neutral, it hasn't done much above +750 which is pretty mmild with the IWM up over 1%, but I'll be addressing that as well.

I'll likely have some shorter market updates today as I expect things to move faster in underlying trade and by the time I post all of the charts for a regular update, things have already moved. I'll also be updating opportunities I think are interesting as I said yesterday, a bounce is a "Gift Horse",

So far, so good. I hope you made some money on some of the ideas/analysis from yesterday, last night and this morning-all saying the same thing. If you didn't, no big deal, this is a better opportunity (sell in to strength or short).