Monday, December 29, 2014

Market Update

I think I see why there was some discrepancy between the XLF/FAS/FAZ 1 min charts, there's some short term intraday signals that look like they want to (for the most part) try to ramp in to the close, however they remain short term signals, mostly the intraday steering timeframe of 1 min. When we look at the next timeframe, which if a divegrence is strong enough, it will move to, the 2 min, we don't see any strengthening in almost all cases, thus this looks to be contained to an intraday attempt at perhaps a closing ramp or perhaps a divergence that is reflecting the dislocation between USD/JPY and the Index futures intraday, expecting the algos to send the Index futures up to the USD/JPY short term intraday correlation,  this would have no real influence on me as far as entering positions other than perhaps option positions in which I want the very best timing possible.

As far as the levers, there's no SPY Arbitrage active. HYG is not active, TLT is not active as far as helping the market ramp, in this case it's the opposite, it's pressuring the market downward, VXX has a slight intraday negative divegrence that stops at a 1 min chart.

The possible mixed signals intraday may reflect the fact that the USD/JPY may not have that slight leading edge for long as the 1 min $USDX is leading negative which would pull the USD/JPY lower and cancel any difference between the Index futures' and carry trade's correlation.

Again, this is likely myopic and making a mountain of a mole hill, but this is my job to look for anything that influences trade near or longer term.

As to the USD/JPY / ES correlation...
The USD/JPY in green/red candlesticks vs ES in purple during the cash market (green box) with ES flat or down intraday and USD/JPY up a bit, but again, the $USDX has a sharp 1 min negative that will likely pull the FX pair lower shortly, which is why there may be some discrepancies in short term charts.

 1 min QQQ has an intraday positive that looks like a ramp attempt in to the close, but the divegrence has no further strength behind it as it hasn't even migrated to a 2 min chart which is a much more important signal for me presently as far as near term positions I want to enter.

 QQQ 2 min timing, but stronger in a clear leading negative divegrence at the place and time I was expecting to see it, the Santa Rally start, after traders initially went long for the Santa seasonal rally.


 The IWM is one of those discrepancies with a leading negative intraday 1 min chart, just as XLF/FAS/FAZ has some discrepancies leaning toward the negative (XLF and FAZ confirming downside while only FAS was looking for a closing ramp higher).

 IWM 2 min is much more important as a near term timing signal, leading negative in to the start of the Santa rally.

DIA 1 min shows some intraday 1 min positive activity, but no further than this. The more important signal is at the 2 min chart. again...

Sharply leading negative.

The SPY shows earlier weakness intraday with a positive toward the EOD.

 2 min doesn't tell us much as it is nearly perfectly in line.

The TICK Index has been in a tight range all day, no trends at all other than sideways and between +/- 750.

As for intraday futures, TF and NQ are inline and ES 1 min has a negative divegrence.

Once more, this is probably not even worth the post, but since I saw this on the Financials 1 min, I thought I'd mention it as it's obviously coming from the broader market.

FINANCIALS SHORT / FAZ LONG

I don't have a lot of room as far as risk management rules go to add to FAZ long (3x short XLF/Financials), but whatever I can add, I'll be doing so now.

As always I like to use multiple timeframe analysis and multiple asset confirmation for the best signals. I'll be using several long Financials and short Financials, if there's confirmation the short Financials should give a near mirror opposite signal as confirmation. Remember, while these assets are leveraged so they try to mimic the underlying by whatever their leverage may be (FAZ is 3x short Financials, FAS is 3x long financials), 3C is not following the price alone and therefore will not give the same signals just because their prices move together or directly opposite, volume is something the ETFs cannot recreate and don't try to, it's often in volume that 3C using Time Segmented Volume as input data, will create divergences, so this is something that is different for each ETF, even if they are connected by the underlying. In other words, if there's 3C confirmation, it has nothing to do with the fact that each ETF that is tracking an underlying as actual demand via volume is totally different for each one.

XLF/Financials is the main ETF, FAS is the 3x leveraged long of XLF and should move approximately 3x whatever XLF moves. FAZ is the 3x short financials and should move approximately 3x inverse of XLF on a daily basis. Thus XLF and FAS should have similar signals for confirmation and FAZ should have nearly mirror opposite signals for confirmation between multiple assets as well as multiple timeframes.

Although the leveraged ETFs often give cleaner, earlier signals than the underlying (I suppose because of the leverage, meaning smart money knowing about a move coming will move in or out of the leveraged ETFs first as to prevent losses or enhance gains),I'll be using all and try to keep timeframes close so you can see the confirmation. *Remember XLF and FAS should be similar while FAZ should be the near mirror opposite for confirmation.

 XLF/Financials 2 hour, one of the strongest charts and highest probability outcomes, showing the heaviest underlying flow of funds.

From the October lows in which we forecast a monstrously strong rally over a week in advance of the bottom shows XLF accumulation at the mid-October lows, a strong accumulation signal, but since we have seen a 3C downtrend in to higher prices rather than confirmation with the most recent highs showing an even lower 3C reading, indicating selling in to this entire move and the highest probability resolution being down.

 The same 2 hour chart in FAS, 3x long XLF shows the same mid-October lows accumulation and the same leading negative divegrence in to higher prices with an even lower 3C low now as price is above the former highs (yellow trendline).

And FAZ 2 hour (3x inverse XLF, the opposite of FAS above) showing distribution at its October highs (opposite XLF/FAS Oct. lows) with building accumulation in to lower prices and a stronger positive at the most recent low, perfect long term confirmation.

 60 min XLF from the October lows with continuing distribution in to higher prices, leading negative, a very strong longer term signal.

 FAS 60 min with a near identical signal, leading negative from the October lows.

FAZ building a leading positive to the right from the October lows to the far left.

The longterm charts of highest probabilities confirm and suggest the strongest probability move is to the downside.

As for mid term charts, which show us whether we are close to the anticipated move...
 XLF 15 min which is often strong enough to forecast swing moves, shows the accumulation just after our Friday 12/12 forecast with accumulation and distribution in to the move higher. This would normally suggest at least a swing move down is coming, but with the longer charts negative as well, it is pointing toward a much bigger move down.

FAS 15 also with accumulation right after our forecast of a move higher and distribution in to that move.

FAZ 15 min with distribution as we forecast a move higher on 12/12 as this is an inverse ETF, but note the accumulation in to lower prices, again confirming XLF and FAS above.

As for the shorter term timing charts, I'm specifically looking for movement around the last day of Window Dressing for Q4 and FY2014 which would be last Friday considering the T+3 settlement rule as well as that being the first day of the Santa Rally which runs from the week after Christmas to New Years, again starting Friday. These shorter term signals are not as strong as the ones above, but they are essential to timing.

 XLF 3 min with a relative negative divegrence (weaker form) in to Christmas Eve and a stronger leading negative divegrence today as Window Dressing winds down and the Santa Rally starts, again indicating that there's distribution in to today's higher prices which is where I usually want to enter or add to a position at the best price, lowest risk and best timing.

 FAS 3x long is also giving near identical signals and ...

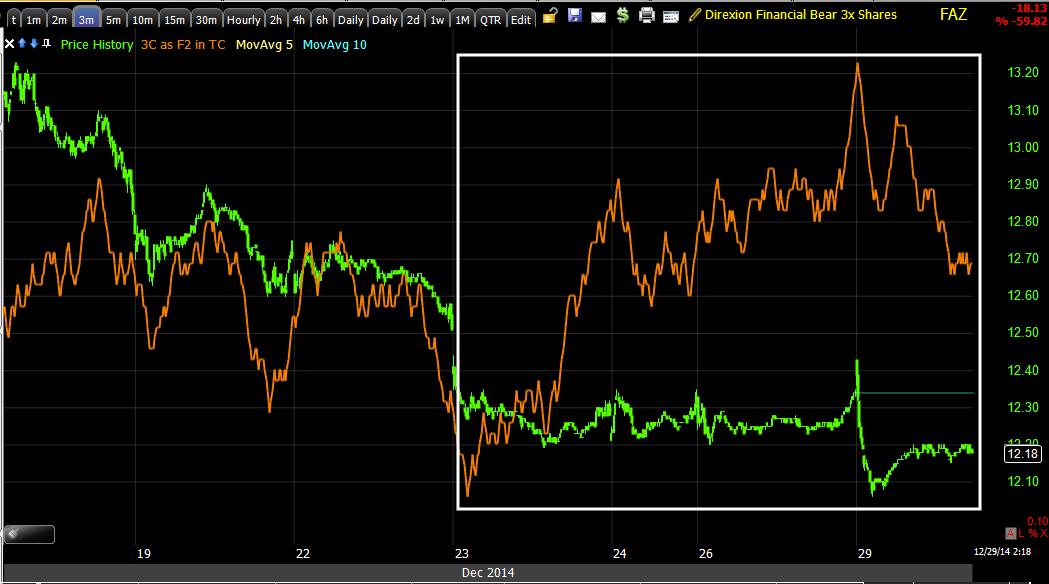
FAZ 3 min is giving the opposite with a leading positive divegrence , especially in to X-mas eve and the last 2-trading days.

Intraday, 1 min is the only chart that bothers me a little. This is the weakest signal of underlying trade, but often one of the best timing signals. There's some divergence between the 3 ETFs here.

 XLF 1 min is showing a relative negative up until today and a stronger leading negative in to today's move with a tight range where we often see a lot of underlying activity, which is why I always warn not to become complacent in a dull or range bound market.

 FAS is mostly giving the same signal, but intraday it has a slight positive divegrence as if it wants to make a move higher perhaps in to the close.

While FAZ 1 min agrees with XLF as it makes a relative positive in to today and a stronger leading positive through today.

I don't feel that this small lack of confirmation is that important when considering the bigger picture and will go ahead and try to fill out the FAZ long position with whatever room I have left to add to it to bring it to full position size within the constraints of my risk management position sizing.


Market Update- Important

As has been the case in the recent past, there are a number of very important charts that have given evidence of our forecasts , then additional evidence that our forecast is still on track and moving to the next stage, but the final stage of the forecast of a Crazy Ivan shakeout and the move above the IWM's 6 week range and the perfect storm of the Santa Claus Rally failing and likely the January effect rally failing are all the end point of the forecast, everything before that like the Crazy Ivan shakeout below and above the IWM's 6 week range are a means to an end, not the end or the major part of the forecast in themselves. So far we have had confirmation on everything from the forecast, to the evidence that the forecast is correct to the actual price moves to the next set of signals showing those price moves are indeed head fakes and all of this builds up the credibility of the end point which everything that has happened since the forecast was made on Friday, December 12th have just been a means to that end.

In any case, as usual, things are moving so quickly in the charts that I must break them up in to separate posts because of the speed of movement, they'd be out-dated by the time I captured all of them and posted them, but they are important in giving you the confidence to see that our forecast is the highest probability outcome, which means entering positions in the area or adding to them is the best entry, best timing and lowest risk, so I'll try to provide you with all of the evidence as well as put out posts like this that show why we might look at using current levels for our position entries or add-to positions (mostly shorts).
While the original forecast was made with a little evidence, it was mostly based on our concepts and mass psychology, the fact that we see 80% of all reversals in all assets and any time frame they occur, see a head fake move first. The 6 week range in the IWM was too juicy to turn down without a head fake move first, it was probably one of the strongest candidates for a head fake move above the range before a downside reversal we have seen in a long time.

While the original forecast from December 12th was fleshed out with additional details as charts provided new clues and evidence, one of the theories as to timing was the Santa Claus rally because traders are expect it as almost a God-given birthright, thus an initial move toward the Santa Claus rally bringing in more longs, just as the head fake move was designed to do, and then shutting the door and trapping bulls with a failed Santa Rally is essentially the perfect storm or perfect reversal event with the strongest downside momentum as failed moves lead to fast reversals, but in this case, you have a disproportionate number of longs looking for the Santa rally and January effect as well as chasing the IWM head fake/upside breakout above the range, breaking 6 week resistance which traders will chase and buy, creating a strong bull trap.

Friday I went over the Santa Claus rally and the Quarter/Year's End Window Dressing in more detail, here's the posts from Friday: A.M. UPDATE and The Thin Facade of Price is Giving Way to Reality

As for the market update, TICK data shows breadth is extremely weak, this has nothing to do with the light volume and traders on vacation which are starting to file back in to work today, that's volume, but advancers/decliners have nothing to do with that.

 The NYSE TICK data on my custom SPY/TICK Indicator shows a sort of short term capitulation/selling climax at #1, remember our forecast for a move higher, above the IWM's 6 week range was on Friday the 12th, although we had suspected something was building the entire week of the 12th. At #2, breadth increases and looks healthier as we first get the head fake move below the range creating a bear trap, giving fuel to a short squeeze in small caps which was the most powerful short squeeze in the Most Shorted Index in 3 years (the week before the market saw the worst weekly performance in 3 years and after the bear trap for the short squeeze, the market saw the best 5-day run in 3 years- all signs of increasing volatility or a change of character which leads to changes in trends).

At #3, as the rally has moved above our minimum IWM target at resistance around $118, note the intraday breadth falling apart with fewer than 50% of all NYSE stocks above their 200-day moving average, the market is already severely damaged and this is showing us the end of the forecasted move higher from December 12th.

 Intraday today, the same indicator shows additional weakness developing in intraday breadth to a new lower low for the chart above.

 And as of last Friday, the first day of the traditional Santa Claus Rally and the last day of Window Dressing (The Art of Looking Smart), the range was very narrow Friday at +750 to -500. By the close we had a deep sell-off to -1100, the first time in the day the -500 range was exceeded, remember this is when the pros come out and trade, at the close.

Today's range is even tighter at about +500 to -750, this is what we'd expect to see in a dead flat market ending the day with something like a Doji.

3C charts of the averages...
The SPY 15 min chows Friday December 12th when our forward looking forecast was made, then we got confirmation with a 3C positive divergence on the break below range support of the IWM on the 16th/17th (accumulation) leading to the Wednesday F_O_M_C knee jerk reaction higher, which I always warn , "More often than not, the knee jerk move is the wrong move and fails like the last 2 times, especially when 30 year yields start moving opposite the market just like the last two F_O_M_C meetings and this one, in which the knee jerk move was retraced and all gains given back. In the September meeting's case, the F_O_M_C knee jerk reaction failed within 3 days and led to the October lows when and where many sentiment indicators hit their most bearish readings on record and when we forecast a strong move higher, a face ripping move.

The point is, the early accumulation on the first head fake below the range (16/17th) has turned to strong distribution in to the move above the IWM's range where longs will buy providing demand for institutional money to sell/short sell in to the demand at better prices and allowing them to move large positions on the demand from retail who is as always, chasing price.

 The short term timing 1 min intraday SPY chart shows today's intraday 3C chart has been showing distribution in to its initial move higher, which is EXACTLY what I would have wanted to see and expected considering the Santa Claus rally (failure) forecast. This also means we are likely very close to a downside reversal in the broad market.

 The larger and stronger underlying flow of funds in the 60 min QQQ shows the October rally accumulation at the lows and base that we forecast as everyone was as bearish as you could get, we were predicting a rally so strong it would be unimaginable and challenged members to bookmark the forecast to come back to. The distribution process in to a stage 3 top for this cycle is clear, as is the rounding top and chimney, our "Igloo with chimney" concept. Remember we had forecasted this move nearly a week before the lows were hit in the SPX. The current leading negative divergence just shows what the price strength was used for, selling in to or shorting in to by institutional money.


 The near term 1 min QQQ chart (timing) shows distribution Friday in to the first day of the Santa rally and it continues today, as such, as a timing chart, this is looking more and more like the area in which we want to call out short position trade ideas.

 The IWM 15 min chart is a perfect representation of our December 12th forecast with the evidence of accumulation verifying the first part, a move above the IWM's range and the second part , that such a move would be a false breakout and see distribution and ultimately fail and lead to a new low below the October lows, so far this is right on  track.

 And the short term timing 1 min chart has been negative since the Santa Rally started Friday with an even worse leading negative divergence today, thus this is an area I'd be very seriously considering entering short positions and you know I've been very patient in not calling out any trade ideas (short) too early on this move, but I think we are that close now.

 This IWM 5 min chart shows the complete cycle of evidence that backs up the entire December 12th as well as that weekend and Monday's continuing fine-tuned forecast. The accumulation on the 15. 16th and 17th that led to the F_O_M_C knee-jerk move higher, which I believe was only to serve as cover for a move that was already in the works days before the meeting ever started.

Accumulation below the range and distribution above it, A PERFECT CRAZY IVAN HEAD FAKE CONFIRMATION.

 The DIA, because of its bluechip safe haven status unlike the other averages (see the 2007/2008 decline- because long only funds must stay long the market, they filed in to the blue chips as the best choice of a bunch of bad choices. The Dow was the last to give out to the downside and had the most shallow decline), has shown the best underlying 3C relative performance vs the other averages, but the 15 min chart also shows the same thing as the IWM above, after our forecast on Friday, December 12th the evidence of accumulation for a breakout move higher to sell/short in to was in place the next trading day after our forecast and the expected move higher shows the distribution we expected for a head fake/failed rally/breakout.

The 2 min trend of 3C shows how the DIA has the best underlying performance as it was in line with the price move higher for most of the move (green arrow) and then recently as the Santa rally approached, clear distribution in to the area, showing that even though it had the best relative performance, it too would not escape our forecast.

I'll be adding more evidence and hopefully some trade ideas as well. I'm still holding FAZ (3x short Financials) long as well as SQQQ and SRTY long (3x short QQQ leveraged inverse ETF and 3x short the Russell 2000/IWM ).

More to come...

A.M. Update

I hope everyone had a great Christmas holiday and are bright-eyed and bushy-tailed for the New Year, it promises to be an interesting one, I suspect some things that no one alive has seen.

Forgive the later than usual A.M. Update, but there were a few things I wanted to look in to a bit more closely and see the cash open.

Since mid-December my theory has been a Crazy Ivan shakeout using the IWM as a blueprint because of its 6 week range and the ability of small caps to ignite a short squeeze as well as the most important part, the 6 week range that didn't move more than -0.10% over the entire period, a very obvious range in a well known asset makes head fake moves which occur anyway about 80% of the time before a reversal, no matter the asset, no matter the time period, more likely as the more obvious support/resistance are, the more orders that will be lined up at them, making them easy pickings and strategically very valuable for smart money's large position sizes that are like a trans-Atlantic Oil freighter that needs a mile to come to a full stop vs. our smaller orders that can be executed in a single trade, making us more like jet-skis as far as maneuverability vs institutional money, not to get off track, but head fake moves have a lot to do with this fact.

The Crazy Ivan has so far played out both below and above the range with confirming signals at each that they were and are head fake moves. Last week I picked up on the later stages of my theory which included the Santa Claus Rally that every trader just seems to expect as a God-given right, few would ever consider it "might not happen", but my theory was that it would start sucking in more longs in to the head-fake's bear trap and then shutting the door by letting the Santa Rally fail, creating the same downside momentum as the 15th and 16th did when they set a bear trap moving below the IWM 6 week range. Not only does the Santa Claus rally (the last week between Christmas and the New Year) play prominently in to the equation, but the January effect which would be effected negatively by a failed Santa Rally and finally quarter's and year's end Window Dressing, the Art of Looking Smart, but as I noted Friday, it was the last day to get trades in with the T+3 settlement rule, (Trade plus 3 days to settle), so with that deadline passing as of Friday's close, the only real Window Dressing left is just performance for end of year for the averages, yet again if you are already set up to take advantage of a move down, there's no better place than after you've started to suck in more longs just as the upside head fake move is designed to do above the 6 week range and then let it fail, the supply/demand dynamic does the rest in creating momentum on the reversal.


As for the 3C charts, intraday for the Index futures this morning just before the open...
 ES since the futures week opened last night, which looked dull to me, has been in line with a decline since approximately just after the European open this morning, probably somewhat related to Greek Exit news as the third presidential and final presidential election failed to procure enough votes bringing the country to snap elections in which the radical left, anti-bailout Syriza party is likely to take home more than enough votes to cause a Greek exit from the Eurozone causing all kinds of pandemonium and chaos, especially for the banks and the guarantors of the numerous bailouts Greece has received already, but I don't think it's quite the issue YET, that it's being made out to be which is partly why I wanted to see the open.

ES has mostly been in line on the overnight session from lateral to decline. The opening pop higher in parabolic style has no Index future 3C support, , however opening lows did take out all of Friday's lows which is what I suspected gave ES/SPX the energy for the opening parabolic move higher, there's no support for this move in futures. The NYSE TICK barely broke 500.
This morning's cash open parabolic pop, you know I never trust parabolic moves, but the open below many of the averages' lows such as DIA which took out all of Friday's , Wednesday's and most of Tuesday's lows, provided a BTD opportunity, maybe some short squeeze, but no real buying as TICK breadth is as anemic as you can get, +500? That's like a dead flat range's reading.


 NQ had an interesting 1 min overnight chart, negative in to the European open and a decline as short term 3C forecast in to or just after the European open, but with a small relative positive divergence in to the US Cash open. Again, very small, I didn't want to make any forecasts on such a small divergence when it could turn in to many things, but I suspect a quick BTD trap.

As I have made very clear, I think the initial move on Friday for the first day of the Santa Rally (which is what we forecast, an initial strong looking move in to the expected rally), will end with the rally failing and the long time anticipated and expected rally , as sure as the sun will come up tomorrow, catches too many on the wrong side of the trade, this is the easiest way to fool the greatest number of traders at any one time which is what the market is all about.


TF 1 min futures also had a positive divergence so whoever was behind the cash open- parabolic move, this was laid out many hours ago. Although once again, there's not enough support here for anything more than a pop and a FAIL.

As for the 5 min charts which have been all over the place...


ES is about in line. I am starting to think this cycle since we first put it forward December 12th and saw the first initial reactions on December 15th and 16th, is actually much bigger than a 5 min chart and it "may" be helpful with timing, but it has little to do anymore with confirmation, much stronger, longer charts have now taken that over, which is also in line with our theory as we are not expecting a market correction or pullback, but something much larger.

 TF 5 min has remained clearly negative.

As NQ has bounced between in line short term and negative (leading here) which is another reason I suspect this morning's move was one of the early games most pro traders try to avoid by not trading until 10:30-11 a.m.

As for the 7 min charts, I think they are still important...
 NQ 7 min remains in a clear , large negative divergence.

As does TF.

As for ES, this is where I think the longer term charts are not only more important, but showing the picture of what is going on more clearly.
 The ES 15m leading negative divergence, but in the area of the head fake move above the IWM''s range, it becomes more clear on the stronger, more important longer term charts.

 Here's our entire forecast, from December 12th (Friday) in which the head fake move above the IWM's 6 week range was first put out as theory with evidence coming that day and the next Monday/Tuesday on the 15th and 16th.

Although the accumulation period for the move up is not as apparent as the left side of the chart is somewhat cut off, the distribution period above the range is VERY obvious.

And the stronger underlying flow of the 60 min chart shows roughly where the range would be on the SPX/ES futures (yellow and the move below the range (first half of the Crazy Ivan shakeout) with accumulation (white) of the new shorts entering causing the biggest "Most Shorted Index" squeeze in 3 years) as we move above the range, the second half of the Crazy Ivan is confirmed with clear distribution/negative 3C divergence (red) showing the second head fake and the momentum builder for the downside reversal. Everything is in place including the Santa rally with Window Dressing effectively over because of the T+3 Rule.

Additionally, although USD/JPY which has been a magnet for ES/SPX futures may not look like it's doing anything interesting...
 Just look at the carry pair, USD/JPY in terms of our cycle, December 12th the theory is put forward based on some signals and Mass Psychology, the 15th and 16th we have further evidence making the theory an almost certainty and with the move above the IWM's range, since we have been flat as I pointed out Friday, the USD/JPY as well.

I have suspected since years ago that they Yen would strengthen and the USD/JPY would crumble as a real downside move of consequence begins.

Interestingly...

 The $USDX 15 min futures are leading negative in this flat range for USD/JPY which is where we see the heaviest 3C activity. in flat ranges where none expect it. This would pressure the USD down and the carry pair.

The stronger $USDX 30 min chart shows the EXACT same divergences as the major averages, accumulation on the initial break below the range on 12/15 and 12/16 and distribution ABOVE the range since, just as this $USDX 30 min chart shows, but that's only one half of the FX pair.

The Yen futures confirm...
 The 15 min /6j (Yen futures) positive although this is not the really impressive part.

The 60 min positive after a pullback from the first initial move up. This would mean a stronger Yen/weaker $USD relatively and a falling USD/JPY which is one of the 4 levers the market has used to push this head fake above the range through as we anticipated and posted before the move even started.

I think what will be important are individual assets confirming, Industry groups and the 3C charts of the averages as the futures are clearly showing what we expected to see when this theory was first put forth over 2 weeks ago.

So far everything forecast from December 12th has come to pass with confirmation of what we expected to see come next. I'd be taking this opportunity very seriously.