Tuesday, January 13, 2015

Does the Crude Bounce Hold?

My guess is yes, the "bounce" holds, but not much more than that.

It's funny how you get in to things and they turn and backfire on you. I may be wrong, but I believe I recall the US reaching out to Saudi Arabia to boost production and try to starve the Russians out (as Russia is an oil exporter) in tandem with other measures, meant to cripple the Russian economy over the Ukraine situation.

However it seems our allies, the Saudis have also found they can crush the US shale oil industry in to virtual oblivion and wipe out any US / domestic competition. I doubt this is the way the story ends, there's too much money from the oil industry on Capitol Hill, but whatever may be launched as a counter-offensive will surely have unintended consequences as well.

The immediate question is what does this current oil bounce have for legs? I'd say there are some, but likely pretty short legs.

Here's what I see.

 There looks to be evidence that a base area was formed again at the start of the year, it looks like yesterday was a stop run and a head fake below that range as volume pumped up on the break, as did short term 3C signals, suggesting a small head fake move and an oil bounce.

If today's closing candle can engulf (close above yesterday's open), then this move has an even better chance, especially if volume picks up.

 This is the January range mentioned above, which looks like it had a decent positive divegrence; the break below and what looks like confirmation of a stop-run/head fake move with a positive divegrence on the break below support (stop run).

 USO 3 min shows the same thing, just with less detail.

As does the 5 min chart, which also shows the volume spike under the small range (stops hit).

 The fact there's a divergence out on the 10 min chart makes me think this bounce has a chance.

However as I have maintained from the start, this is no change in trend. This2 hour chart should make that very clear.

As for Crude (Brent) futures, there's similar recent confirmation as well.

5 min leading positive looks like confirmation of a head fake move/stop run that was accumulated.

7 min

And a very strong leading 15 min chart.

That's about as far as we go right now, but a 15 min chart can make for an impressive move.


Morning Update

Good Morning,

In yesterday's Daily Wrap some several end of day charts including some industry groups, averages and individual stocks made some movement in an otherwise very dull day leading to the comment below,

"Toward the end of the day there were some pretty solid positive divergences in the 1 min range mostly, yet not much behind them so I suspected that we'd likely see a move higher tomorrow morning , maybe longer. Here's a few examples of what appeared to me to be a weak move getting ready to start....

However, no movement or migration to the 2 min chart which would normally tell me to look for some early gains and then a failure of those early gains."

Thus far, this is what we have. I don't see anything standing out in futures that would imply this morning's path is about to see an imminent change in character unlike yesterday's open. In my view the movement is good, I don't think we are going to see much unless there's movement and as I mentioned last night, if there's any attempt to get out of the bounce base accumulation that was put together last week, it will be in to higher prices not lower.

So I'll keep an eye on how things develop, whether there's near term confirmation and more upside or whether there's distribution in to higher prices as I believe we will see no matter what, it's more a question of whether the oversold bounce will be aloud to spend all of the gas in the tank for the move or whether they are trying to slip out the back door on this one, both scenarios are useful. The first for tactical positioning and the second would have that and more informational value as small cycles like this are rarely abandoned, if it were, it would be because of something pretty scary for the market.

I doubt very much this is January Effect money coming in to the market.

Monday, January 12, 2015

Daily Wrap

Today was a dichotomy, in some ways very interesting, in other ways very dull and in many cases, one event was both at once.

I think two of the most exciting things about today were conceptual, if you look at Friday's Daily Wrap, we had very clear 3C deterioration in to the close on 1 and 2 minute charts all around, the concept of 3C picking up where it left off almost seemed like it might fail this morning after I looked at futures and they were up on ECB QE chatter, then comes the cash open (which is when the concept works by the way), and exactly as 3C had ended Friday, in a nasty decline, the market made the same nasty decline with USD/JPY being the mechanism to bring prices lower, yet the concept of 3C picking up where it left off, even over a weekend or long weekend and even when futures are ramped higher just an hour before the open from ECB/QE chatter earlier in the morning, THE CONCEPT HELD AMAZINGLY.

5 min chart of USD/JPY (candlesticks) vs ES (purple), note how they linked up just before the US open and tok the market down in parabolic fashion, in line with 3C's closing 3C stance late Friday.

Also the parabolic move and how I never trust them, whether up or down, they always seem to give back a fair portion if not all.

The opening decline was the worst opening first minutes for the SPX in more than 2 years. All of the F_E_D's Charles Evans' "Catastrophe" gains from last week were wiped out this morning and then some. 

Toward the end of the day there were some pretty solid positive divergences in the 1 min range mostly, yet not much behind them so I suspected that we'd likely see a move higher tomorrow morning , maybe longer. Here's a few examples of what appeared to me to be a weak move getting ready to start (one of the reasons I threw out the transports and Financials trade ideas) ...


 SPY 1 min positive today...

However, no movement or migration to the 2 min chart which would normally tell me to look for some early gains and then a failure of those early gains.

There has been virtually no movement whatsoever on the 5 min chart, it's almost as if today didn't happen with respect to that chart, one of the strange, "Dull" items contrasted against the open.

The QQQ 1 min with a positive, but remember what it looks like in context, not so positive.

 Yet again, at 2 mins there's a negative divegrence, which again would suggest some early price strength that fades.

 And the QQQ 5 min chart, again, almost as if today didn't happen.

The IWM 1 min chart (not pictured) is negative, the 2 min chart above is negative, the 3 min chart below is negative.

IWM 3 min.

And while the 5 min chart is not negative, it's not in good shape and again, almost as if today didn't happen. 

These 5 min charts "can" move in an hour or so, after a full day, I really thought we'd see some movement whether more positive or negative so that was strange, a dichotomy as it was dull, yet the opening trade was far from it.

So toward the close I was thinking we may see some upside early tomorrow or through part of tomorrow followed by weakness, VXX and TLT also had similar confirmation, however I may have to revisit that thought on how futures look tonight.

Just before the close, 2015 F_O_M_C voting member and noted dove, John Williams of the San Francisco F_E_D said that a "June" rate hike is "reasonable" on job gains and that the labor market continued displaying "strong momentum". It's not so much the June rate hike, it's the dove that delivered the message, which if you recall last week after Evans made his dovish comments that a rate hike too early could be "Catastrophic", the same day the unofficial mouthpiece of the F_E_D, the Wall Street Journal's Jon Hilsenrath, came out with a piece that seemed to totally ignore the Evans comments and make the case for rate hikes as if it was damage control to the Evans' comments.

In any case, one of a few reasons I'll want to revisist futures and anything else I can find is the reaction to the late day comments from Williams...

In afternoon trade (all of the major averages), you may recall the signals in which I thought the SPY and QQQ would try to ramp in to the close as posted this afternoon in Splitting the Difference- SPX vs RUT

Whether that last run was going to be the ramp in to the close or not, it is when Williams' hawkish comments , delivered by a dove, came out and the market reaction "seems" to have not been favorable.

I'll admit, this is not much in the way of evidence to go on, the chart above and these 1 min Index futures just after...
 ES 1 min futures with deterioration after the close. It's not popping off the chart, but this is why I want to revisit it later as the Williams comments are rather new for the market.

And NASDAQ 100 futures with similar behavior.

There are other leading indicators suggesting a near term bounce (tomorrow) like our Leading Indicators, both Pro Sentiment, HYG is also leading the SPX although there is that distribution/3C negative divergences in HYG as shown later this afternoon. High Yield Credit assets are either in line or in one case leading by a small amount (basically the later half of the afternoon).

Arguing against a bounce or at least calling a bounce "weak" are yields. I showed them to you about an hour before the bind market closed and they are leading the SPX lower, especially the 30 year yield.

Speaking of which, I don't want to be too myopic about the market and not pay attention to the larger signals that are really more important.
This is the SPX (green) and the 30 year yield (white) since QE3 ended on 10/31, the 30 year has lost about 60 bps  since, leaving the SPX pretty dislocated to the upside, or as I might say, "Owing some downside."

Either way, it seems like we are back to where we started in an almost no lose scenario, if the market gives us a weak bounce to short in to or add short positions, great. If the market continues lower, our shorts keep working and that's great too, although I'd like to have as much advance notice as possible and I know you would too.

The Dominant P/V Relationship is all over the place tonight, the Dow and NDX are the same as Friday, Close Down/Volume Down with 14 and 48 stocks respectively. The Russell 2000 has no Dominant relationship at all and the SPX is 203 stocks at Close Down/Volume Up which is often a 1-day oversold condition with the next day bouncing.

Eight of nine S&P sectors closed red. Healthcare led at +0.04% and Energy lagged at -2.88%.

Of the 238 Morningstar groups, only 57 closed green.

Overall this isn't a VERY strong oversold condition , but it is an oversold condition. Considering Leading indicators (mostly Pro sentiment and HY Credit) and the 1 min 3C charts in the averages, I'll assume for now that the most probable course is some price strength tomorrow, but as it sits now it doesn't look like it will have much support and that may be what they're waiting for on the 5 min charts, some upside to unwind positions that were accumulated last week in to higher prices.

I will check on futures later tonight and post anything out of the ordinary. I just don't know whether the Williams comment will have an immediate impact, especially if smart money is trying to get out of the bounce they set up last week, they'll need higher prices to do it.

So we'll go from there, as you saw today and last week, there are plenty of positions that are very weak right under the surface like transports, so some upside would be great to short in to and I know many of you have been looking for that since the decline from late December highs. Again, patience pays.


Financials Reiteration

I already posted Financials as a trade that should come to you, it looks like it is set up which may tell us a little more about the broad market, especially because Transports looked similar.

 XLF 1 min intraday, this afternoon it has put in a positive divegrence.

This is the 3 min chart, it's not very strong, but in this case, that may be a good thing.

And the 5 min chart with a positive at today's parabolic opening lows and toward the end of the day, otherwise the 5 min is still sloppy, again that may be a good thing reflecting weakness that we'd want to short in to.

At the 10 min chart, just like almost any other asset or any of the averages, things fall apart, thus XLF short on a bounce looks pretty interesting still in the area.

The FAZ-3x short Financials chart on the other hand looks great, the more common double base we have seen over the last 7 years or so with the second bottom lower than the first, positive divergences at both and a leading positive currently.

All of the charts above this one are essentially tactical entries, this is the strategic view.

Again, I'd set some price alerts.

While nothing has been definitively settled on these 5 min charts today, right now it looks like we'll see some upside on some very weak underlying charts which makes for a very interesting and in my view, favorable short entry (long FAZ or short XLF).

Transports (IYT) Trade Set-Up

Transports were the worst performing average last week (Dow 20). It looks like you might get a chance to get involved in a IYT (transports) short with the trade coming to you.

This is still a bit screwy on the 5 min chart which just goes to show it's pretty much market wide, but as a core or longer term short position, I have and I still do like transports a lot.

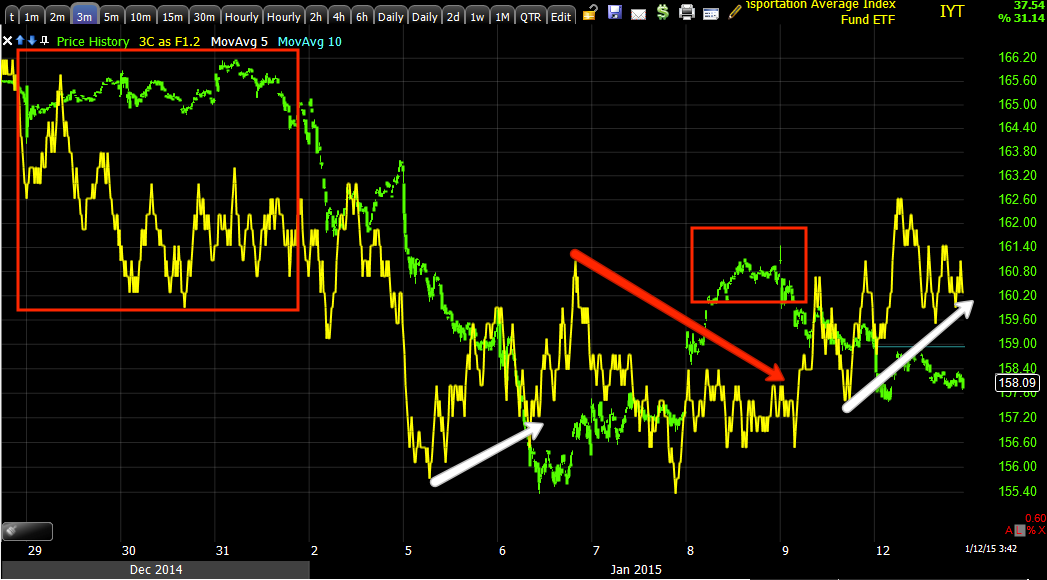
 IYT 2 min chart on more of a trend basis, but take a closer look and there's a weak positive divergence, the kind I'd usually look to short in to.

The same 2 min chart and the positive divergence today (note the head fake move at the yellow arrow, again just before a transition to the downside.

 There's also a positive on the 3 min chart, you can see how far the last one took transports-not too far.

The 5min chart, like the rest of the averages, just in limbo, but beyond that...

The 10 min is leading negative so whenever this 5 min chart cycle is resolved, this should be the direction in which transports starts moving again.

As for the highest probabilities and strongest charts, this is why transports are on of my favorites...

60 min IYT from the October cycle lows, note where the indicator is now and there are much worse charts than this.

This is a trade that can come to you on your terms at a better price, lower risk. If you're interested in an IYT short, I'd maybe set a few price alerts for a move higher in IYT.

Splitting the Difference- SPX vs RUT

Te one thing I do see, which doesn't really help answer the bigger question, is an intraday divergence between the IWM charts and the QQQ/SPY which are down more than double the IWM.

It looks like the SPY/QQQ will try to bounce a bit in to the close while the IWM looks like it will catch down to the SPY/QQQ's relative weakness on the day. Again, this is intraday and again, even this is not that clean and simple...

 IWM 1 min intraday has been in line almost all day, but is turning more and more negative as we move toward the close. This is the essence of Friday's Price/Volume Relationship, "Carry on...Keep doing what you were doing".

 The QQQ 1 min looks pretty positive and you might wonder why I didn't drag this chart out before, but stick it in to context and you get...

QQQ 1 min with the oversold bounce positive divegrence at "A", the trouble in the charts on the 8th and the current 3C and price location at "B", now compare both where price and 3C are at "B" vs "A".

Price is lower at "A" and 3C is higher, a clear positive divergence, but relatively speaking at "B" price is higher than "A" , but 3C is lower than "A", thus is not as exciting as it first appears to be.

 SPY 1 min with a pretty clear looking 1 min intraday positive. SPY does have a similar problem to QQQ, just on the next timeframe.

If you look at the 2 min SPY chart it appears to be in line and is intraday today.

However, put it in context and again, doing an "A"-"B" comparison with the positive at the the 5th, 6th and 7th and comparing where price and 3C where then vs now, SPY 2 min doesn't look so good- Not a smoking gun, but an observation.

The 5 min chart remains the issue, it has gas in the tank from the positive, but it also has damage that is out of place and isn't accumulating a pullback if this indeed was to be a gap fill.

As for the other charts...
 QQQ 5 min, still kind of limbo.

IWM 2 min is leading negative, so that 1 min positive appears to be intraday only at this point.

IWM 5 min

As a potential prize for patience and diligence, there may be something developing in HYG, I watch this close as it is usually a giveaway as to what the market will do.

HYG has been rather supportive since the oversold lows, but this afternoon something may be changing.
 HYG 1 min intraday negative relative

HYG 2 min negative-possible migration

HYG 3 m leading negative.

This may be the first decent start of something.

Still Indecisive

This market just has a dull indecisive look about it, even though it's down pretty hard on the day, the difference between the SPX and RUT is showing up on our custom SPX:RUT Ratio indicator as NOT confirming today's lower prices.

I'll try not to bore you with a bunch of charts essentially showing nothing of useful interest, but I'll say that Pro Sentiment Indicators are in line to slightly positive with the SPX, they are not leading the market higher and they aren't collapsing. VXX and spot VIX are in line with the normal correlation vs SPX, but TLT is showing better relative performance, in fact most of the curve is showing better relative performance meaning yields are generally lower, some worse than others, which tends to attract prices toward them. I'd say this is one of the few charts that looked interesting to me.


30 year yields leading the SPX lower (yellow). However the bond market closes at 3 p.m., looking at the 3C charts of Treasury futures across the curve, it looks like very near term the 2 and 5 year have the best 3C charts supporting their moves higher (lower yields). The 10 and 30 year have had good 3C support all day, but nearing the close it's falling off a bit, not a glaring divergence, but not perfectly in line.

High Yield Credit is surprisingly dull. HYG is outperforming intraday vs the SPX by a bit, all of the other HY assets I check are mostly in line with the SPX, not hinting at higher or lower prices.

I see some intraday weakness in the $USDX and some intraday strength in the Yen, but the real divergences that moved USD/JPY were formed between 5 a.m. and 8 a.m. which is EXACTLY what moved the market lower from the overnight ramp on ECB QE chatter to in line with the closing divergences of 3C on Friday which were suggesting weakness this morning on the cash open.

As such, the signals for the pair were earlier today, not really now...
 $USDX 1 min was very negative between 5 and 8 a.m. as the Yen was very positive at the same time.

For whatever reason this 3C concept of picking up where it left off works, you can see the actual mechanics that fulfilled the 3C signals from the close Friday as you look at USD/JPY vs ES below.
USD/JPY in candlesticks and ES (purple) are tied together from 5-8 a.m. and the pair pulls Index futures lower after being ramped at the European open, quite an interesting chart from a scholastic point of view, other than that, I'd say at some point the $USD finds some legs.

I've been through most of the major currencies that would effect USD/JPY and haven't come up with anything really standing out. I've looked closely at the Treasury futures for 2, 5, 10 and 30 year and again, there's not a lot standing out that has enough confirmation to really warrant even posting a chart.

Intraday Index futures are mixed with a slight positive bias, but again this is intraday 1 min. The 5 min charts have caught down to the negative divergences that were there before the open so most are in line, again a little mix with a slightly more negative bias. Seven minute Index futures are the demarcation line like the 5 min 3C charts of the averages and like the 3C charts of the averages, at the next longest timeframe of 10 min, they go very negative, in similar fashion at the next longest timeframe for Index futures (15 min) they go negative, which I explained earlier when talking about multiple timeframe analysis, this is the highest probability resolution to whatever is going on with these 5 min charts, whenever they are finished in this mini cycle from the lows of the 6th.

The averages themselves are almost infuriating . The main theme is in line on 1-3 min charts and in many cases that's somewhat negative.

If you recall the Dominant Price/Volume Relationship from Friday, it was Price Down/Volume Down, which is the least influential relationship, I describe it as "Carry on" as in "Do whatever you were doing", which is more or less what the market is doing today. The 3C charts are more or less taking that right to heart and acting in the same manner, again as I said, for the most part in line with today's overall negative price action. The 5 min charts that I hoped to see give us a strong clue, I have realized are nearly perfectly in line as well since they got sloppy on the 8th. 

TICK is DEFINITELY negative today, a lot of prints at -1250 and worse.

This doesn't change or resolve the fact that there's essentially still gas in the tank for the initial oversold bounce we expected and that set up in the charts, which means right now everything really looks like "LIMBO".

I'm going to take a stab at this from a different direction unless some of these charts start to really move, and go through the watchlists and see if there's a dominant theme anywhere among them.

Again, I'm staying absolutely patient here...Patient with the positions I have open (short) and patient with the market and not try to force a trade that isn't there or doesn't have the signal that gives us a strong edge.

Sometimes the best thing you can do is be patient. Some of you may remember the SPX trading range that lasted well over a month with nothing moving more than +/-3% through the range, it was a time you did not want to be in the market or trying to force something to happen and as infuriating as it was to me, because there were so few to no 3C signals, it was only after that we realized why, the market was in a tight range in which you'd just have been in a meat grinder. We aren't at that point, but I would be patient.